A correction was expected for this week. A very strong downwards session remains within allowable limits for the Elliott wave count.
Summary: The trend is up. Consolidations and pullbacks may last a few weeks but should be viewed in the bigger context of an ongoing bull market. At support they may provide opportunities to join the trend.
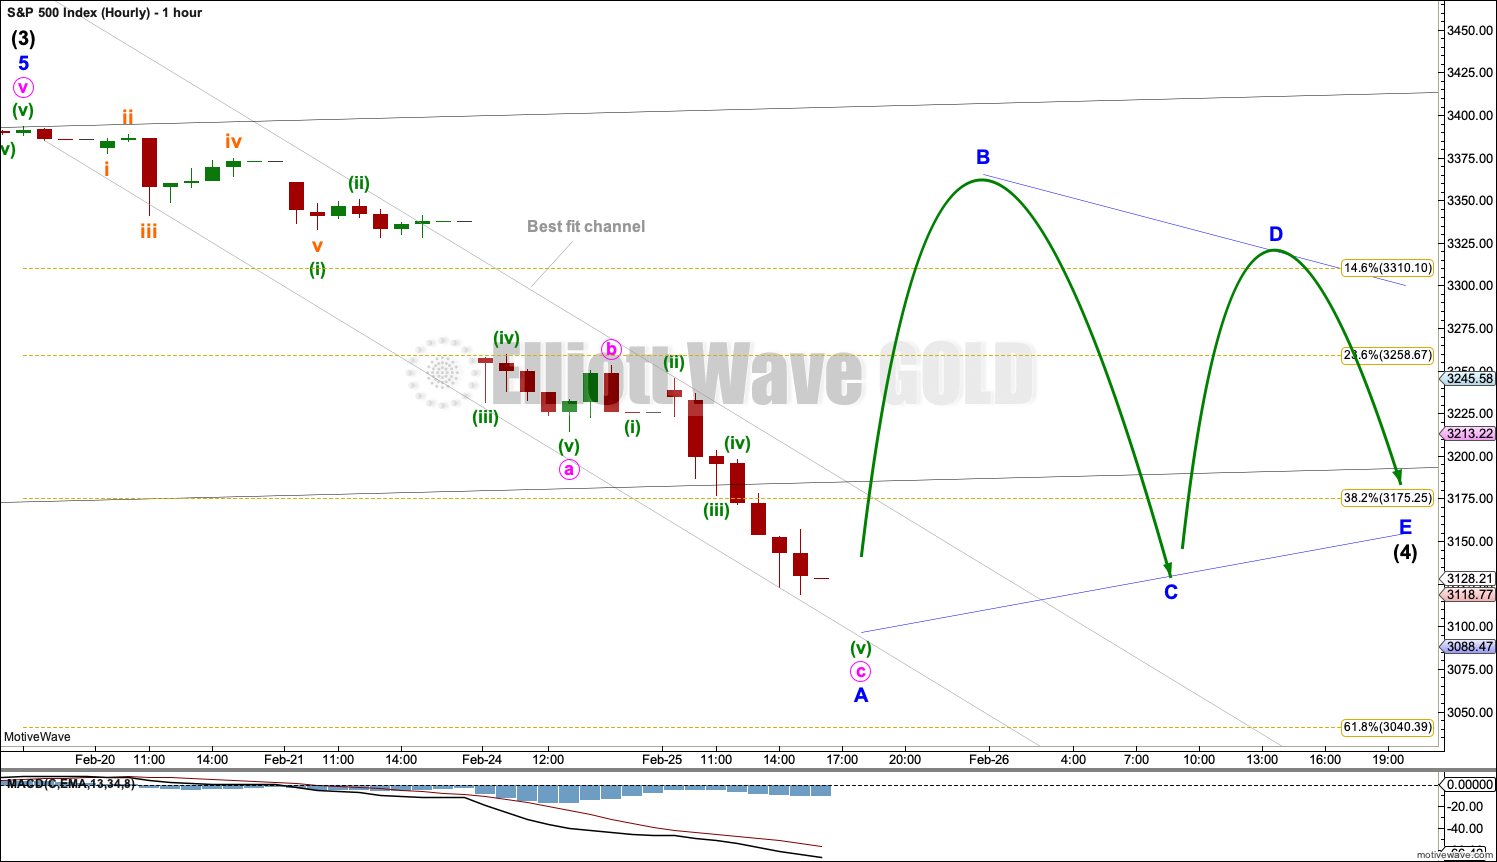
Intermediate wave (4) has arrived and is forming deeper than expected but remains above the invalidation point. It may continue lower or sideways for another one to few weeks before the bullish trend resumes. Next support may be about 3,075 and below that 3,040. Use the narrow channel on the hourly chart to indicate when this first wave down may be complete.
Two more large pullbacks or consolidations (fourth waves) during this year and possibly into next year are expected: for intermediate (4) (which is now underway) and then primary 4.
If price makes a new high by any amount at any time frame above 3,477.39 (even a fraction of a point on a tick chart), then this analysis switches to one of the very bullish alternate monthly charts. The next cycle degree target would then be either 4,092 or 4,213.
The biggest picture, Grand Super Cycle analysis, is here.
Last monthly charts analysis is here with video here.
ELLIOTT WAVE COUNTS
FIRST WAVE COUNT
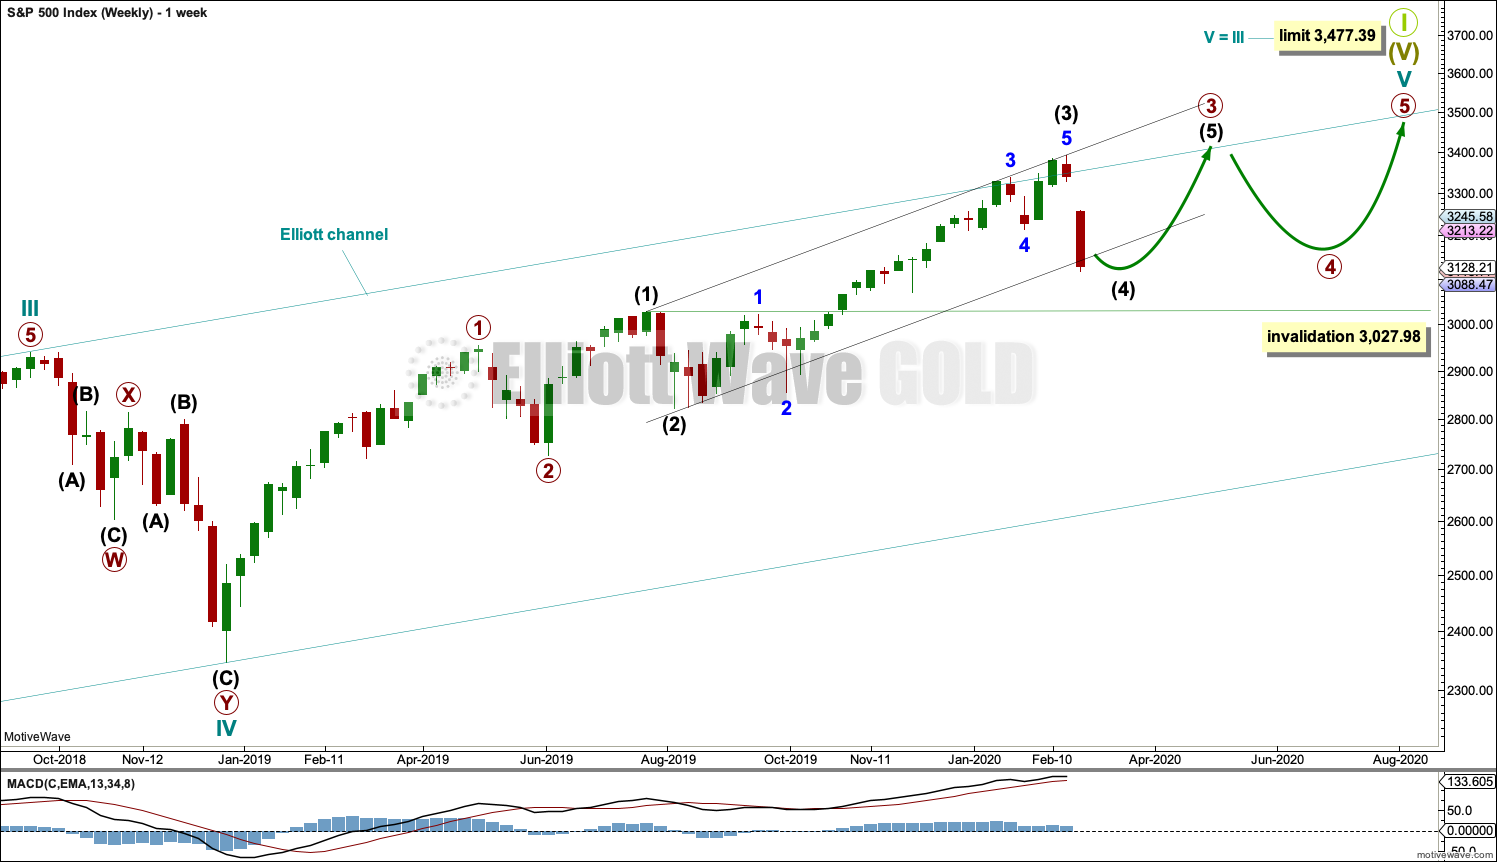
WEEKLY CHART
Cycle wave V may subdivide either as an impulse or an ending diagonal. Impulses are much more common, and it is clear at this stage that cycle wave V is an impulse and not a diagonal.
At this stage, cycle wave V may end within this year or possibly into next year.
A channel is drawn about the impulse of Super Cycle wave (V) using Elliott’s first technique. Draw this channel first from the high of 2,079.46 on the 5th of December 2014 to the high of 2,940.91 on the 21st of September 2018, then place a parallel copy on the low at 1,810.10 on the 11th of February 2016. Cycle wave IV found support about the lower edge.
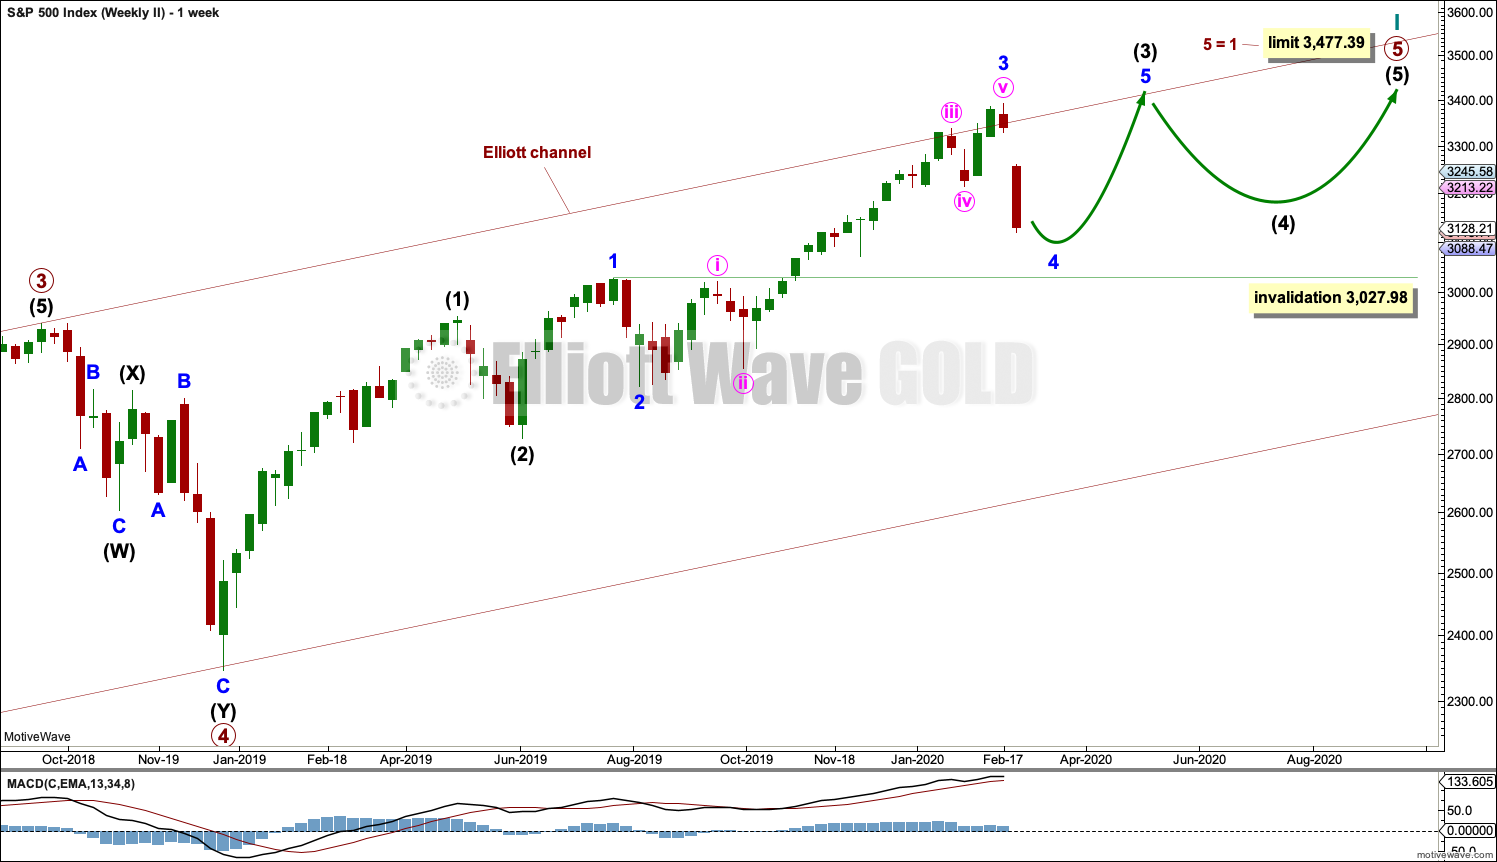
Within Super Cycle wave (V), cycle wave III may not be the shortest actionary wave. Because cycle wave III is shorter than cycle wave I, this limits cycle wave V to no longer than equality in length with cycle wave III at 3,477.39. A new high by any amount at any time frame above this point would invalidate this main wave count in favour of one of the two alternate wave counts in the monthly chart analysis which are much more bullish.
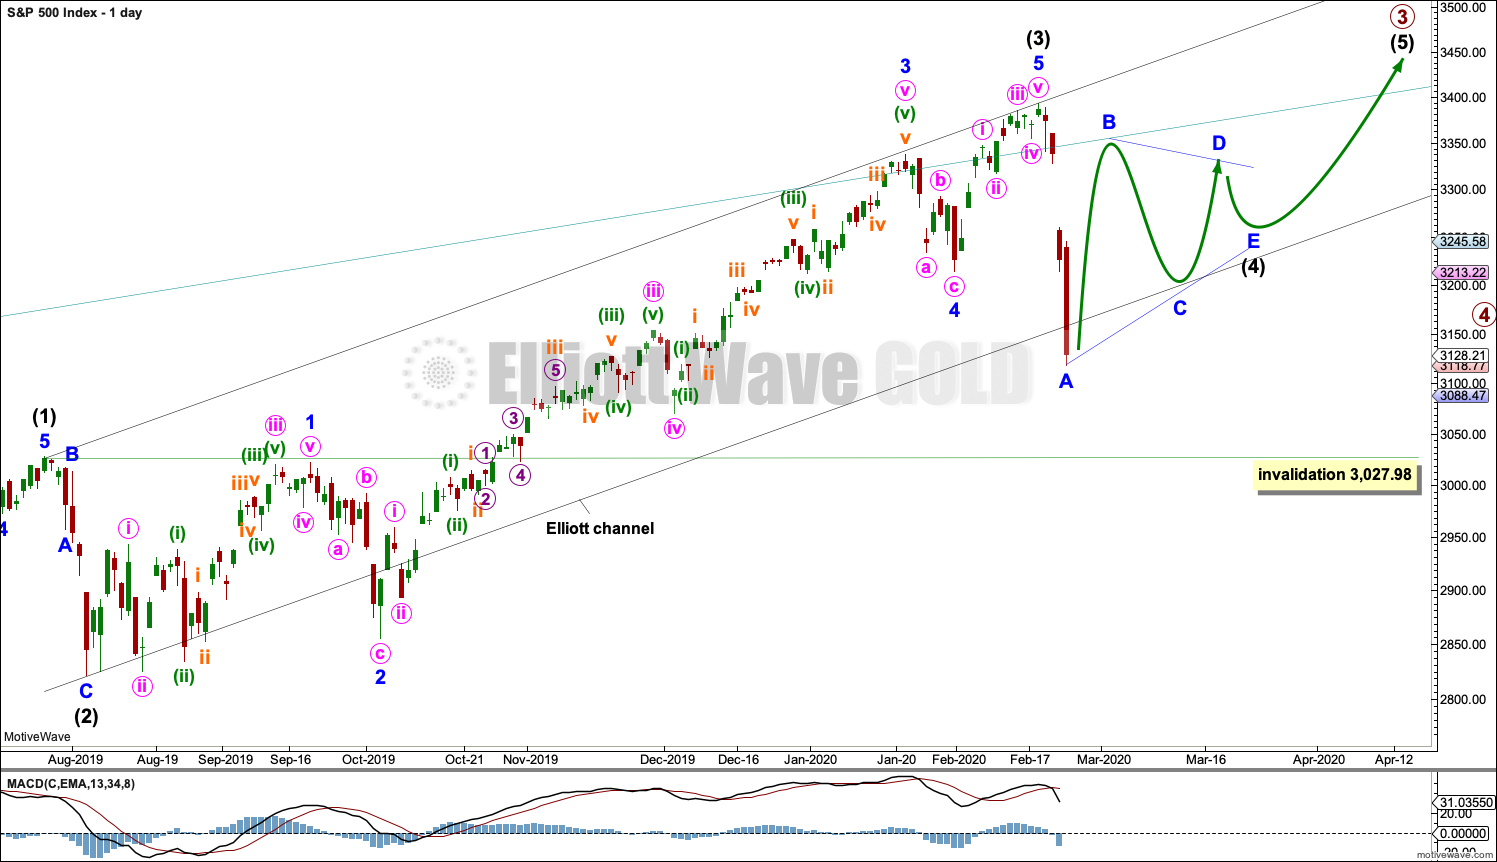
The daily chart below will focus on movement from the end of intermediate wave (1).
Within cycle wave V, primary waves 1 and 2 may be complete. Within primary wave 3, intermediate waves (1) through to (3) may be complete. Intermediate wave (4) may not move into intermediate wave (1) price territory below 3,027.98.
Within cycle wave V, the corrections of primary wave 2, intermediate wave (2) and minor wave 2 all show up clearly on the weekly chart. For cycle wave V to have the right look, the corresponding corrections of minor wave 4, intermediate wave (4) and primary wave 4 should also show up on the weekly chart. Minor wave 4 now shows up on the weekly chart, and so now two more large multi-week corrections are needed as cycle wave V continues higher, and for this wave count the whole structure must complete at or before 3,477.39.
DAILY CHART
Minor waves 2 and 4 for this wave count both subdivide as zigzags; there is no alternation in structure. Minor wave 2 is deep at 0.83 the length of minor wave 1, and minor wave 4 is shallow at 0.26 the length of minor wave 3; there is alternation in depth. Minor wave 2 lasted 10 sessions and minor wave 4 lasted 7 sessions; the proportion is acceptable and gives the wave count the right look.
There is no adequate Fibonacci ratio between minor waves 1 and 3. Minor wave 5 is 5.21 points short of 0.382 the length of minor wave 3.
Intermediate wave (2) subdivides as a zigzag that lasted 6 sessions and was deep at 0.69 of intermediate wave (1). Intermediate wave (4) may subdivide as any corrective structure, most likely one of either a flat, combination or triangle. It may also unfold as a zigzag.
Intermediate wave (4) should show up on the weekly chart, so it should last at least one week and possibly as long as three or four weeks if it is a more time consuming structure such as a triangle or combination.
Use Elliott’s first technique to draw a channel about primary wave 3. Draw the first trend line from the ends of intermediate wave (1) to intermediate wave (3) then place a parallel copy on the end of intermediate wave (2). Intermediate wave (4) may has today overshot the lower edge of this channel. If it continues lower, then the channel should be removed and redrawn using Elliott’s second technique when intermediate wave (4) is complete.
There are two broad groups of Elliott wave corrective structures: sharp pullbacks and bounces are the zigzag family, and sideways consolidations are all of flats, combinations and triangles. Two hourly charts will now be provided for each of these categories.
HOURLY CHART
This first hourly chart covers the sideways family of Elliott wave corrective structures: flats, combinations and triangles.
Within all of flats, combinations and triangles, the first wave must subdivide as a three wave structure, most likely a zigzag. That may now be almost complete and is labelled minor wave A (it may also be labelled minor wave W).
If intermediate wave (4) subdivides as a triangle (as labelled today), then the first wave within the triangle may be an almost complete zigzag labelled minor wave A. Minor wave B should then move higher and may make a new price extreme beyond the start of minor wave A at 3,393.52 as in a running triangle. Minor wave B would most likely subdivide as a zigzag.
If intermediate wave (4) subdivides as a flat correction, then minor wave A may be almost complete. Minor wave B must retrace a minimum 0.9 length of minor wave A. Minor wave B may make a new price extreme beyond the start of minor wave A at 3,393.52 as in an expanded flat. There is no upper invalidation point for this wave count for this reason.
If intermediate wave (4) subdivides as a combination, then the first structure may be almost complete and may be a zigzag labelled minor wave W. The double should then be joined by a three in the opposite direction labelled minor wave X, which would most likely subdivide as a zigzag. There is no minimum requirement for the length of minor wave X and it may make a new price extreme beyond the start of minor wave W at 3,393.52.
ALTERNATE HOURLY CHART
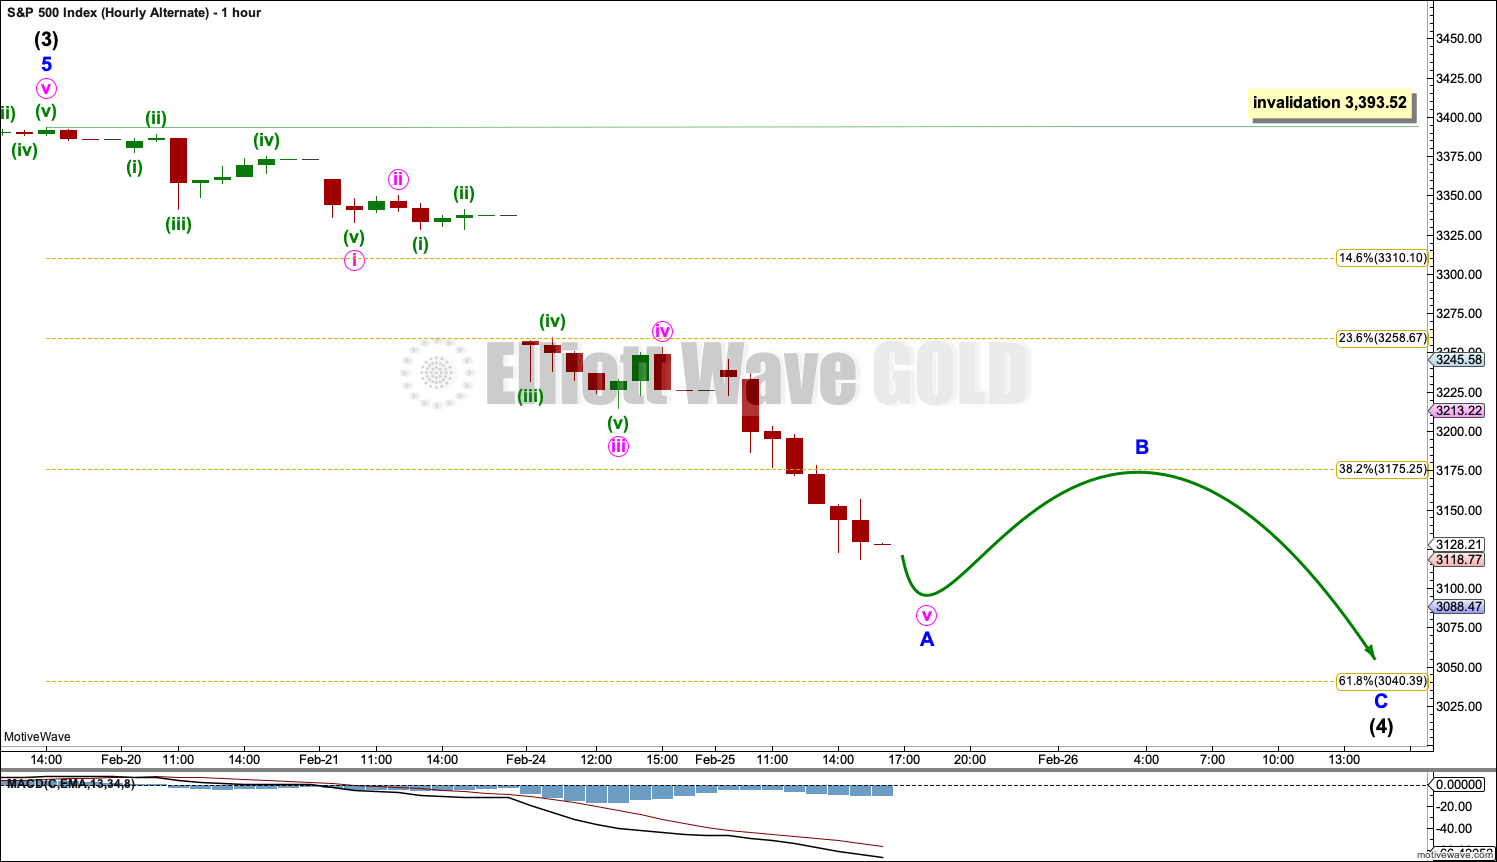
This alternate hourly wave count covers the other family of Elliott wave corrective strucutres, the zigzag family. This includes single, double and triple zigzags. The most common are single zigzags by a very wide margin.
If intermediate wave (4) unfolds as a zigzag, then it would exhibit no alternation in structure to the zigzag of intermediate wave (2). Alternation is a guideline, not a rule, and it is not always seen. When there is no alternation in structure between a second and fourth wave, they are most commonly both zigzags.
If intermediate wave (4) unfolds as a zigzag, then minor wave A within it may be an almost complete five wave impulse. When minor wave A may be complete, then minor wave B may unfold over one to a few days and may not make a new price extreme above the start of minor wave A at 3,393.52.
SECOND WAVE COUNT
WEEKLY CHART
This second wave count sees all subdivisions from the end of the March 2009 low in almost the same way, with the sole difference being the degree of labelling.
If the degree of labelling for the entirety of this bull market is all moved down one degree, then only a first wave at cycle degree may be nearing an end.
When cycle wave I is complete, then cycle wave II should meet the technical definition of a bear market as it should retrace more than 20% of cycle wave I, but it may end about either the 0.382 or 0.618 Fibonacci Ratios of cycle wave I. Cycle wave II may end close to the low of primary wave II within cycle wave I, which is at 1,810.10. It is also possible that cycle wave II could be fairly shallow and only barely meet the definition of a bear market.
The impulse is still viewed as nearing an end; a fifth wave is still seen as needing to complete higher. This wave count labels it primary wave 5. Primary wave 5 may still need another year to two or so to complete, depending upon how time consuming the corrections within it may be.
Primary wave 5 may be subdividing as an impulse, in the same way that cycle wave V is seen for the first weekly chart.
TECHNICAL ANALYSIS
WEEKLY CHART
Click chart to enlarge. Chart courtesy of StockCharts.com.
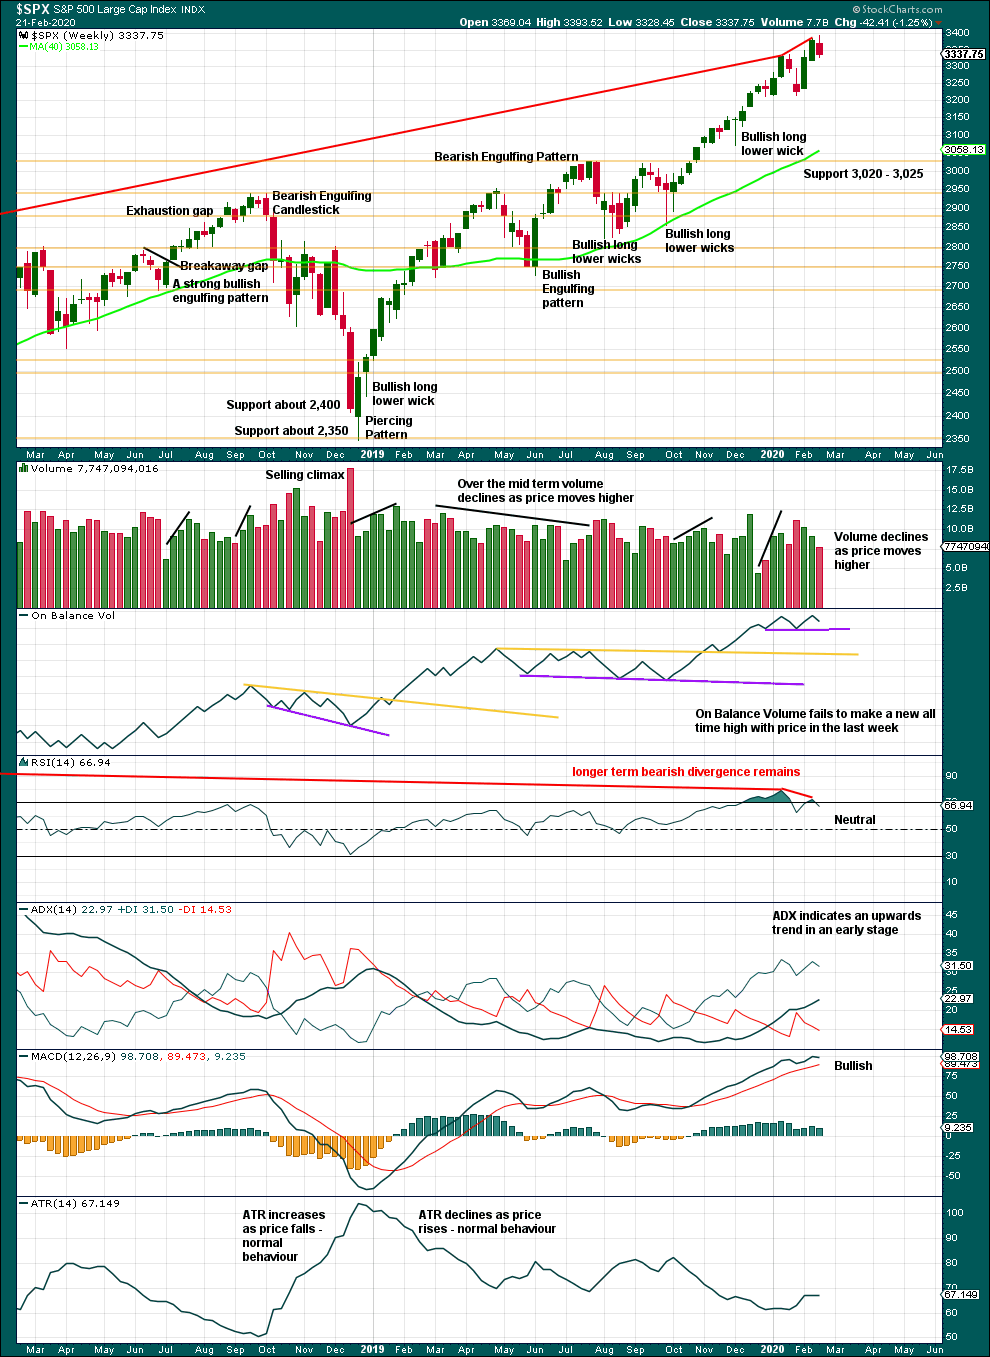
It is very clear that the S&P is in an upwards trend and the bull market is continuing. Price does not move in straight lines; there will be pullbacks and consolidations along the way.
This chart is overall bullish. There are no signs of weakness in upwards movement.
This bull market beginning in March 2009 has been characterised now for many years by rising price on declining volume. Despite all technical textbooks stating this is unsustainable, it has now been sustained for over a decade. This is concerning for an eventual bearish move as it may mean that support below is thin and weak, but for now the bull market continues. A decline in volume in current market conditions shall not be read necessarily as bearish.
Further pullbacks or consolidations will unfold. Do not expect price to move in a straight line. Pullbacks to support in a bull market may be used as opportunities to join an established trend.
Continued bearish divergence for the short term between price and RSI suggests the risk of a pullback remains high.
Last week sees upwards movement, but this is not confirmed by On Balance Volume.
DAILY CHART
Click chart to enlarge. Chart courtesy of StockCharts.com.
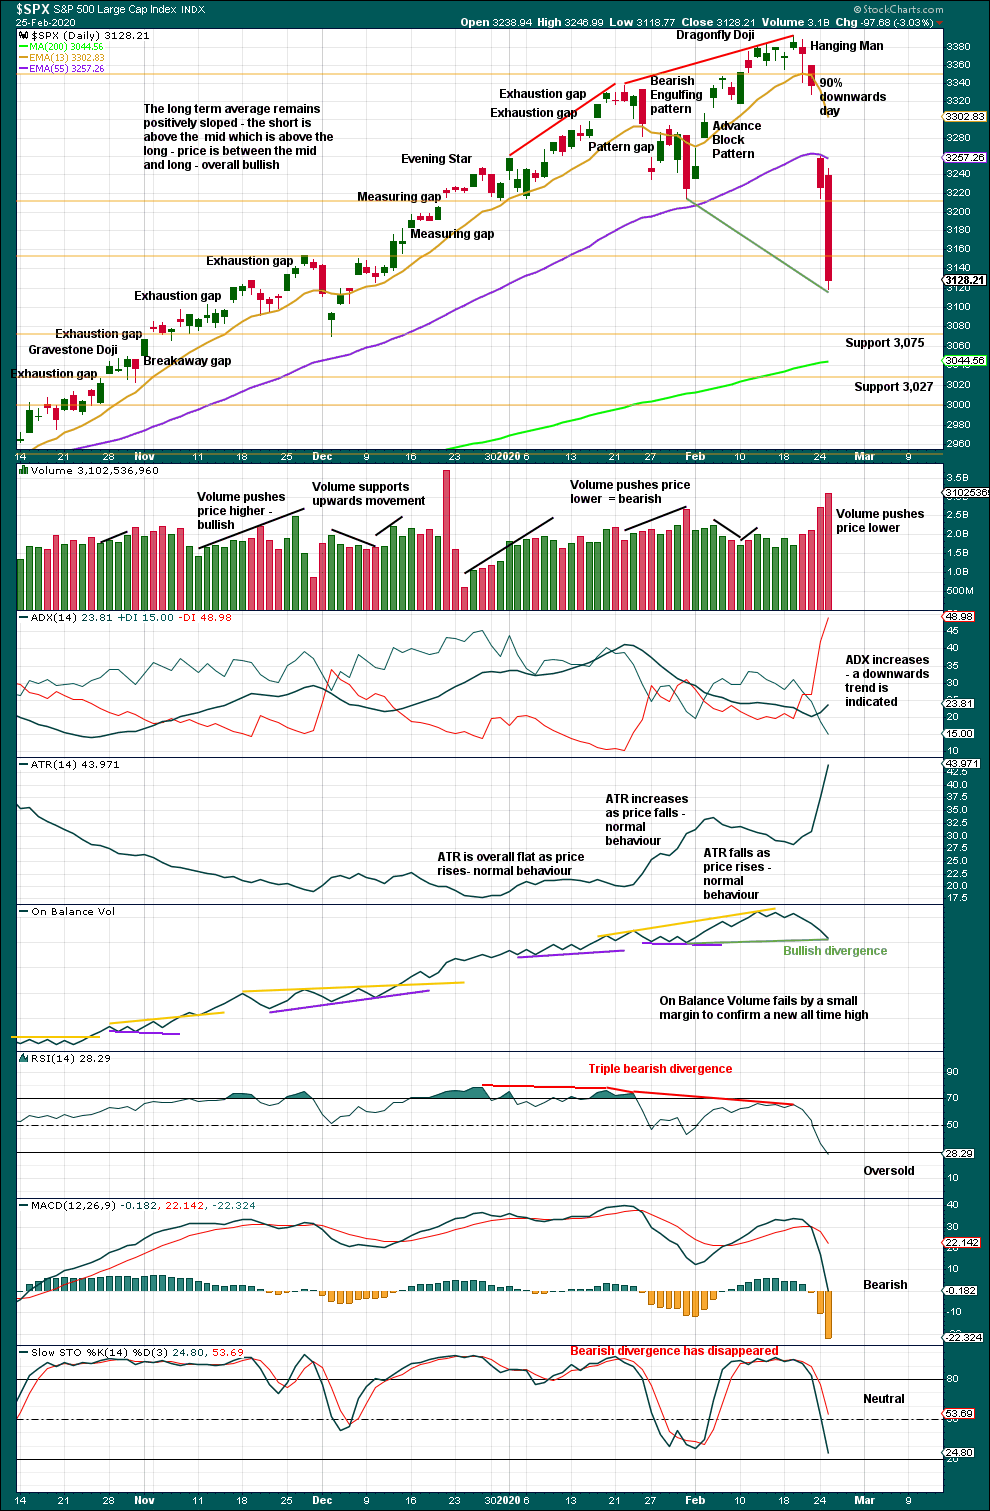
The larger trend, particularly at the monthly time frame, remains up. Expect pullbacks and consolidations to be more short term in nature although they can last a few weeks.
Following a 90% downwards day, either a 90% upwards day or two back to back 80% upwards days within 3 sessions would be required to indicate a 180°reversal in sentiment and indicate a sustainable low may be in place.
This last strong downwards session is close to another 90% downwards day with down volume 89% of total up / down volume, and decliners just short of 90% of total advances / declines.
With RSI reaching oversold today, it would be reasonable to expect a bounce here or very soon.
BREADTH – AD LINE
WEEKLY CHART
Click chart to enlarge. Chart courtesy of StockCharts.com. So that colour blind members are included, bearish signals
will be noted with blue and bullish signals with yellow.
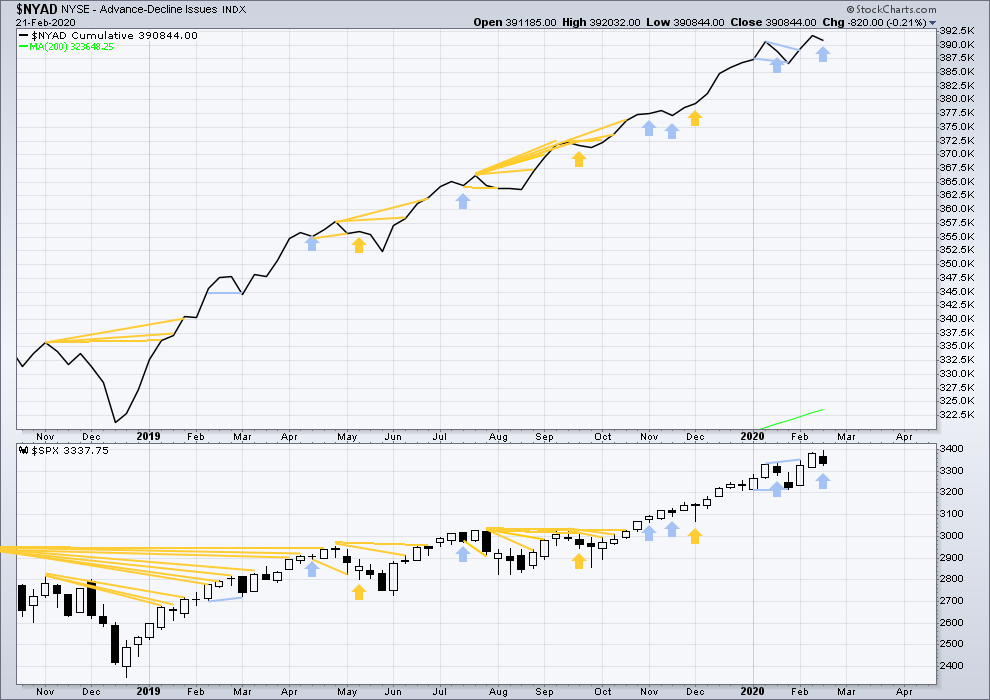
Bear markets from the Great Depression and onwards have been preceded by an average minimum of 4 months divergence between price and the AD line with only two exceptions in 1946 and 1976. With the AD line making new all time highs last week, the end of this bull market and the start of a new bear market is very likely a minimum of 4 months away, which is mid June 2020.
In all bear markets in the last 90 years there is some positive correlation (0.6022) between the length of bearish divergence and the depth of the following bear market. No to little divergence is correlated with more shallow bear markets. Longer divergence is correlated with deeper bear markets.
If a bear market does develop here, it comes after no bearish divergence. It would therefore more likely be shallow.
Last week price has moved higher, but the AD line has moved lower. This single week instance of bearish divergence supports the main Elliott wave count.
Large caps all time high: 3,393.52 on 19th February 2020.
Mid caps all time high: 2,109.43 on 20th February 2020.
Small caps all time high: 1,100.58 on 27th August 2018.
DAILY CHART
Click chart to enlarge. Chart courtesy of StockCharts.com. So that colour blind members are included, bearish signals
will be noted with blue and bullish signals with yellow.
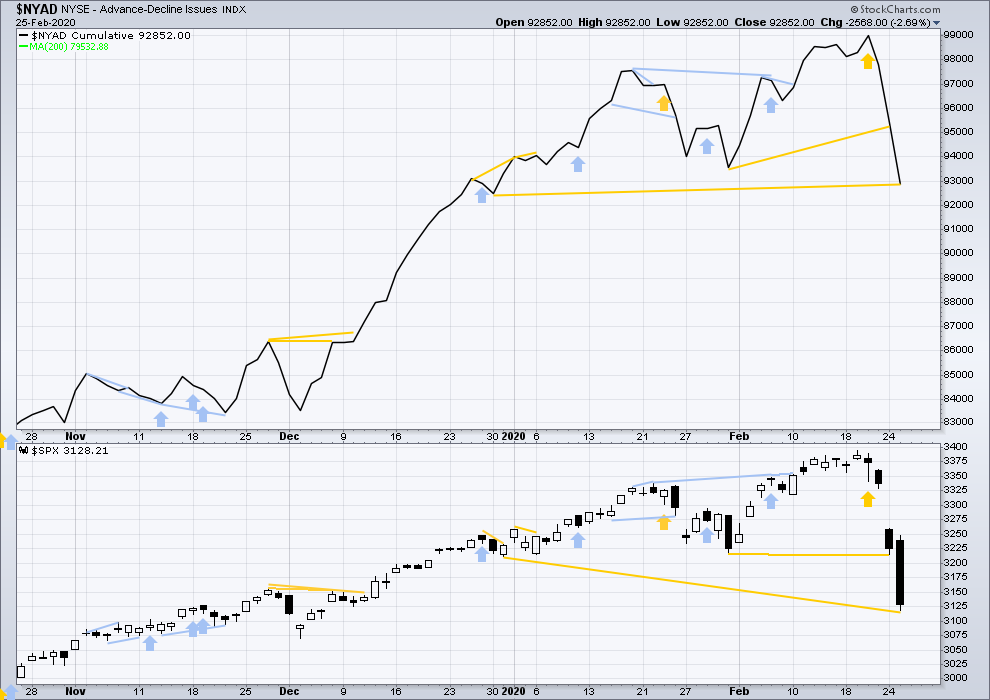
Breadth should be read as a leading indicator.
Both price and the AD line moved lower today. Price has made a new low below the prior swing low of the 30th / 31st of December 2019, but the AD line has not. This divergence is bullish.
VOLATILITY – INVERTED VIX CHART
WEEKLY CHART
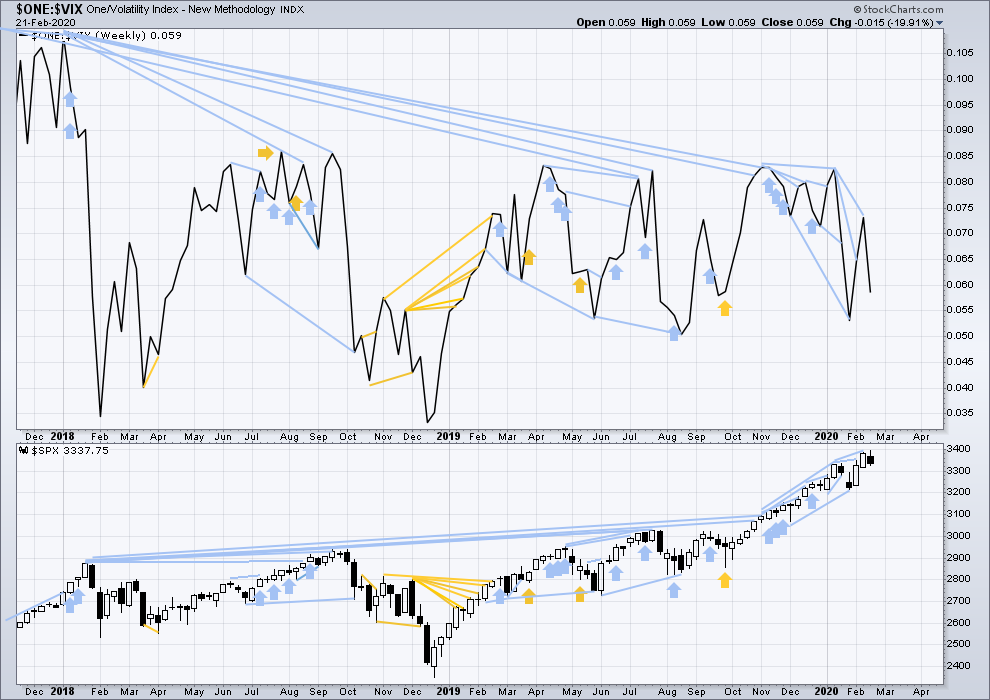
Click chart to enlarge. Chart courtesy of StockCharts.com. So that colour blind members are included, bearish signals
will be noted with blue and bullish signals with yellow.
The all time high for inverted VIX was on 30th October 2017. There is now over two years of bearish divergence between price and inverted VIX.
The rise in price is not coming with a normal corresponding decline in VIX; VIX remains elevated. This long-term divergence is bearish and may yet develop further as the bull market matures.
This divergence may be an early warning, a part of the process of a top developing that may take years. It is clearly not useful in timing a trend change from bull to a fully fledged bear market.
Last week both price and inverted VIX have moved lower. There is no new short-term divergence.
DAILY CHART
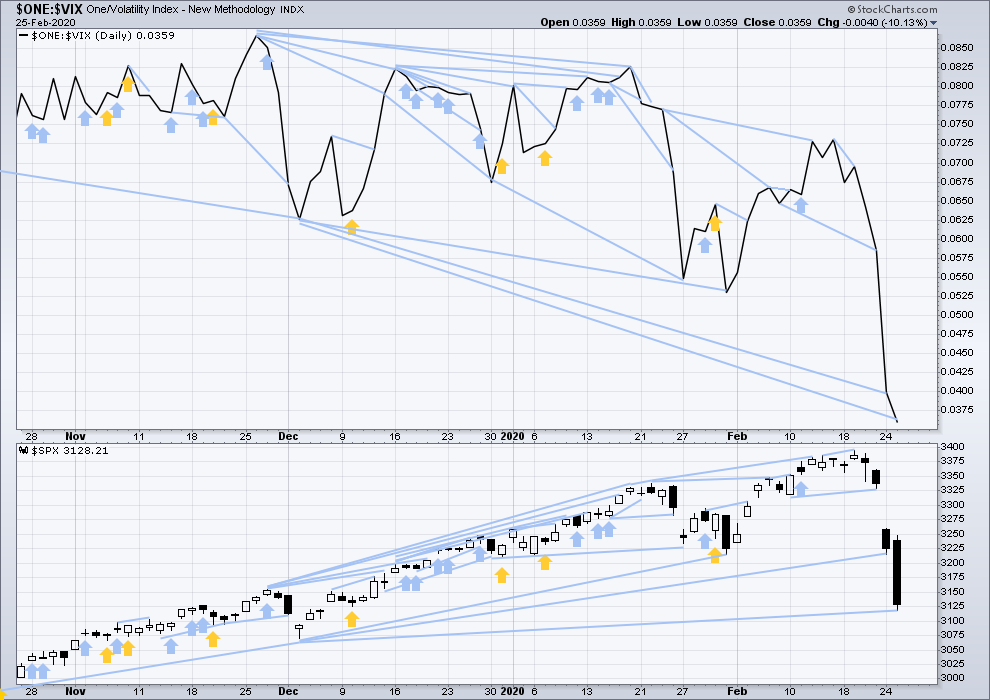
Click chart to enlarge. Chart courtesy of StockCharts.com. So that colour blind members are included, bearish signals
will be noted with blue and bullish signals with yellow.
Both price and inverted VIX moved lower again today. Inverted VIX has made another new low below the prior swing low of 3rd of December 2019, but price has not. This divergence is bearish, but it disagrees with the AD line. More weight will be given to the AD line.
DOW THEORY
Dow Theory confirmed a bear market in December 2018. This does not necessarily mean a bear market at Grand Super Cycle degree though; Dow Theory makes no comment on Elliott wave counts. On the 25th of August 2015 Dow Theory also confirmed a bear market. The Elliott wave count sees that as part of cycle wave II. After Dow Theory confirmation of a bear market in August 2015, price went on to make new all time highs and the bull market continued.
DJIA: 23,344.52 – a close on the 19th of December at 23,284.97 confirms a bear market.
DJT: 9,806.79 – price has closed below this point on the 13th of December.
S&P500: 2,532.69 – a close on the 19th of December at 2,506.96 provides support to a bear market conclusion.
Nasdaq: 6,630.67 – a close on the 19th of December at 6,618.86 provides support to a bear market conclusion.
With all the indices having moved higher following a Dow Theory bear market confirmation, Dow Theory would confirm a bull market if the following highs are made:
DJIA: 26,951.81 – a close above this point has been made on the 3rd of July 2019.
DJT: 11,623.58 – to date DJT has failed to confirm an ongoing bull market.
S&P500: 2,940.91 – a close above this point was made on the 29th of April 2019.
Nasdaq: 8,133.30 – a close above this point was made on the 26th of April 2019.
Published @ 06:31 p.m. EST.
—
Careful risk management protects your trading account(s).
Follow my two Golden Rules:
1. Always trade with stops.
2. Risk only 1-5% of equity on any one trade.
—
New updates to this analysis are in bold.

Looky there!
ES at EXACTLY 3100.00!!!
A big move’s a’comiing…..
ES bounced off 3078 like a hand off a hot plate and only took 10 mins to get back to 3103.25.
It’s a break of the previous low.
The graph looks like waterfalls, and gravity attracts…
ES already knocking on 3100. It HAS to hold so I expect quite a dog-fight…Yikes!!
Downward break from triangle “shouuld” find a bottom soon methinks….
ES made a low at 3091 in the overnight session this morning. This is the level to watch overnight
Hourly chart updated:
A slight relabelling of the middle of minute a, and it now has a better look. Minuette (iii) looks more like a five wave impulse now.
Minor A could be over here or very soon, but wait for the narrow best fit channel to be breached before having any confidence in this view.
That’s a comforting chart for me at least…now let’s break that channel line and get on with the B. Come on buyers, the water’s fine!!!
The big question here and now is what do the bankers/algo’s do in the overnight market tonight? They have total control there seems to me, and can do any damn thing they want, move price anywhere, and the day session just accepts it and moves along from there. (Notice the vast increase in size of overnight moves over the last 3 months.) Have they accumulated enough to warrant a drive up in prices tonight? Perhaps…
Sadly the last two candlesticks aren’t looking very strong and it looks like the channel won’t be breached this session.
While price remains within that channel I cannot have confidence a low is in yet.
It will come, and sooner rather than later now because RSI doesn’t usually remain oversold for long for this market.
No kidding!
Watching ES with great interest to see of they hold 3100, cuz if they don’t….!!
17:00 pause…. 3100
Watch VIX. If we break back above long term falling resistance at 30 there will be (more) blood…!
We are currently at 50% retracement (3125). Next target is 3060 which is 61.8% and then 3030 as Kevin mentioned.
Looking like yet another triangle of some sort underway with possible downside break…
Verne – Possible head fake into the close. Notice that repo market has been pretty quite i.e. not significant buckets of fed money being put (just yet) but that can change in a hurry and we all have seen this.
We have to accept the numbers they proffer with regard to overnight liquidity injections. My tracking of money flows in the current market shows very deep pockets on an unprecedented buying spree…..it is really unbelievable…!
Reload silver?
Cashed out 16.00 strike March 13 SLV calls a few days ago…long and strong on longer dated contracts. The next move up should be a head spinner…!!
Bulls doing a good job of defending the 3100 round number thresh-hold.
They have to hold it into the close or we likely target 3100 before we bounce….
It’s trying hard to breach 76 level at 3112 on downside but so far it found good support there. We’ll see what happens overnight – it looks like it wants to go down more.
Meant 3000.00….but you knew that! 🙂
RUT on 61.8% retrace levels now. Will they hold?
anyone ever watch for rdr or red dog reversal? 3 or more down days followed by a positive open, new low, close near day highs. great trend reversal indicator. I think we are seeing one form here
Which basically simply means a hammer candle forming, in other words. Let’s see how the day ends and if that candle, if it forms, will hold
hello again,, Im back for a while
Looks like either 5 of three down or five of A/ 1…
We could be seeing some extended waves…
One more low?
Taking bets…. winner gets a Wuhan chicken dinner.
you’ve already won sir. Enjoy your fine dining…
the 50% at 3105 is next up. If that falls…
the 61.8% level at 3035 becomes in play.
and there’s the 200 day MA at 3046. THAT should provide support…
I have been wondering sbout a test of the fat round 3000.00….
Verne,
Great call yesterday for a VIX move to 30. I have the high of the day at 30.25!
McClellan Oscillator closed yesterday of -95 below its lower BB, currently above.
SPX closed below its lower BB yesterday and is currently right at the BB.
VIX closed above its upper BB yesterday and is currently just above its upper BB.
If these three make a move with a close today inside their respective BBs, it will be a relatively reliable buy signal. If this happens, then on Thursday I will look for a continued move down in VIX. If again closes lower, this could be considered a confirmation of the buy signal.
Like Kevin, I am guessing we will see Intermediate 4 develop into a triangle and thus took some long positions as Minor A may be the low in price for all of the correction. If Intermediate 4 develops into a flat with a lower low, it would be time to take additional long positions on a new low below 3128 SPX. Otherwise, I will look for a low in Minor C of a triangle to complete the purchase of my full long position.
That is my plan anyway. Now we wait and look for more EW clues knowing that the larger wave count tells us, 3400+ on the SPX is the next big move. For supporting evidence, one might watch the C. Ciavacio videos. His “Short Takes” blog post this week is quite good.
Have a great day all.
Hiya Rod. You know how I love volatility…!
TLT bull flag targeting around 160.00
Implication is a collapse in long term rates, with further yield curve inversion.
Just made this little historical observations.
From 01/01/1950 to 12/31/2019, the SPX droped more than 3% on 115 occasions (of which, 24 in 2008).
The SPX droped more than 3% on 2 consecutive days on 5 occasions only:
19/20-Nov-08 (-6.1% -6.7% = -12.8%)
05/06-Nov-08 (-5.3% -5.0% = -10.3%)
21/22-Oct-08 (-3.1% -6.1% = -9.2%)
06/07-Oct-08 (-3.9% -5.7% = -9.6%)
30/01-Oct-98 (-3.1% -3.0% = -6.1%)
So if dropping 3%+ is not rare (historical probability is 0.65%), dropping 3%+ twice in a row is (0.03%), and dropping 3 times in a row did not occur.
24/25-Feb-20 move was -3.3% -3.0% = 6.3%, which looks like 30/01-Oct-98.
If you look at the SPX in Q3/Q4 1998, and you make the analogy Coronavirus ~ Russian crisis of ’98, there is more pain in the cards very shortly. There certainly was for LTCM at the time!
Quite possible if not virtually certain. This market at BEST is going to be highly volatile for weeks; you don’t fall over 6% and NOT ring like bell for awhile!
But as for going lower than the low established, I’d put that at maybe 50-50 myself. I’m suspecting a big triangle here as the most likely structure. But I’m often wrong.
I’m long for mid Mar (with lots of room to accommodate to the downside, I’ve sold put spreads in RUT and SPX that are quite a ways lower than the low established here), and I’m long for the remainder of this week. The bounce is on right now; how far is unknown but that’s trading.
From the top last week, the SPX has traced a clear 5-wave down to the downside.
I’m wishfully waiting for an A-B-C rally into 3300 (currently in A), followed by a drop to new lows.
maybe not so clear?; it’s moving deeper now, after what looks like a iv wave up today to start the day.
Equities up and rising, bonds down, gold flat, oil up…looks like a risk on day. Whew.
Start of Minor B. ???
Highest probability I’d say.
Well that didn’t last. Now equities down, bonds up, gold up! And oil way down. Everything has reversed to more significant risk off.
Yeah lost all my profits in a flash!
well I didn’t lose all but I lost about 60% of the day’s profits from short term longs. It’s a “high fear” market.
Futures painting a negative open with S&P down over 20 points to 3,111.75
DJI has dropped into the Intermediate 1 price territory with similar count as SPX, I am fully aware that both could have different counts but they are highly correlated and I wonder as previously mentioned that we possibly just completed minor 1 in SPX at the ATHs and now in minor 2, so possibly a very strong move up of possibly 700-800 points in SPX once it bottoms. Anyone else has any view on DJI count??
That depends where the corresponding first wave would be. It could be as low as 26,241.42.
Thanks Lara.
That is the Feb-2019 high, so that was primary 1, then we completed primary 3 then this would be primary 4..
Well DJI may complete an ending diagonal and SPX an impulse, as it’s 5th wave.. I’ll look in more detail of the DJI count later today when I’ll have more time.
Thanks as always.
DJIA could also have an ending diagonal unfolding. Which would put the invalidation point as low as 25,339.60.
In short, they would have different wave counts. They could be quite different indeed. So it’s not a good idea to extrapolate my S&P wave count to DJIA.
A tremendous amount of technical damage has been inflicted on this historic decline. Supply/demand data shows frenetic purchases by the working group. My own trading theory about the behavior of initial waves down with respect to multiple S/R pivots suggests things could get interesting…
its me,, your worst nightmare.
Missed again 🙁
Yes!
Maybe?