Downwards movement was expected to continue this week as a larger correction has arrived. This is exactly what is happening.
Summary: The trend is up. Consolidations and pullbacks may last a few weeks but should be viewed in the bigger context of an ongoing bull market. At support they may provide opportunities to join the trend.
Intermediate wave (4) has arrived. It may continue now either sideways or lower for another one to few weeks. Today some bullish divergence between price and the AD line suggests that despite strong downwards movement today this correction may more likely be shallow and support may be found here or very soon.
Two more large pullbacks or consolidations (fourth waves) during this year and possibly into next year are expected: for intermediate (4) (which may have just arrived) and then primary 4.
If price makes a new high by any amount at any time frame above 3,477.39 (even a fraction of a point on a tick chart), then this analysis switches to one of the very bullish alternate monthly charts. The next cycle degree target would then be either 4,092 or 4,213.
The biggest picture, Grand Super Cycle analysis, is here.
Last monthly charts analysis is here with video here.
ELLIOTT WAVE COUNTS
FIRST WAVE COUNT
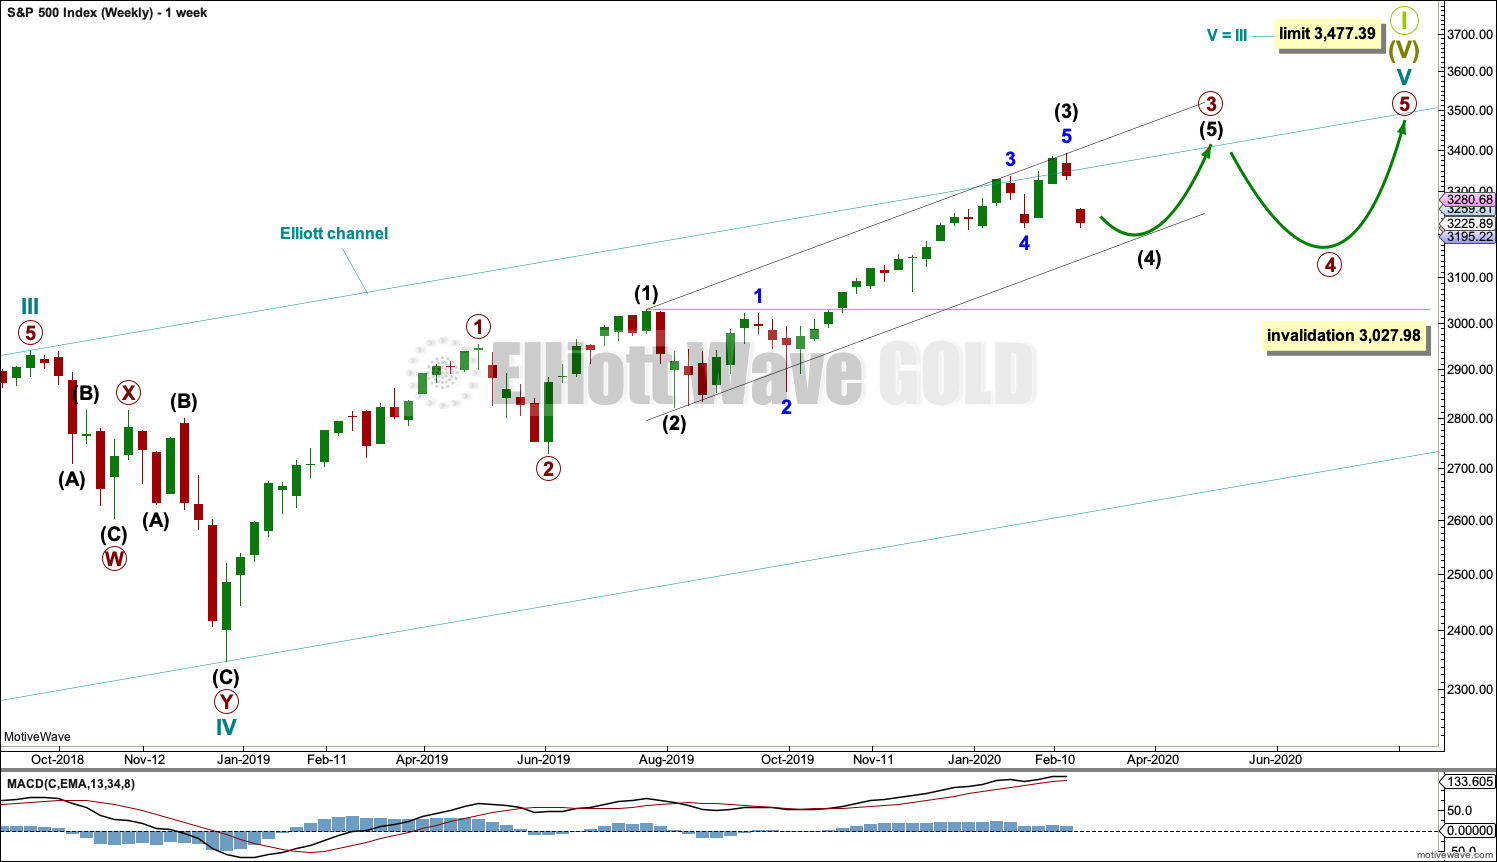
WEEKLY CHART
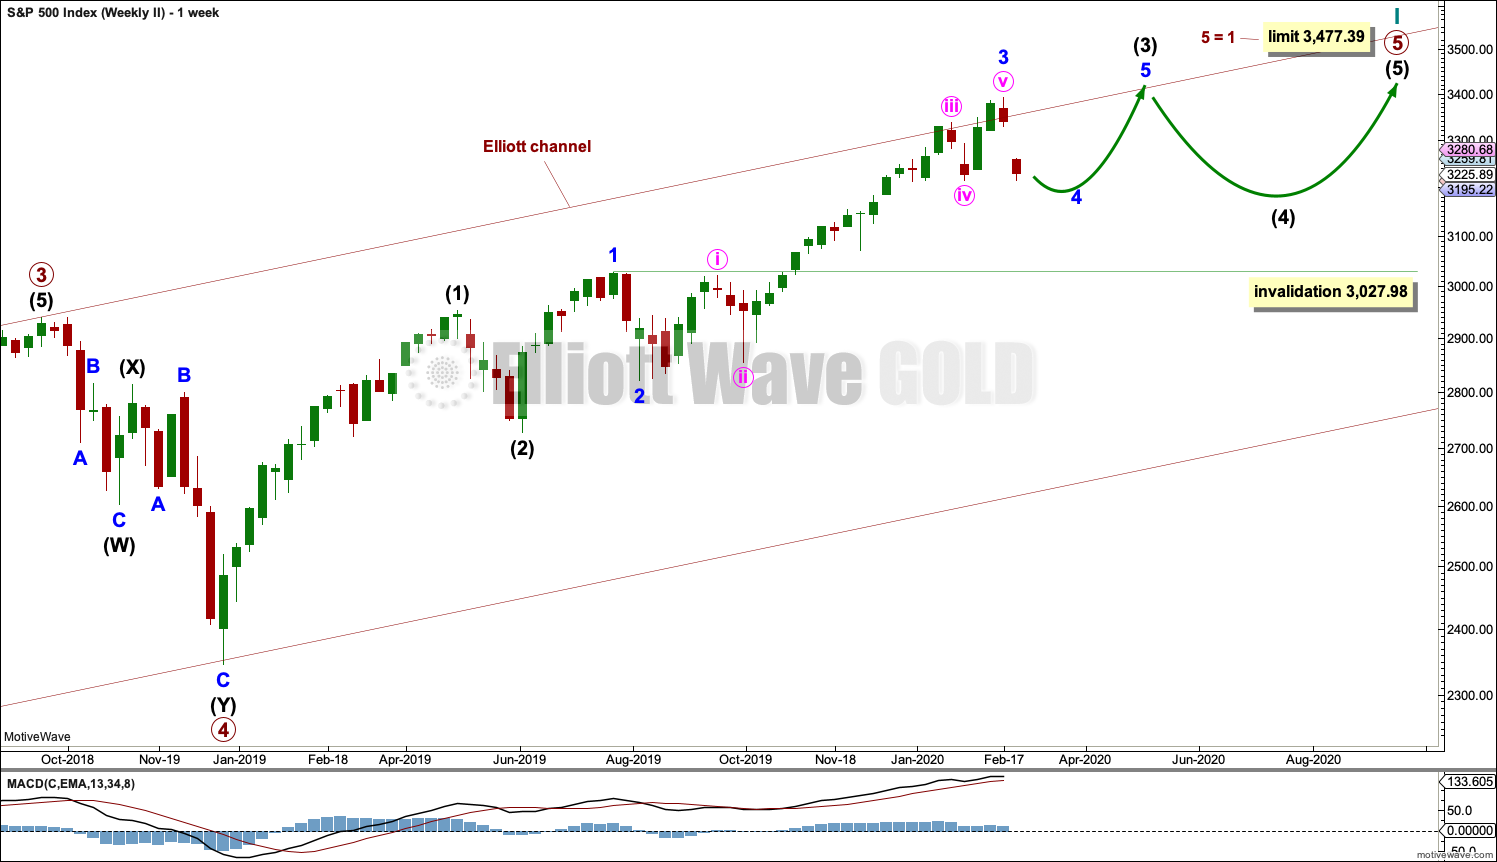
Cycle wave V may subdivide either as an impulse or an ending diagonal. Impulses are much more common, and it is clear at this stage that cycle wave V is an impulse and not a diagonal.
At this stage, cycle wave V may end within this year or possibly into next year.
A channel is drawn about the impulse of Super Cycle wave (V) using Elliott’s first technique. Draw this channel first from the high of 2,079.46 on the 5th of December 2014 to the high of 2,940.91 on the 21st of September 2018, then place a parallel copy on the low at 1,810.10 on the 11th of February 2016. Cycle wave IV found support about the lower edge.
Within Super Cycle wave (V), cycle wave III may not be the shortest actionary wave. Because cycle wave III is shorter than cycle wave I, this limits cycle wave V to no longer than equality in length with cycle wave III at 3,477.39. A new high by any amount at any time frame above this point would invalidate this main wave count in favour of one of the two alternate wave counts in the monthly chart analysis which are much more bullish.
The daily chart below will focus on movement from the end of intermediate wave (1).
Within cycle wave V, primary waves 1 and 2 may be complete. Within primary wave 3, intermediate waves (1) through to (3) may be complete. Intermediate wave (4) may not move into intermediate wave (1) price territory below 3,027.98.
Within cycle wave V, the corrections of primary wave 2, intermediate wave (2) and minor wave 2 all show up clearly on the weekly chart. For cycle wave V to have the right look, the corresponding corrections of minor wave 4, intermediate wave (4) and primary wave 4 should also show up on the weekly chart. Minor wave 4 now shows up on the weekly chart, and so now two more large multi-week corrections are needed as cycle wave V continues higher, and for this wave count the whole structure must complete at or before 3,477.39.
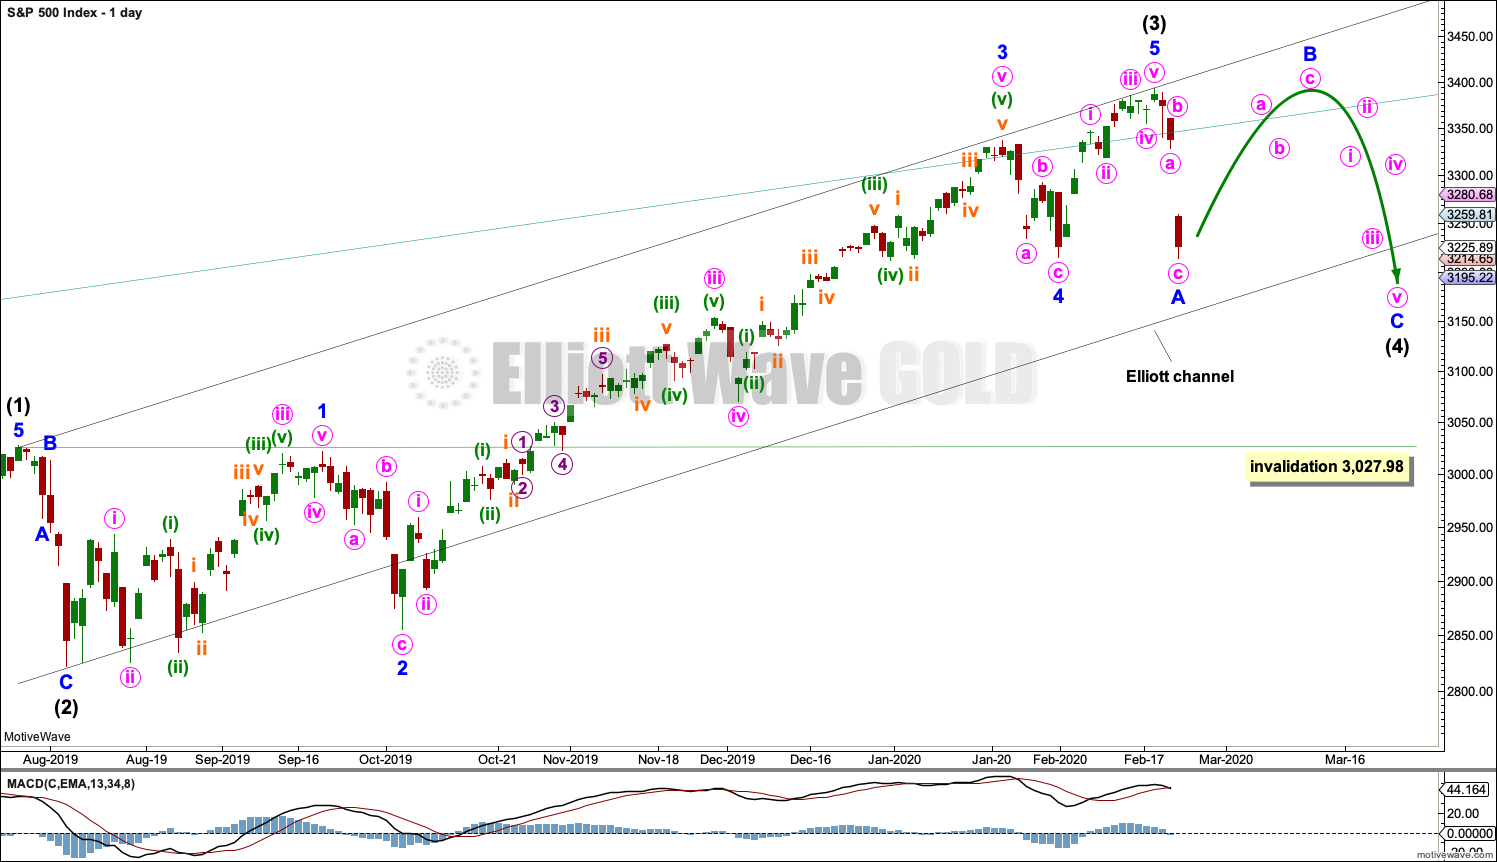
DAILY CHART
Minor waves 2 and 4 for this wave count both subdivide as zigzags; there is no alternation in structure. Minor wave 2 is deep at 0.83 the length of minor wave 1, and minor wave 4 is shallow at 0.26 the length of minor wave 3; there is alternation in depth. Minor wave 2 lasted 10 sessions and minor wave 4 lasted 7 sessions; the proportion is acceptable and gives the wave count the right look.
There is no adequate Fibonacci ratio between minor waves 1 and 3. Minor wave 5 is 5.21 points short of 0.382 the length of minor wave 3.
Intermediate wave (2) subdivides as a zigzag that lasted 6 sessions and was deep at 0.69 of intermediate wave (1). Intermediate wave (4) may subdivide as any corrective structure, most likely one of either a flat, combination or triangle. It may also unfold as a zigzag.
Intermediate wave (4) should show up on the weekly chart, so it should last at least one week and possibly as long as three or four weeks if it is a more time consuming structure such as a triangle or combination.
Intermediate wave (4) may end within the price territory of one lesser degree; minor wave 4 has its price territory from 3,337.77 to 3,214.68. Today intermediate wave (4) has reached slightly below the lower edge of this range. This is acceptable.
Use Elliott’s first technique to draw a channel about primary wave 3. Draw the first trend line from the ends of intermediate wave (1) to intermediate wave (3) then place a parallel copy on the end of intermediate wave (2). Intermediate wave (4) may find support about the lower edge of this channel.
There are two broad groups of Elliott wave corrective structures: sharp pullbacks and bounces are the zigzag family, and sideways consolidations are all of flats, combinations and triangles. Two hourly charts will now be provided for each of these categories.
HOURLY CHART
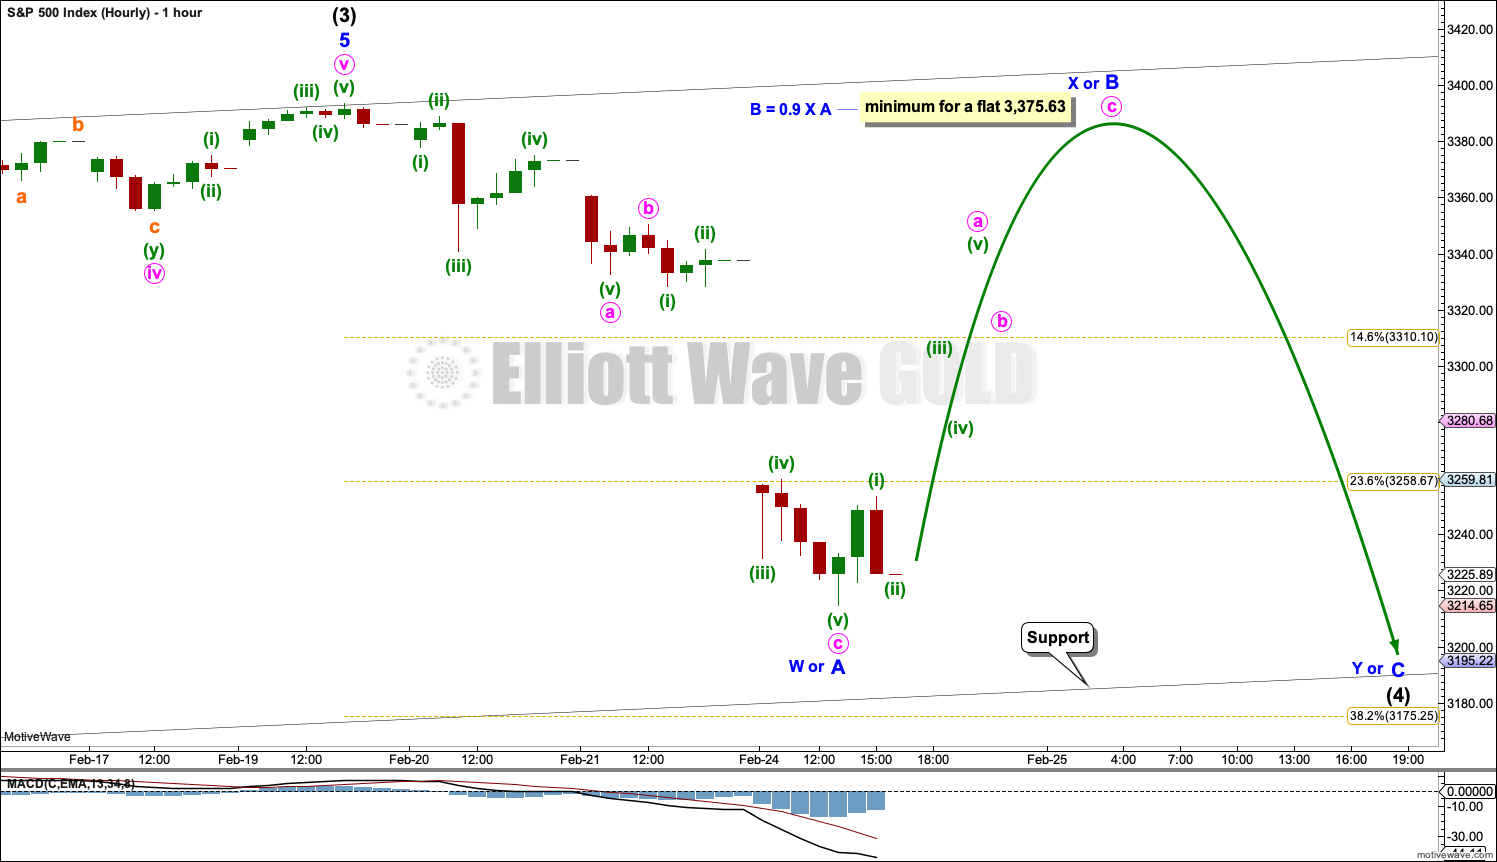
This first hourly chart covers the sideways family of Elliott wave corrective structures: flats, combinations and triangles.
Within all of flats, combinations and triangles, the first wave must subdivide as a three wave structure, most likely a zigzag. That may now be complete and is labelled minor wave A or W.
If intermediate wave (4) subdivides as a flat correction, then minor wave A may now be complete. Minor wave B must retrace a minimum 0.9 length of minor wave A at 3,375.63. Minor wave B may make a new price extreme beyond the start of minor wave A at 3,393.52 as in an expanded flat. There is no upper invalidation point for this wave count for this reason.
If intermediate wave (4) subdivides as a combination, then the first structure may now be complete and may be a zigzag labelled minor wave W. The double should then be joined by a three in the opposite direction labelled minor wave X, which would most likely subdivide as a zigzag. There is no minimum requirement for the length of minor wave X and it may make a new price extreme beyond the start of minor wave W at 3,393.52.
If intermediate wave (4) subdivides as a triangle, then the first wave within the triangle may now be a complete zigzag labelled minor wave A. Minor wave B should then move higher and may make a new price extreme beyond the start of minor wave A at 3,393.52 as in a running triangle. Minor wave B would most likely subdivide as a zigzag.
It is also possible that minor wave A or W may not be yet complete and may extend lower.
ALTERNATE HOURLY CHART
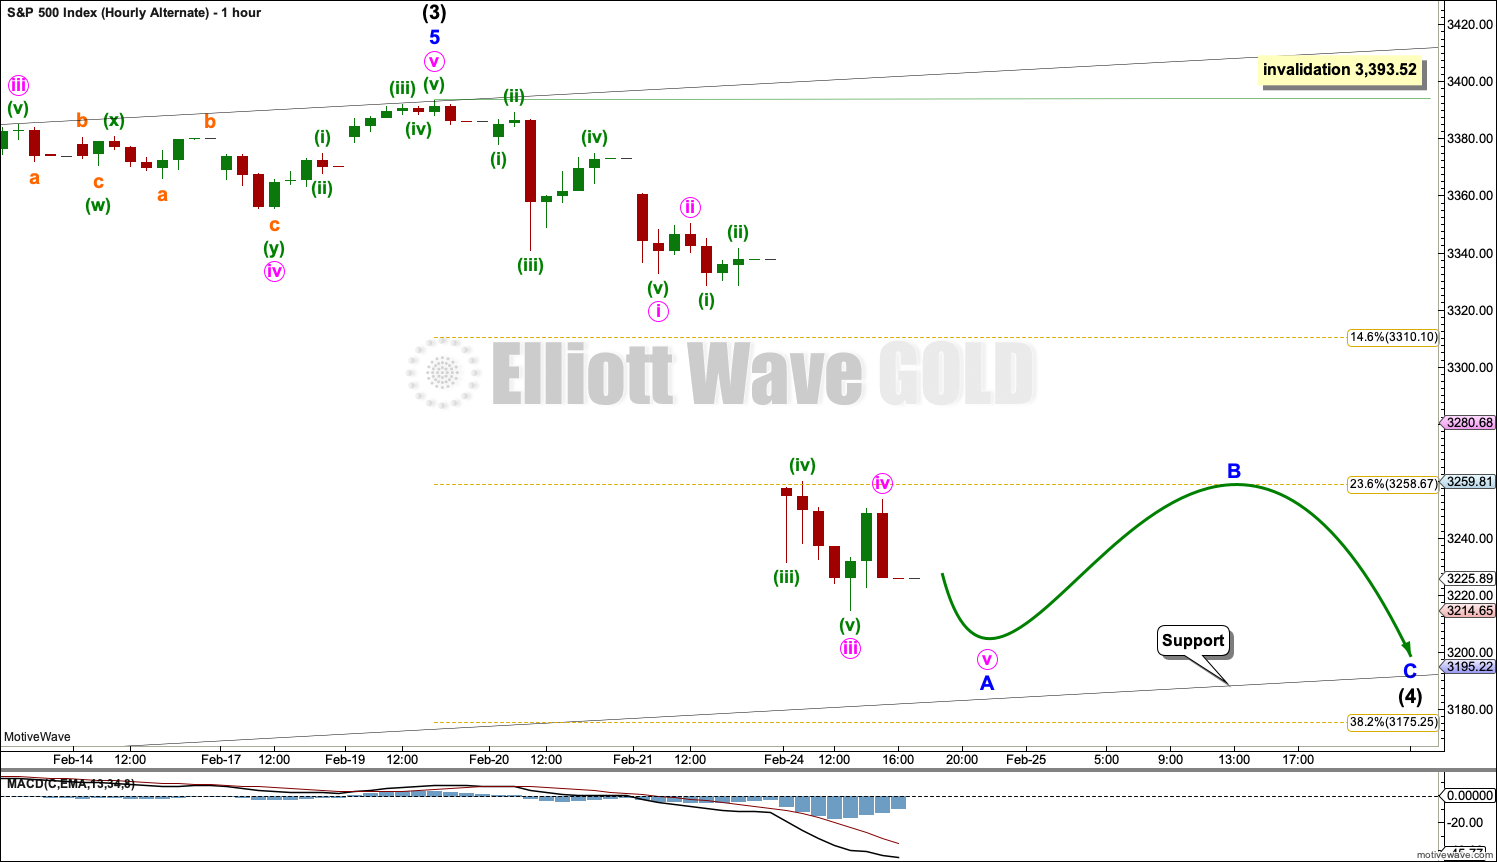
This alternate hourly wave count covers the other family of Elliott wave corrective strucutres, the zigzag family. This includes single, double and triple zigzags. The most common are single zigzags by a very wide margin.
If intermediate wave (4) unfolds as a zigzag, then it would exhibit no alternation in structure to the zigzag of intermediate wave (2). Alternation is a guideline, not a rule, and it is not always seen. When there is no alternation in structure between a second and fourth wave, they are most commonly both zigzags.
If intermediate wave (4) unfolds as a zigzag, then minor wave A within it may be a complete five wave impulse. When minor wave A may be complete, then minor wave B may unfold over one to a few days and may not make a new price extreme above the start of minor wave A at 3,393.52.
SECOND WAVE COUNT
WEEKLY CHART
This second wave count sees all subdivisions from the end of the March 2009 low in almost the same way, with the sole difference being the degree of labelling.
If the degree of labelling for the entirety of this bull market is all moved down one degree, then only a first wave at cycle degree may be nearing an end.
When cycle wave I is complete, then cycle wave II should meet the technical definition of a bear market as it should retrace more than 20% of cycle wave I, but it may end about either the 0.382 or 0.618 Fibonacci Ratios of cycle wave I. Cycle wave II may end close to the low of primary wave II within cycle wave I, which is at 1,810.10. It is also possible that cycle wave II could be fairly shallow and only barely meet the definition of a bear market.
The impulse is still viewed as nearing an end; a fifth wave is still seen as needing to complete higher. This wave count labels it primary wave 5. Primary wave 5 may still need another year to two or so to complete, depending upon how time consuming the corrections within it may be.
Primary wave 5 may be subdividing as an impulse, in the same way that cycle wave V is seen for the first weekly chart.
TECHNICAL ANALYSIS
WEEKLY CHART
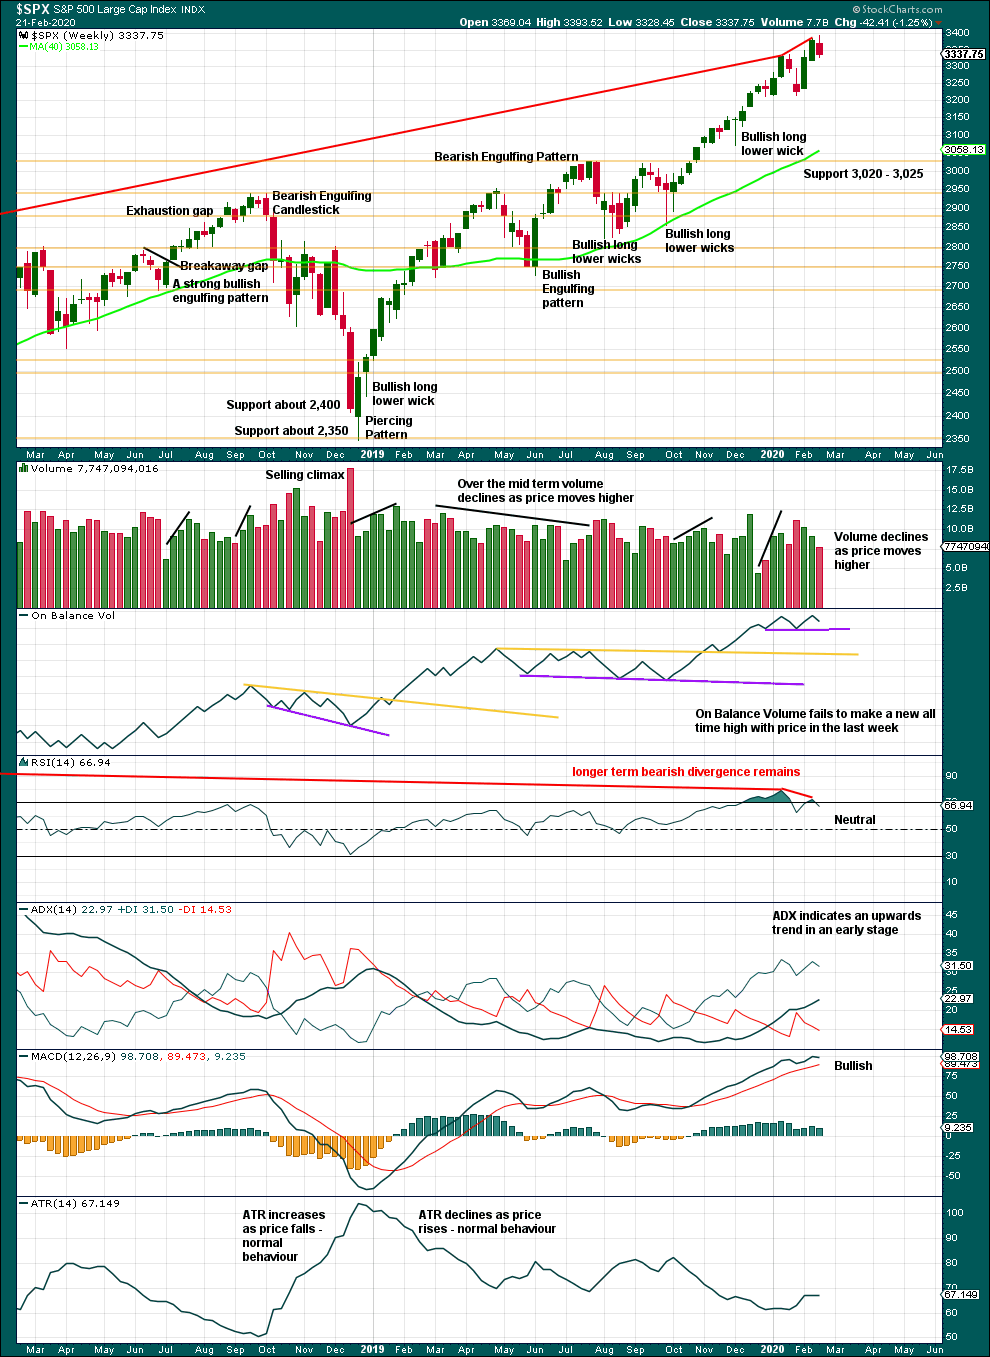
Click chart to enlarge. Chart courtesy of StockCharts.com.
It is very clear that the S&P is in an upwards trend and the bull market is continuing. Price does not move in straight lines; there will be pullbacks and consolidations along the way.
This chart is overall bullish. There are no signs of weakness in upwards movement.
This bull market beginning in March 2009 has been characterised now for many years by rising price on declining volume. Despite all technical textbooks stating this is unsustainable, it has now been sustained for over a decade. This is concerning for an eventual bearish move as it may mean that support below is thin and weak, but for now the bull market continues. A decline in volume in current market conditions shall not be read necessarily as bearish.
Further pullbacks or consolidations will unfold. Do not expect price to move in a straight line. Pullbacks to support in a bull market may be used as opportunities to join an established trend.
Continued bearish divergence for the short term between price and RSI suggests the risk of a pullback remains high.
Last week sees upwards movement, but this is not confirmed by On Balance Volume.
DAILY CHART
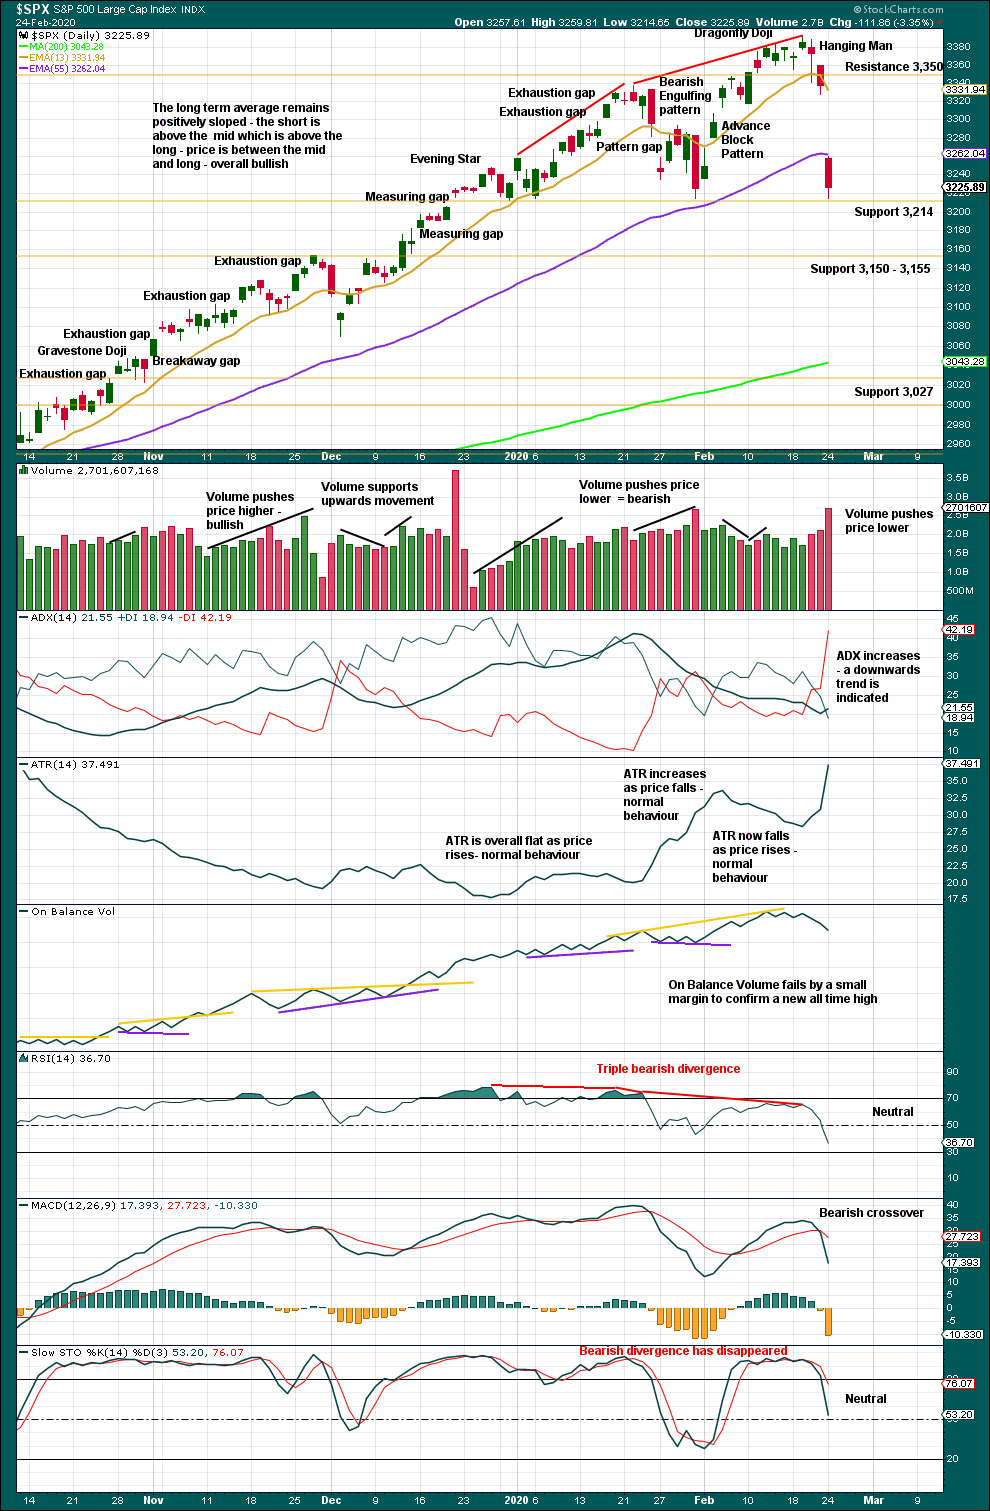
Click chart to enlarge. Chart courtesy of StockCharts.com.
The larger trend, particularly at the monthly time frame, remains up. Expect pullbacks and consolidations to be more short term in nature although they can last a few weeks.
Today support about 3,214 has held.
This session completes a 90% downwards day. Following a 90% downwards day, either a 90% upwards day or two back to back 80% upwards days within 3 sessions would be required to indicate a 180°reversal in sentiment and indicate a sustainable low may be in place.
BREADTH – AD LINE
WEEKLY CHART
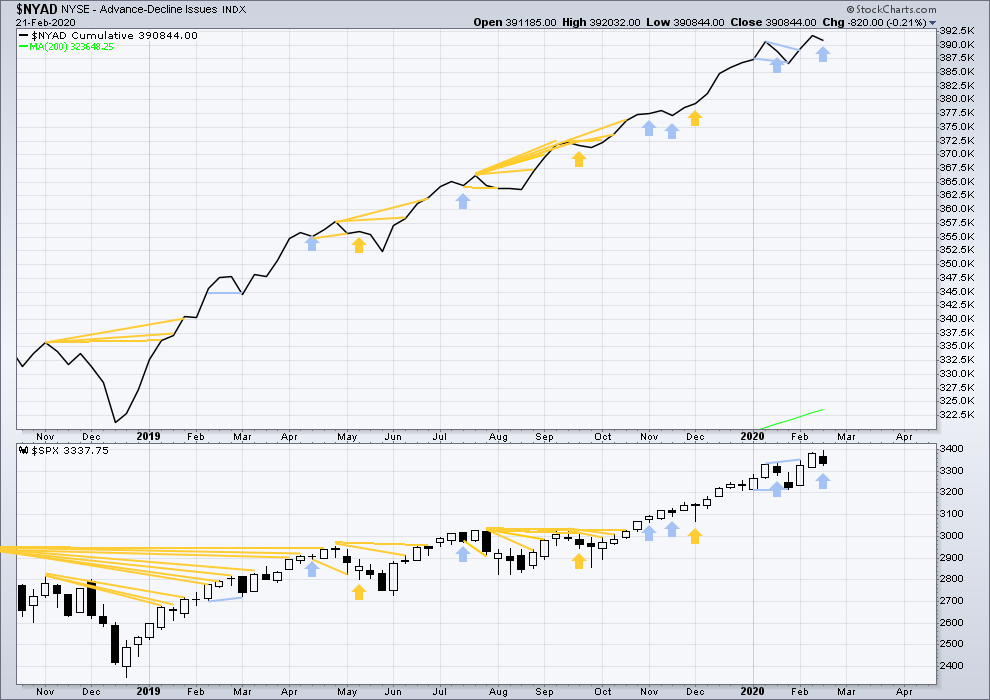
Click chart to enlarge. Chart courtesy of StockCharts.com. So that colour blind members are included, bearish signals
will be noted with blue and bullish signals with yellow.
Bear markets from the Great Depression and onwards have been preceded by an average minimum of 4 months divergence between price and the AD line with only two exceptions in 1946 and 1976. With the AD line making new all time highs last week, the end of this bull market and the start of a new bear market is very likely a minimum of 4 months away, which is mid June 2020.
In all bear markets in the last 90 years there is some positive correlation (0.6022) between the length of bearish divergence and the depth of the following bear market. No to little divergence is correlated with more shallow bear markets. Longer divergence is correlated with deeper bear markets.
If a bear market does develop here, it comes after no bearish divergence. It would therefore more likely be shallow.
Last week price has moved higher, but the AD line has moved lower. This single week instance of bearish divergence supports the main Elliott wave count.
Large caps all time high: 3,393.52 on 19th February 2020.
Mid caps all time high: 2,109.43 on 20th February 2020.
Small caps all time high: 1,100.58 on 27th August 2018.
DAILY CHART
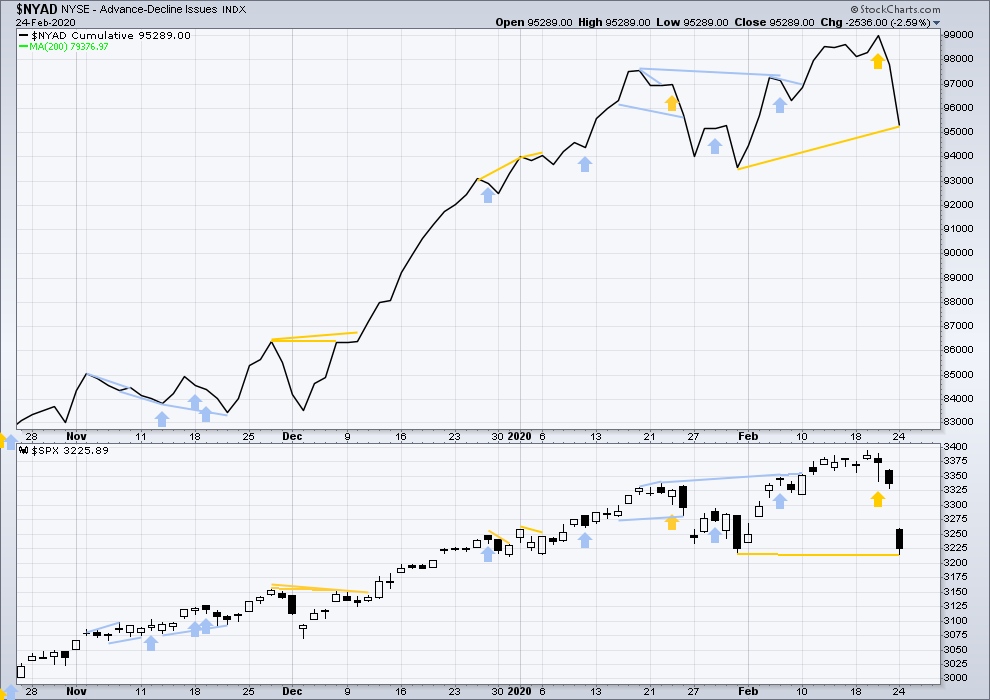
Click chart to enlarge. Chart courtesy of StockCharts.com. So that colour blind members are included, bearish signals
will be noted with blue and bullish signals with yellow.
Breadth should be read as a leading indicator.
Both price and the AD line moved lower today. Price has made a very slight new low below the prior low of the 31st of January, but the AD line has not. This divergence is bullish.
VOLATILITY – INVERTED VIX CHART
WEEKLY CHART
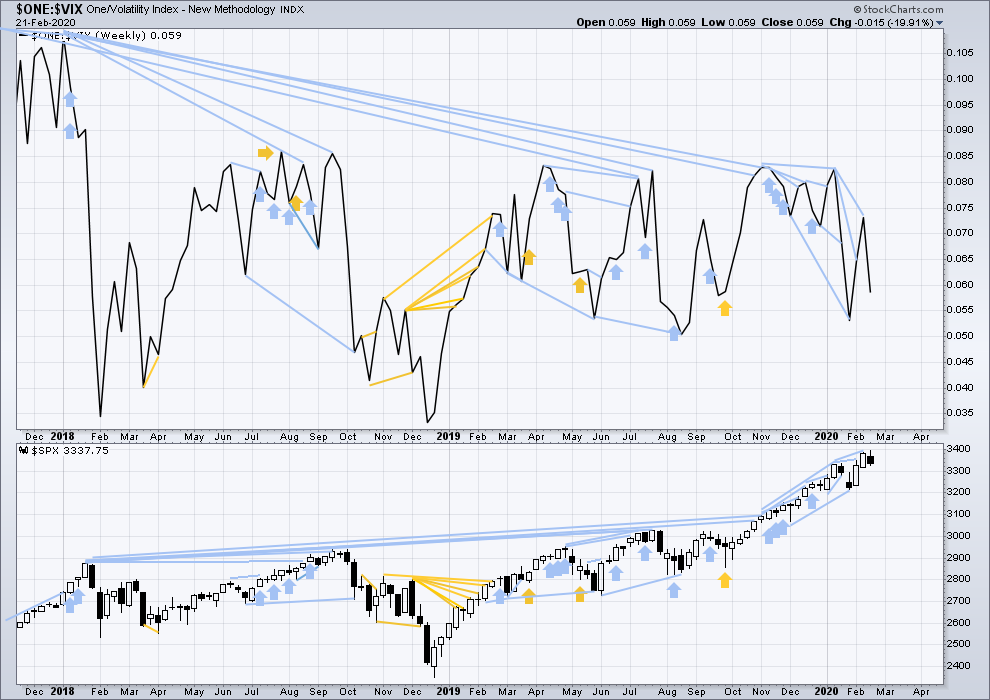
Click chart to enlarge. Chart courtesy of StockCharts.com. So that colour blind members are included, bearish signals
will be noted with blue and bullish signals with yellow.
The all time high for inverted VIX was on 30th October 2017. There is now over two years of bearish divergence between price and inverted VIX.
The rise in price is not coming with a normal corresponding decline in VIX; VIX remains elevated. This long-term divergence is bearish and may yet develop further as the bull market matures.
This divergence may be an early warning, a part of the process of a top developing that may take years. It is clearly not useful in timing a trend change from bull to a fully fledged bear market.
Last week both price and inverted VIX have moved lower. There is no new short-term divergence.
DAILY CHART
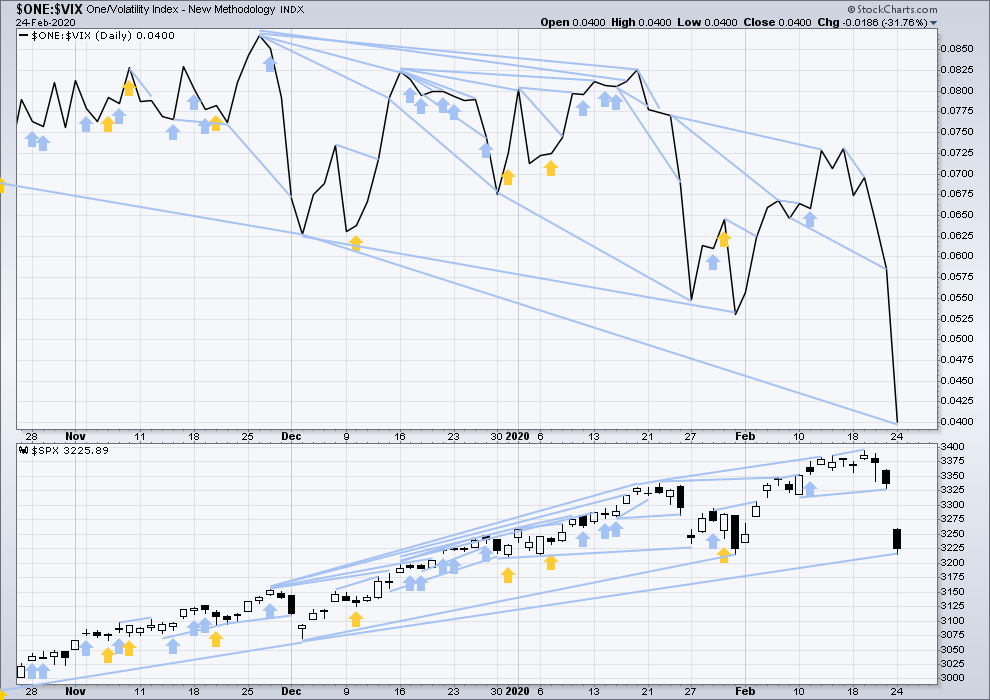
Click chart to enlarge. Chart courtesy of StockCharts.com. So that colour blind members are included, bearish signals
will be noted with blue and bullish signals with yellow.
Both price and inverted VIX moved lower today. Inverted VIX has made a new low below the prior swing low of 3rd of December 2019, but price has not. This divergence is bearish, but it disagrees with the AD line. More weight will be given to the AD line.
DOW THEORY
Dow Theory confirmed a bear market in December 2018. This does not necessarily mean a bear market at Grand Super Cycle degree though; Dow Theory makes no comment on Elliott wave counts. On the 25th of August 2015 Dow Theory also confirmed a bear market. The Elliott wave count sees that as part of cycle wave II. After Dow Theory confirmation of a bear market in August 2015, price went on to make new all time highs and the bull market continued.
DJIA: 23,344.52 – a close on the 19th of December at 23,284.97 confirms a bear market.
DJT: 9,806.79 – price has closed below this point on the 13th of December.
S&P500: 2,532.69 – a close on the 19th of December at 2,506.96 provides support to a bear market conclusion.
Nasdaq: 6,630.67 – a close on the 19th of December at 6,618.86 provides support to a bear market conclusion.
With all the indices having moved higher following a Dow Theory bear market confirmation, Dow Theory would confirm a bull market if the following highs are made:
DJIA: 26,951.81 – a close above this point has been made on the 3rd of July 2019.
DJT: 11,623.58 – to date DJT has failed to confirm an ongoing bull market.
S&P500: 2,940.91 – a close above this point was made on the 29th of April 2019.
Nasdaq: 8,133.30 – a close above this point was made on the 26th of April 2019.
Published @ 06:20 p.m. EST.
—
Careful risk management protects your trading account(s).
Follow my two Golden Rules:
1. Always trade with stops.
2. Risk only 1-5% of equity on any one trade.
—
New updates to this analysis are in bold.

Hey. I had my buy order as of end of day. I picked up some extra downside. Now lets hope I didn’t catch a falling knife.
So why is GLD and SLV are down today?
Because S&P500 and Gold and Silver aren’t correlated.
I have reopened my long position. I have allocated 65% of the final and full long position. I will attempt to pick up the remainder after the upcoming Minor B & C waves. If Intermediate 4 develops into a triangle, today’s low may be the low in price for the Intermediate 4 correction. I’ve got ‘skin’ in the game again.
Rodney is back 🙂
What are you buying, Rodney?
SPX 500 through an ETF. Unleveraged position.
UPRO?
No, upro is leveraged. SPY most likely.
Buying March 4 VIX 30 strike puts for limit of 6.50…..
Just took my first long here, sold a qqq put spread for friday, 216/214. QQQ has tagged a 38.2%. Maybe I’m early…
and some UWM and UPRO…not options so if this turns and goes deeper, I can wait it out.
“You choose the place and I’ll choose the time
And I’ll climb….that hill in my own way…
Just wait awhile for the right day…
And as I rise above the tree line in the clouds
I’ll look down, hear the sounds of the things you said today!!”
Pink Floyd at their best.
Lovin’ this action!
and sold SPX Mar 20 put spreads 3020/3005.
will very shortly sell RUT Mar 20 1500/1490 put spreads as well.
took UWM profit as it turned on the 1 minute, and stopped out of UPRO at break even. took a scratch loss on QQQ spread…discretion better part of valor!
Will reload soon…
Don’t panic everybody, although this is deeper than expected it’s still intermediate (4).
I’m not going to move the degree of labelling up one degree either, because then primary 3 wouldn’t look right.
Also remember at the last ATH there was zero divergence between price and the AD line, indicating a bear market is a bare minimum of 4 months away.
This is a normal and to be expected consolidation within an ongoing bull market.
If intermediate (4) unfolds now as a triangle it would remain somewhat close to the channel. But the channel will now have to be redrawn using Elliott’s second technique once intermediate (4) is complete. Fourth waves just aren’t always contained within a channel drawn using the first technique.
Approaching VIX 30 target. We should hit by the close….
thumbs up
This appears more like bottom falling out now….
Price has reach perfect symmetry with the depth of the intermediate 2, and is scribbling on the 38.2% retrace level. Again, decent support from the late Nov to early Dec pivot highs around 3154. No guarantee it turns here…but if it does, I think it should hold for at least several days of bounce, and potentially this would be it for the I4 low (but not necessarily the end of the I4, going be LOTS of backing filling in some kind of structure after this high momentum move).
lookn to get an ES contract at 3155…
What series Peter?
I’m sure you are going to wait for some pivot low structure to form up first, right? Might be a good idea…
EPIC DAY!! Way over sold now…but may not be done yet!
Agree, buy the dip buyer this morning got creamed.
back to Dec 5th, gap filled
My zone didn’t hold.
The 50% is coming up at 3108 (and of course the roundie at 3100), but I find SPX doesn’t often respect 50% levels. Then there’s the 61.8% at 3038. Now THAT would be an awesome level to get long at…
I agree. That is basically the level I noted yesterday (3150) as an awesome entry especially since 3000 could be a very close by stop.
$NYMO McClellan Oscillator is off the chart low.
VIX is above its daily BB.
SPX is below its daily BB
These are very over sold conditions. They can get more extreme but do not need to do so for a sustainable bottom. I think I will be going 1/3 or 1/2 long today. I would like to see Lara’s mid day update first though.
We had too many opened gaps below – now it’s like domino effect – all those gaps on SPX are getting closed. They all do sooner or later.
That’s for sure. 3030 is the best level we can hope for.
Now that we breached 100 D MA, 3050 doesn’t look far fetched now. It’s right at the level of very important 200 D MA (currently at 3045). So maybe after all, this would be the target.
We may be tracing out a larger triangle. If we are, look out below…!
Looks like 3150-3155, as Kevin mentioned, is a very good park stop for this consolidation. I wonder if they waited for this consolidation to happen right in the last week of the February so it looks complete on a monthly chart.
It is also interesting that for the history of SPX (at least from what I see on thew chart back from 1980s) there was not a single 2 month in a row price action with shooting start at the top one after another. Might be just a reaction due to overheated market lately, but still – if we end up with another shooting star for the month in 3 days, it would be an unprecedented sequence.
If Lara’s target of 3477 is correct, assuming the trend lines are intact (which they are so far), then this target can come into play by mid June-July when it hits the top of the trendline (based on monthly chart) (if the uptrend resumes next month).
clear 5 wave impulse down of what looks like a much larger correction.
Yep!
This seems more like Cycle 4 than Inter 4
Maybe you mean primary 4?
The Q4 2018 correction was cycle degree, and this isn’t close to that in depth. At this point. A cycle degree correction would be 15-20% off the highs before it’s over, most likely.
So far this looks very reasonable as an intermediate 4, in my view. If it gets to the 61.8% level at 3040, then there’s reason to consider that it could be primary.
If it’s already primary 4, then we might be closer to the start of bearish market than we think. Lara’s target of 3477 looks very reasonable now.
We should head up to at least test the open gaps…
MMs have been having a bit of fun with the BTF dippers. Absolutely hilarious! 🙂
But seriously, the running triangle had a very high probability of a downward break….
Bonds are rather interesting at the monthly time frame. This is TLT. The 3 black lines are symmetric projections of the 3 largest moves since 2008. This epic bull swing is very much “in the zone” where such swing have ended over the last 12 years, and major corrections start. So I’ll be watching closely over the next few weeks/months for indications bonds have topped here.
VIX bull flag has target of about 30….
A tradable rebound is close…
3200… ish
3154 – 3175 is the very high potential turn zone on my chart. The 38.2% retrace level at 3175 and the highs from late Nov to early Dec at 3154.
From the top of 3pm yesterday, I see 1-2-3 finished (3 has a nice 5-wave look), SPX just starts a wave 4… New low on the day will mark 5 & end of this down move. Low 3180s maybe
Wham bam…put on a SPY bull put spread for Friday, 317.5/314. We’ll see if this holds, if the current low gets undercut, I bail.
As falls Witchita…so falls Witchita Falls!
Got out of that and closed my overhead SPY butterfly to cover it.
Let’r fall.
Here’s the IWM volume profile (IWM just tracks RUT…but have volume data). Note how the low yesterday was in the “volume value”, and price turned back up. Today, price is on the far side of the value…and if it keeps going down, “gravity” will tend to pull it down to the volume node, way below around 155 (from the current 160 or so). Not a good time yet to get long RUT…unless it turns quickly and starts running up.
RUT (and IWM) is now at fresh lows below Monday’s. The structure of the overall correction looks pretty clear to me as a 5-3-5 zigzag. Indicating that there should be some kind of decent long play when this current 5 down completes (even if the correction continues, the corrective wave up should be significant).
BOOM!!!! Across the valley and heading down deep into the next lower volume node!!! Loving my ‘fly down there for expiry this Friday. IWM at 157 is my max profit level, but I’m good from 155 to 159. Just under 158 now.
News out of Italy…’A hospital in Italy appears responsible for the spread of coronavirus infection as the hospital did not follow proper protocols.’ Now travel is going to get tough as lock downs are enforced…this will impact trade and earnings in big way.
I do not think the HOURLY CHART is possibly valid. The bounce from yesterday’s low (between 1pm and 3pm) is clearly in 3 waves, and the drop into the close overlapped the 1st wave. This was a corrective rally.
Over the same period and overnight, the ES has a corrective look, possibly a wave 4 triangle.
I’m a believer in the ALTERNATE HOURLY CHART… Expecting morning rally into the 3250s if this 4 is a triangle on the ES, or into the 3270s if it’s a flat. Then new lows for a buying opportunity.
(Unrelated) at one point, I will expect a low to finally form on the EUR/USD and a strong move up to ~1.30
There needs to be a feeling of bottom falling out before any bounce can be expected. I suspect buy the dip mind set needs to be shaken real hard before we have a bottom in place. Waiting and watching for now..
Starting to feel that way a little now. But I wonder if the 61.8% level down at 3038 might not be in play in a few more days…
Possible running triangle…
Now complete…
Any thoughts on how we will open. Black or red
Yes!
You beat me !
No!