Downwards movement was expected for Friday’s session, which is exactly what has happened.
The Elliott wave count uses structure and alternation to indicate where price may find support and how long a correction may last.
Summary: The trend is up. Consolidations and pullbacks may last a few weeks but should be viewed in the bigger context of an ongoing bull market. At support they may provide opportunities to join the trend.
Intermediate wave (4) may have arrived. A target for support would be about 3,259. If this expectation is wrong, it may be too low; intermediate wave (4) may be very shallow. Intermediate wave (4) may last about two to four weeks.
Two more large pullbacks or consolidations (fourth waves) during this year and possibly into next year are expected: for intermediate (4) (which may have just arrived) and then primary 4.
If price makes a new high by any amount at any time frame above 3,477.39 (even a fraction of a point on a tick chart), then this analysis switches to one of the very bullish alternate monthly charts. The next cycle degree target would then be either 4,092 or 4,213.
The biggest picture, Grand Super Cycle analysis, is here.
Last monthly charts analysis is here with video here.
ELLIOTT WAVE COUNTS
FIRST WAVE COUNT
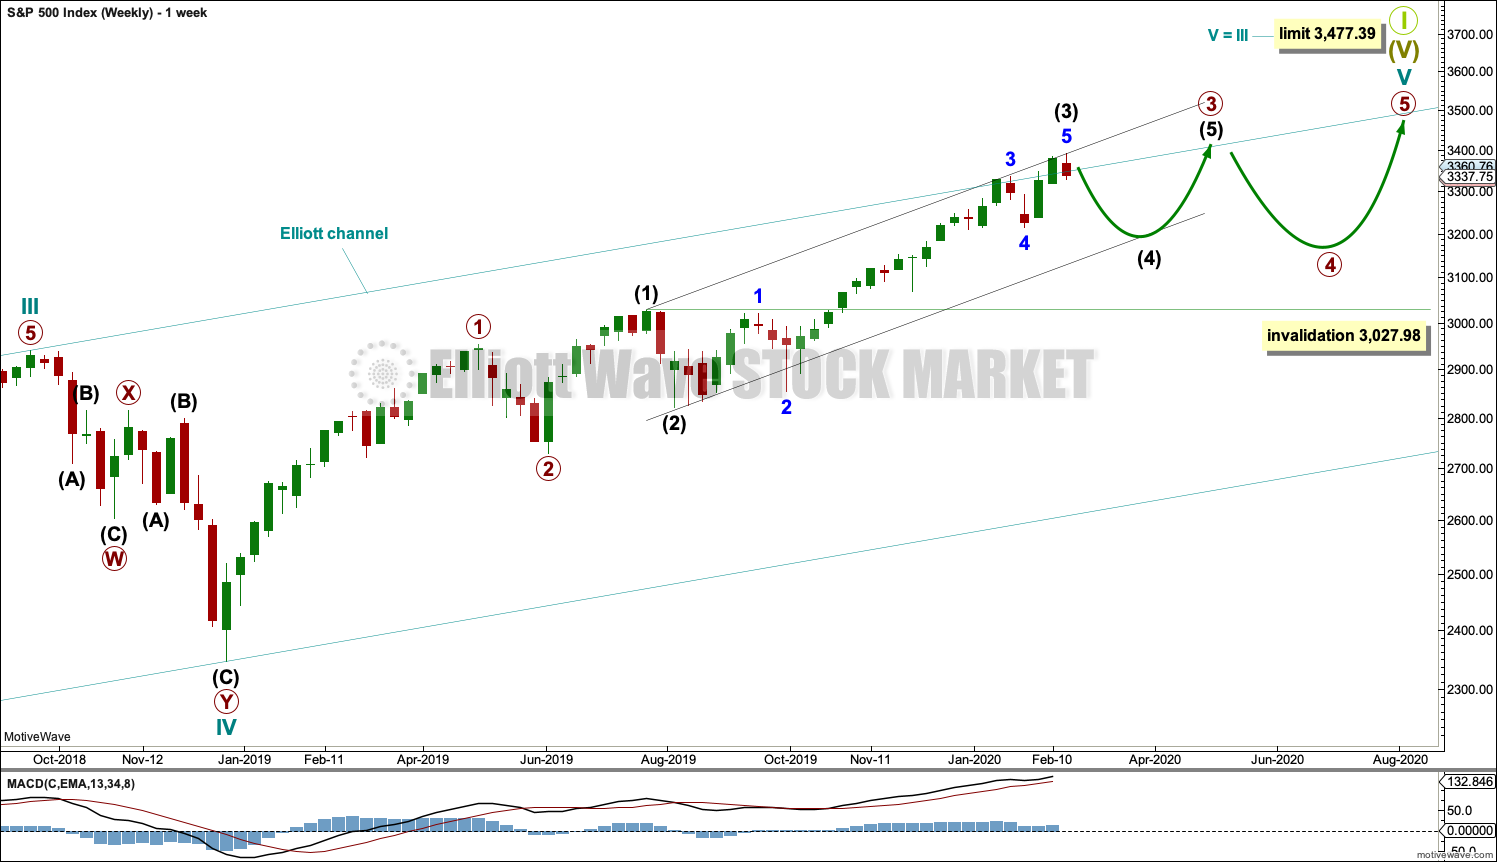
WEEKLY CHART
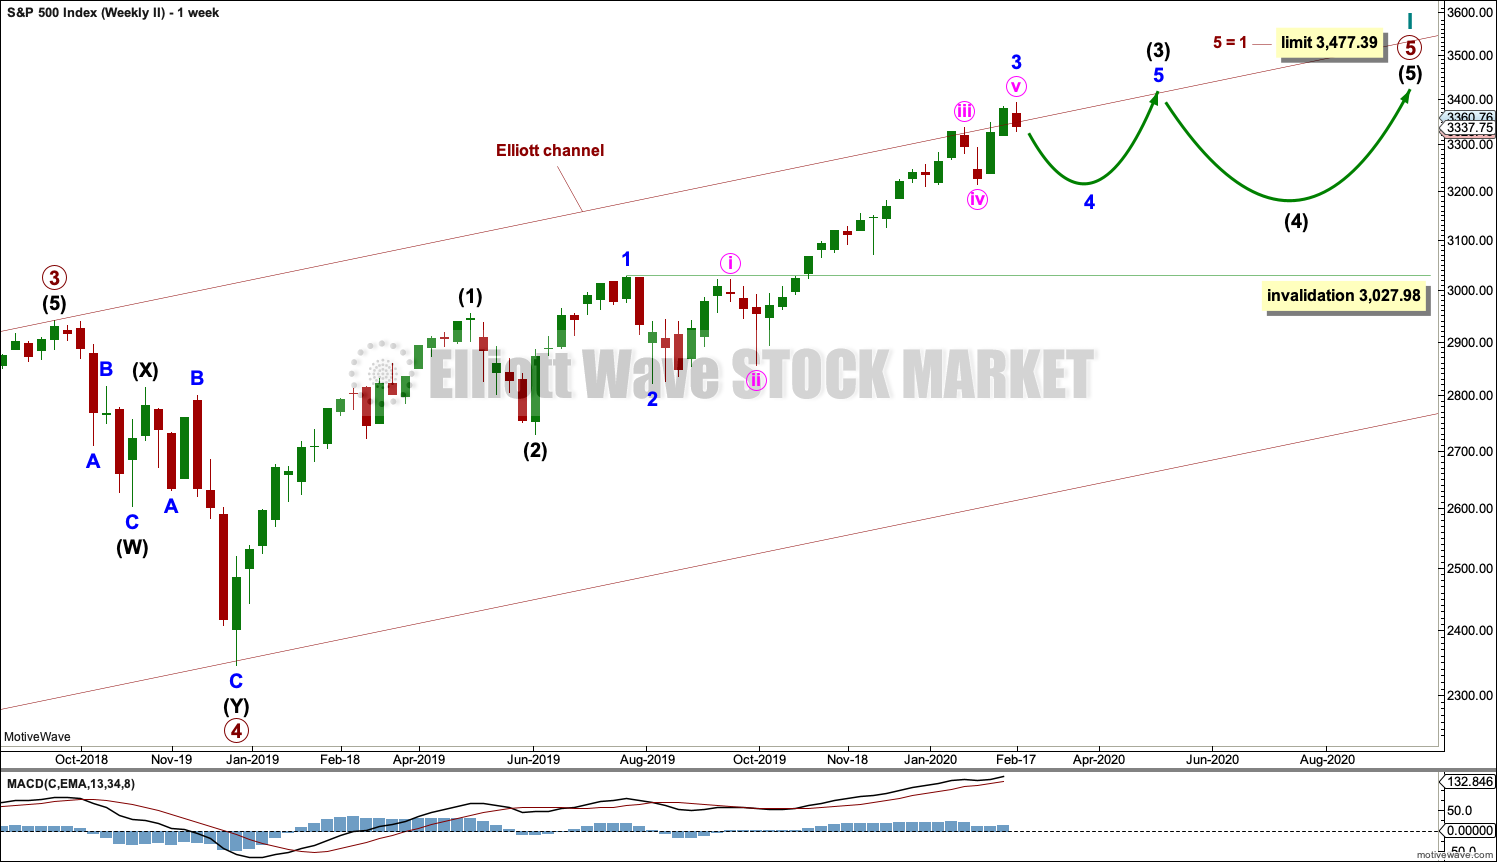
Cycle wave V may subdivide either as an impulse or an ending diagonal. Impulses are much more common, and it is clear at this stage that cycle wave V is an impulse and not a diagonal.
At this stage, cycle wave V may end within this year or possibly into next year.
A channel is drawn about the impulse of Super Cycle wave (V) using Elliott’s first technique. Draw this channel first from the high of 2,079.46 on the 5th of December 2014 to the high of 2,940.91 on the 21st of September 2018, then place a parallel copy on the low at 1,810.10 on the 11th of February 2016. Cycle wave IV found support about the lower edge.
Within Super Cycle wave (V), cycle wave III may not be the shortest actionary wave. Because cycle wave III is shorter than cycle wave I, this limits cycle wave V to no longer than equality in length with cycle wave III at 3,477.39. A new high by any amount at any time frame above this point would invalidate this main wave count in favour of one of the two alternate wave counts in the monthly chart analysis which are much more bullish.
The daily chart below will focus on movement from the end of intermediate wave (1).
Within cycle wave V, primary waves 1 and 2 may be complete. Within primary wave 3, intermediate waves (1) and (2) may be complete. Intermediate wave (3) may now also be complete. Intermediate wave (4) may not move into intermediate wave (1) price territory below 3,027.98.
Within cycle wave V, the corrections of primary wave 2, intermediate wave (2) and minor wave 2 all show up clearly on the weekly chart. For cycle wave V to have the right look, the corresponding corrections of minor wave 4, intermediate wave (4) and primary wave 4 should also show up on the weekly chart. Minor wave 4 now shows up on the weekly chart, and so now two more large multi-week corrections are needed as cycle wave V continues higher, and for this wave count the whole structure must complete at or before 3,477.39.
DAILY CHART
Minor waves 2 and 4 for this wave count both subdivide as zigzags; there is no alternation in structure. Minor wave 2 is deep at 0.83 the length of minor wave 1, and minor wave 4 is shallow at 0.26 the length of minor wave 3; there is alternation in depth. Minor wave 2 lasted 10 sessions and minor wave 4 lasted 7 sessions; the proportion is acceptable and gives the wave count the right look.
There is no adequate Fibonacci ratio between minor waves 1 and 3. If minor wave 5 is now complete, then it would be 5.21 points short of 0.382 the length of minor wave 3.
Intermediate wave (2) subdivides as a zigzag that lasted 6 sessions and was deep at 0.69 of intermediate wave (1). Intermediate wave (4) may subdivide as any corrective structure, most likely one of either a flat, combination or triangle. It may also unfold as a zigzag.
Intermediate wave (4) should show up on the weekly chart, so it should last at least one week and possibly as long as three or four weeks if it is a more time consuming structure such as a triangle or combination.
Intermediate wave (4) may end within the price territory of one lesser degree; minor wave 4 has its price territory from 3,337.77 to 3,214.68.
Use Elliott’s first technique to draw a channel about primary wave 3. Draw the first trend line from the ends of intermediate wave (1) to intermediate wave (3) then place a parallel copy on the end of intermediate wave (2). Intermediate wave (4) may find support about the lower edge of this channel.
HOURLY CHART
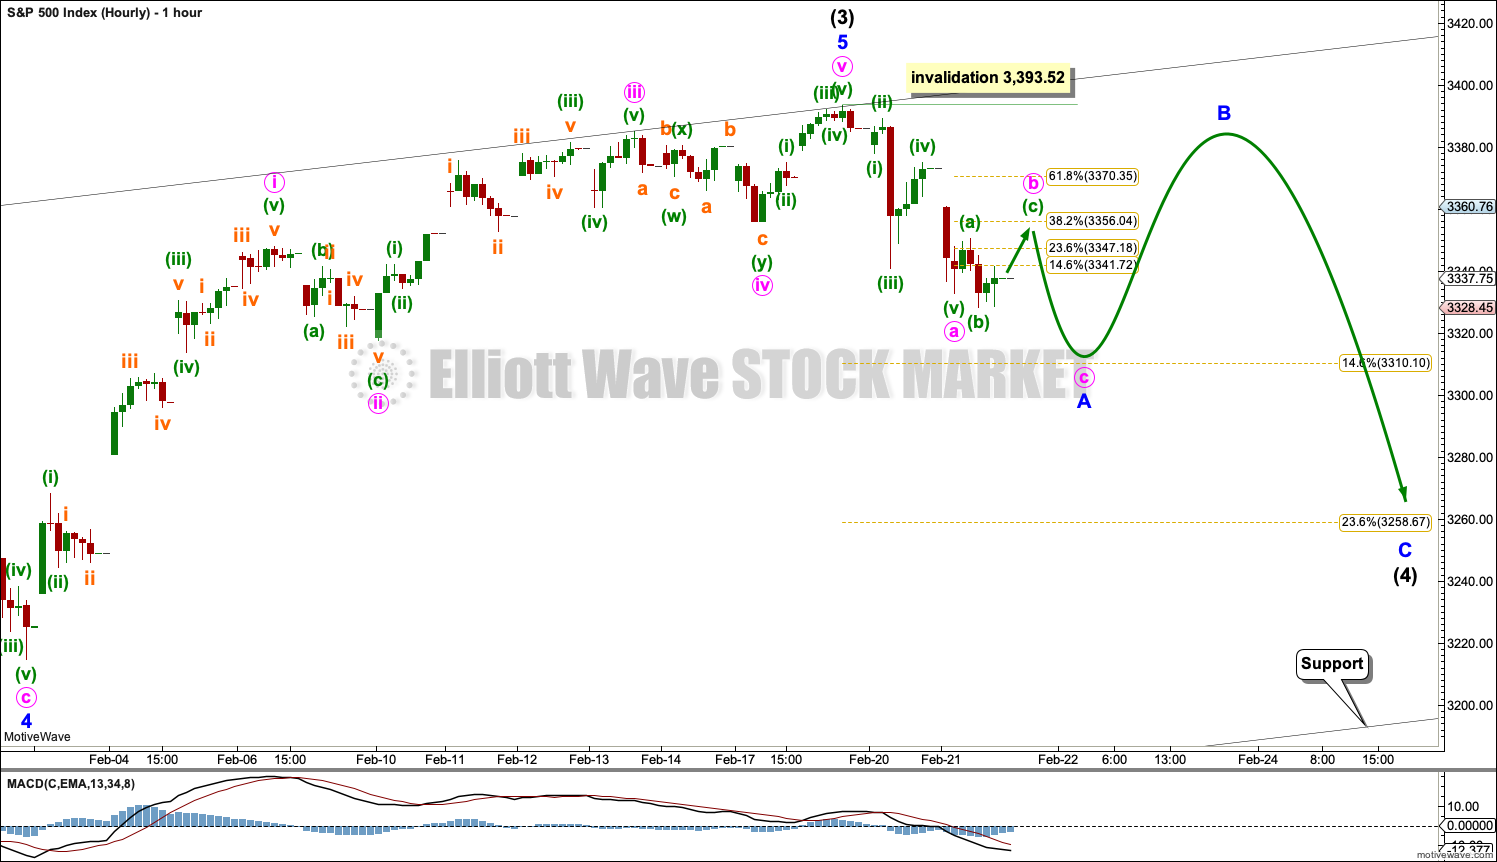
If intermediate wave (4) has arrived, then it should begin with a five down on the hourly chart. That may be incomplete and is labelled minute wave a.
A smaller three up bounce should unfold. This may be labelled minute wave b. Minute wave b may not move beyond the start of minute wave a above 3,393.52.
At this stage, it is impossible to tell which one of several corrective structures intermediate wave (4) may unfold as. This analysis will change in how intermediate wave (4) is labelled as it continues next week and possibly onwards. Focus should not be now on what structure intermediate wave (4) may be but on identifying when it may possibly be complete and the upwards trend may resume.
ALTERNATE DAILY CHART
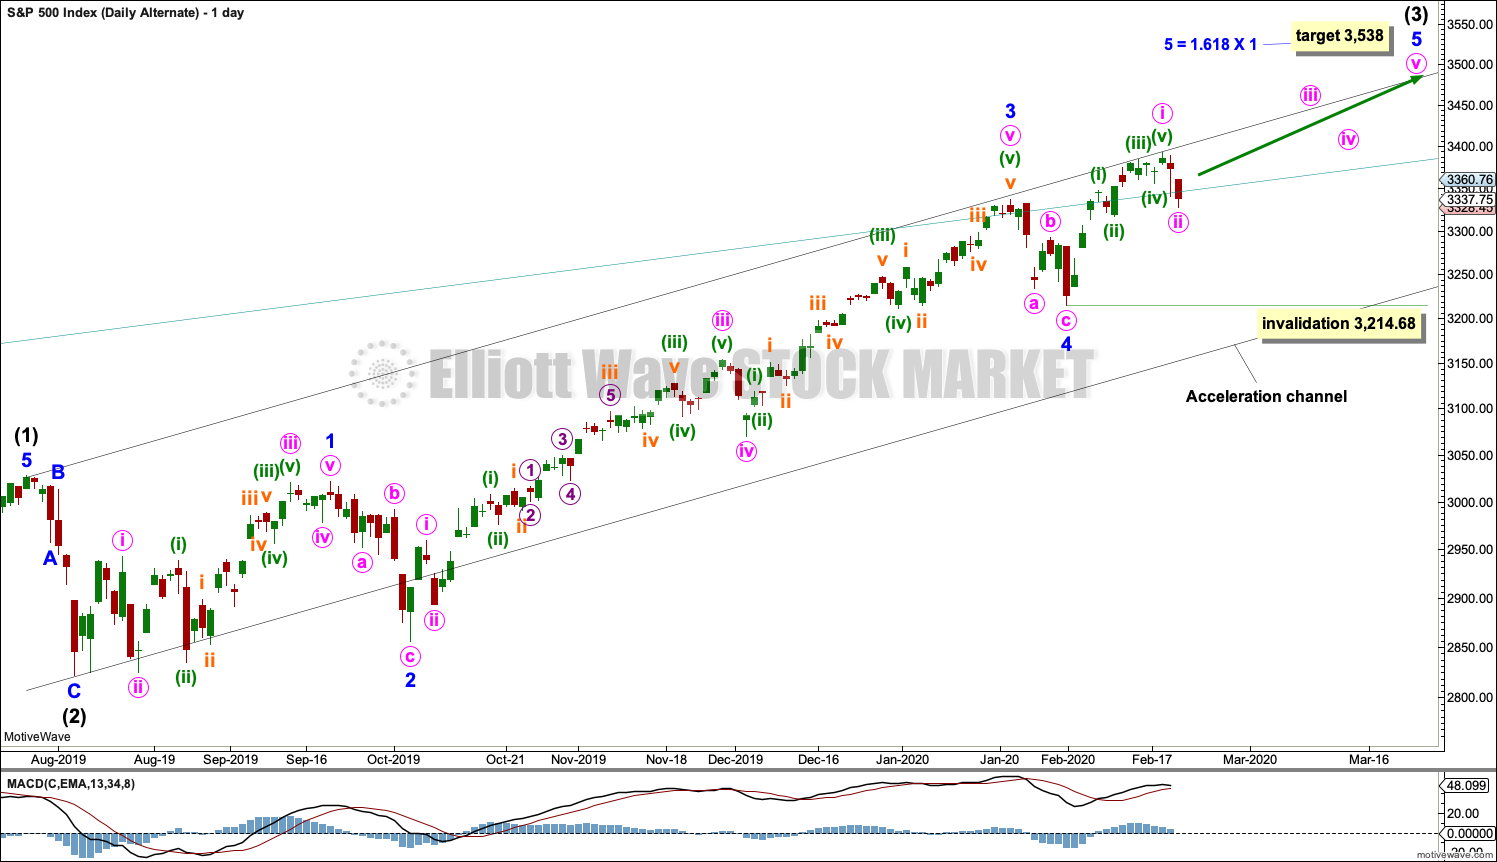
Alternatively, it is possible that intermediate wave (3) may still be incomplete.
This wave count moves the degree of labelling within minor wave 5 down one degree. Minor wave 5 may extend and continue higher. Within minor wave 5, minute wave i may be complete at the last high and minute wave ii may not move beyond the start of minute wave i below 3,214.68.
The target calculated for this alternate wave count only works with one of the more bullish monthly charts. The structure of cycle wave V would be the same.
SECOND WAVE COUNT
WEEKLY CHART
This second wave count sees all subdivisions from the end of the March 2009 low in almost the same way, with the sole difference being the degree of labelling.
If the degree of labelling for the entirety of this bull market is all moved down one degree, then only a first wave at cycle degree may be nearing an end.
When cycle wave I is complete, then cycle wave II should meet the technical definition of a bear market as it should retrace more than 20% of cycle wave I, but it may end about either the 0.382 or 0.618 Fibonacci Ratios of cycle wave I. Cycle wave II may end close to the low of primary wave II within cycle wave I, which is at 1,810.10. It is also possible that cycle wave II could be fairly shallow and only barely meet the definition of a bear market.
The impulse is still viewed as nearing an end; a fifth wave is still seen as needing to complete higher. This wave count labels it primary wave 5. Primary wave 5 may still need another year to two or so to complete, depending upon how time consuming the corrections within it may be.
Primary wave 5 may be subdividing as an impulse, in the same way that cycle wave V is seen for the first weekly chart.
TECHNICAL ANALYSIS
WEEKLY CHART
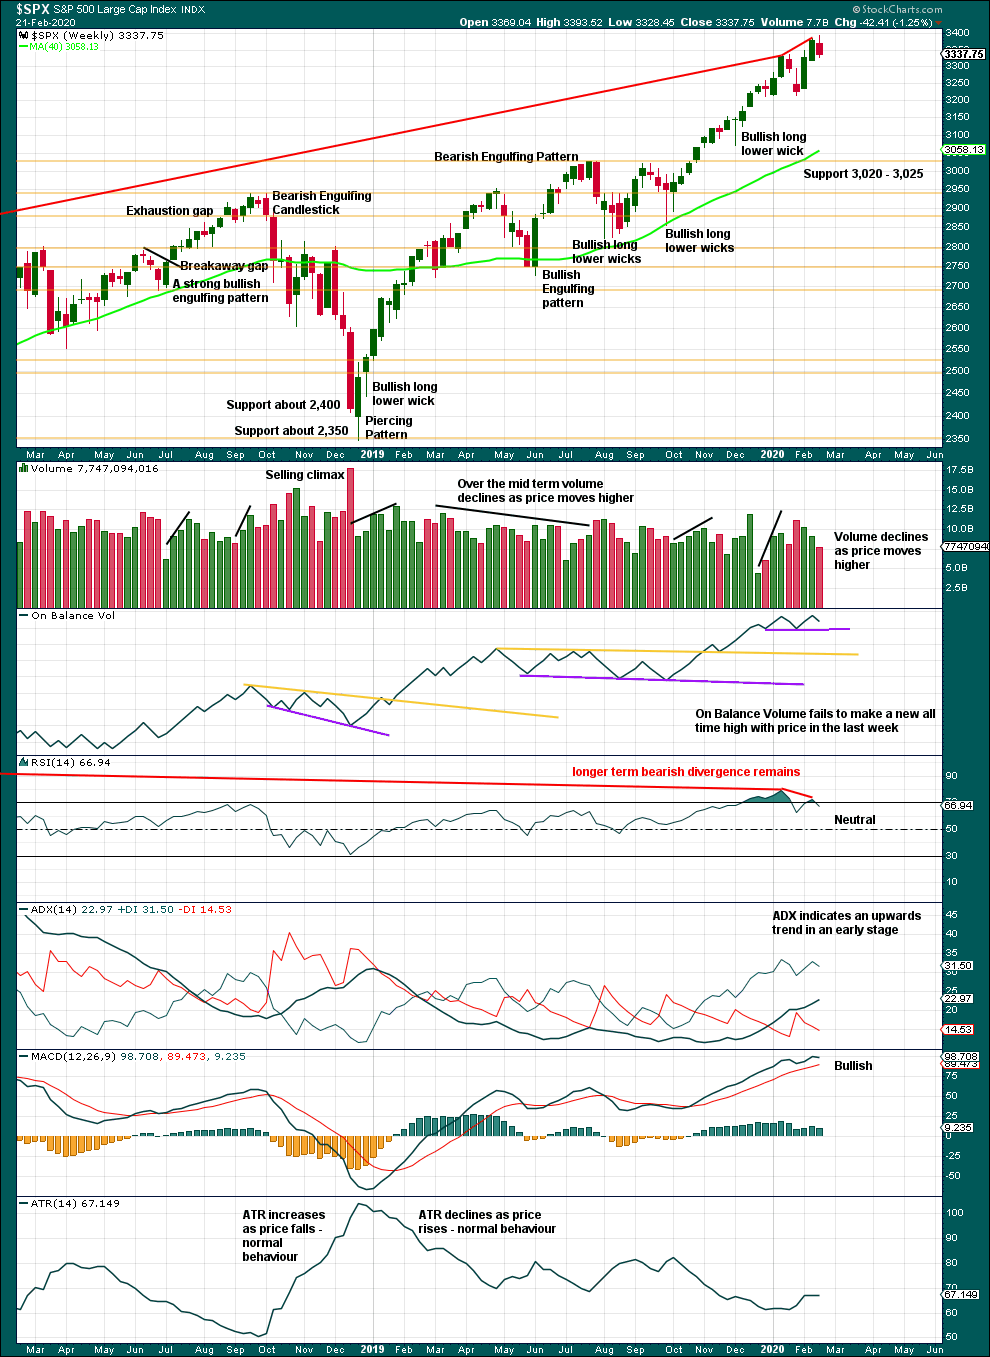
Click chart to enlarge. Chart courtesy of StockCharts.com.
It is very clear that the S&P is in an upwards trend and the bull market is continuing. Price does not move in straight lines; there will be pullbacks and consolidations along the way.
This chart is overall bullish. There are no signs of weakness in upwards movement.
This bull market beginning in March 2009 has been characterised now for many years by rising price on declining volume. Despite all technical textbooks stating this is unsustainable, it has now been sustained for over a decade. This is concerning for an eventual bearish move as it may mean that support below is thin and weak, but for now the bull market continues. A decline in volume in current market conditions shall not be read necessarily as bearish.
Further pullbacks or consolidations will unfold. Do not expect price to move in a straight line. Pullbacks to support in a bull market may be used as opportunities to join an established trend.
Continued bearish divergence for the short term between price and RSI suggests the risk of a pullback remains high.
This week sees upwards movement, but this is not confirmed by On Balance Volume.
DAILY CHART
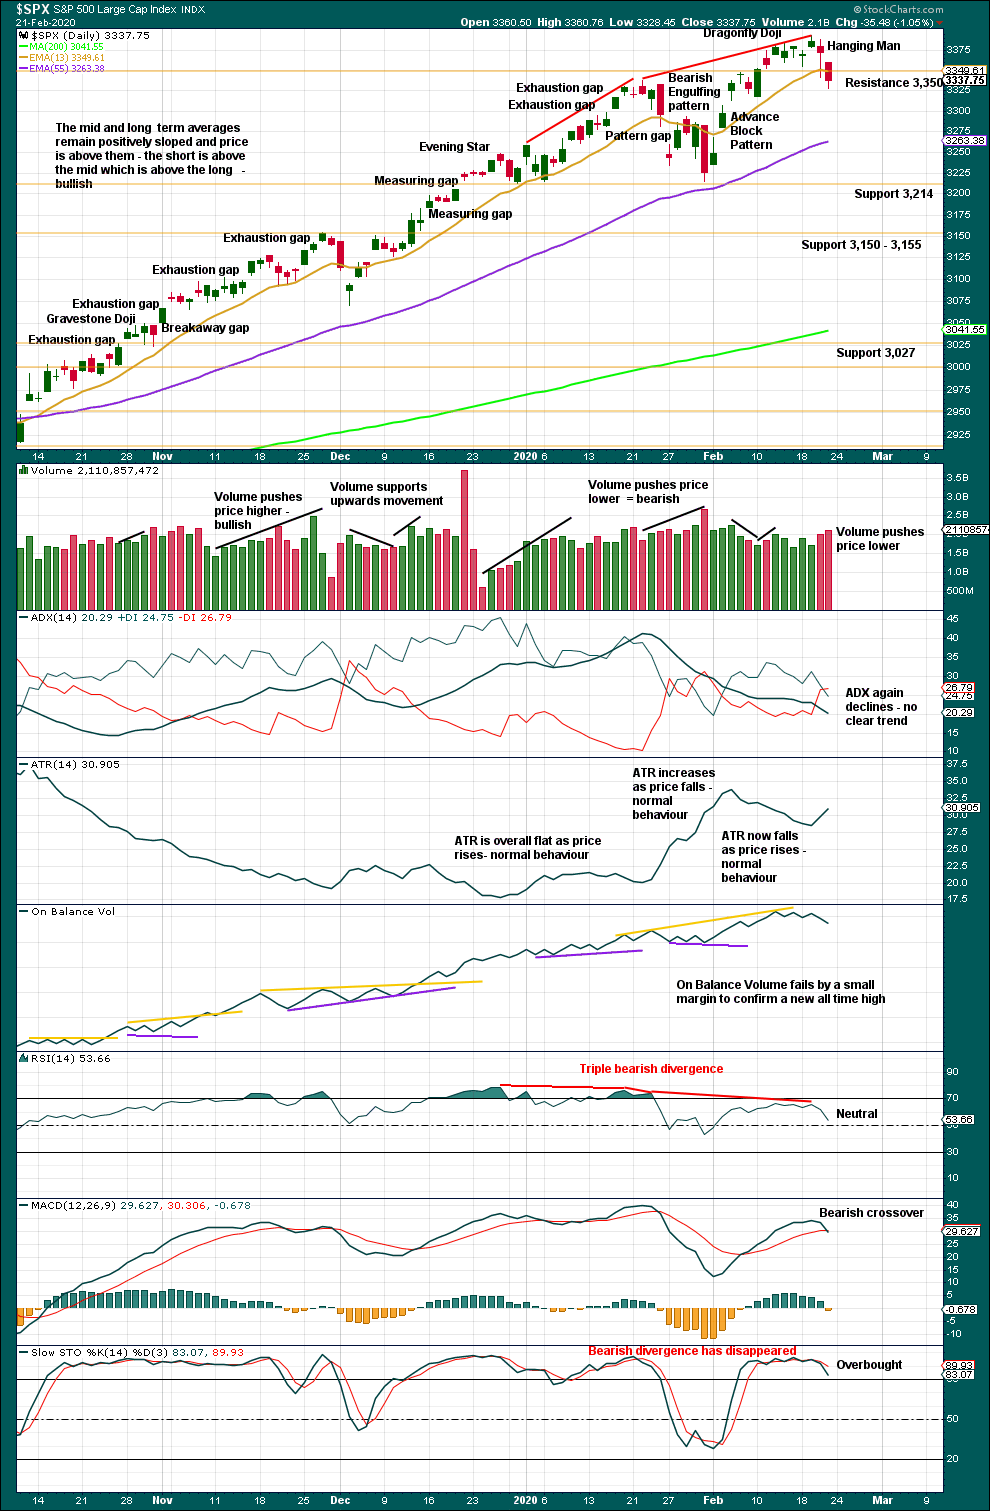
Click chart to enlarge. Chart courtesy of StockCharts.com.
The larger trend, particularly at the monthly time frame, remains up. Expect pullbacks and consolidations to be more short term in nature although they can last a few weeks.
Look for next support about 3,214.
There is now a small cluster of candlestick reversal patterns in two Dragonfly doji and now a Hanging Man. Bearish divergence between price and RSI remains and supports the main Elliott wave count.
BREADTH – AD LINE
WEEKLY CHART
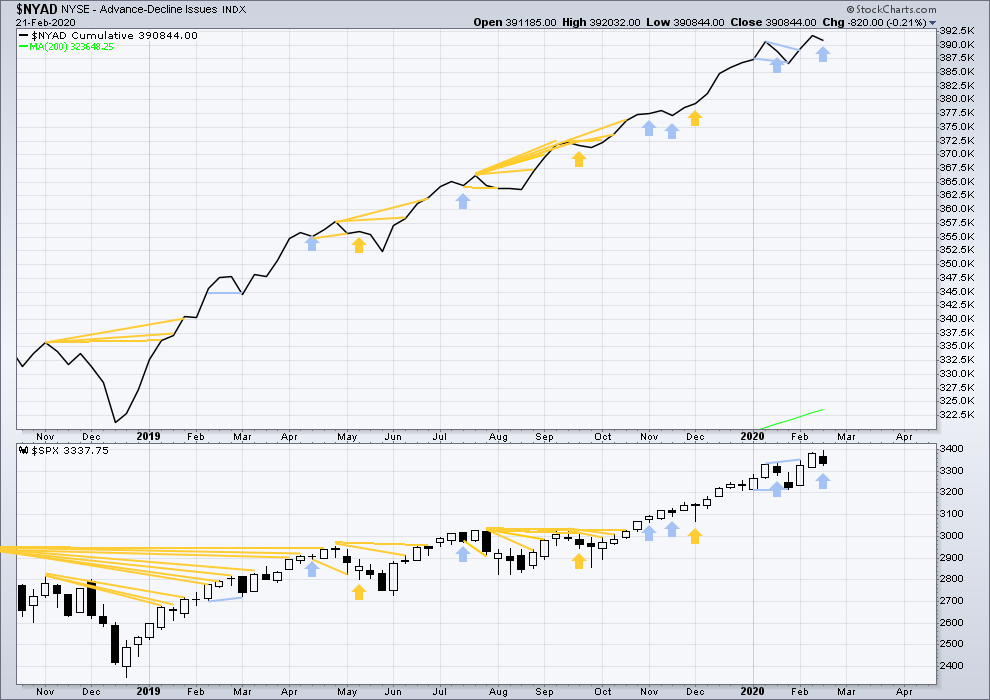
Click chart to enlarge. Chart courtesy of StockCharts.com. So that colour blind members are included, bearish signals
will be noted with blue and bullish signals with yellow.
Bear markets from the Great Depression and onwards have been preceded by an average minimum of 4 months divergence between price and the AD line with only two exceptions in 1946 and 1976. With the AD line making new all time highs last week, the end of this bull market and the start of a new bear market is very likely a minimum of 4 months away, which is mid June 2020.
In all bear markets in the last 90 years there is some positive correlation (0.6022) between the length of bearish divergence and the depth of the following bear market. No to little divergence is correlated with more shallow bear markets. Longer divergence is correlated with deeper bear markets.
If a bear market does develop here, it comes after no bearish divergence. It would therefore more likely be shallow.
This week price has moved higher, but the AD line has moved lower. This single week instance of bearish divergence supports the main Elliott wave count.
Large caps all time high: 3,393.52 on 19th February 2020.
Mid caps all time high: 2,109.43 on 20th February 2020.
Small caps all time high: 1,100.58 on 27th August 2018.
DAILY CHART
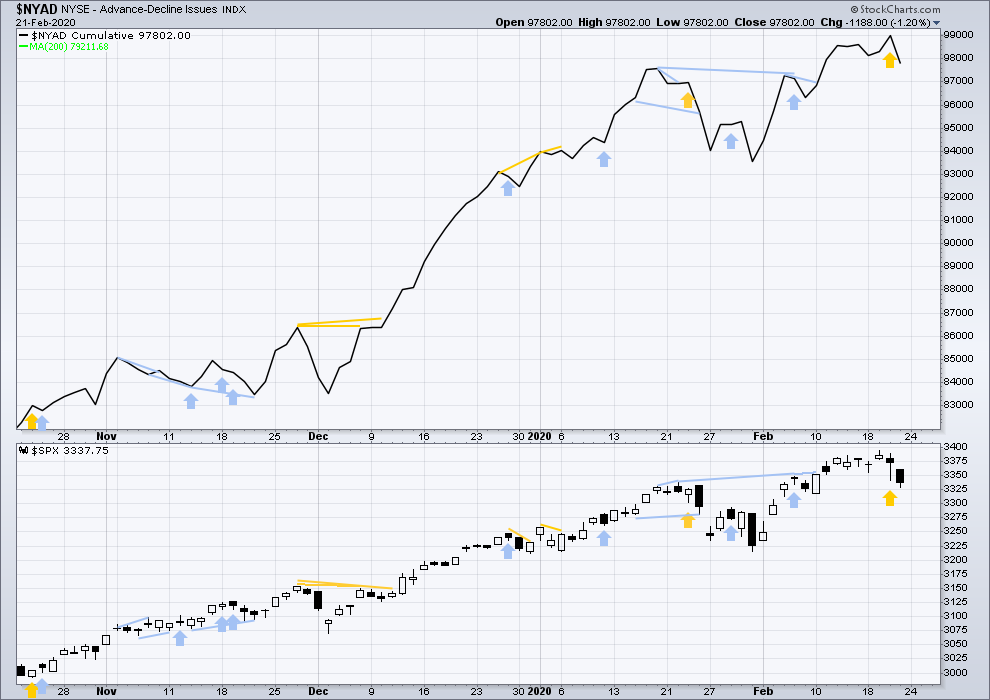
Click chart to enlarge. Chart courtesy of StockCharts.com. So that colour blind members are included, bearish signals
will be noted with blue and bullish signals with yellow.
Breadth should be read as a leading indicator.
Bullish divergence noted in Thursday’s analysis was not followed by any downwards movement. It is considered to have failed.
Both price and the AD line moved lower on Friday. There is no new short-term divergence.
VOLATILITY – INVERTED VIX CHART
WEEKLY CHART
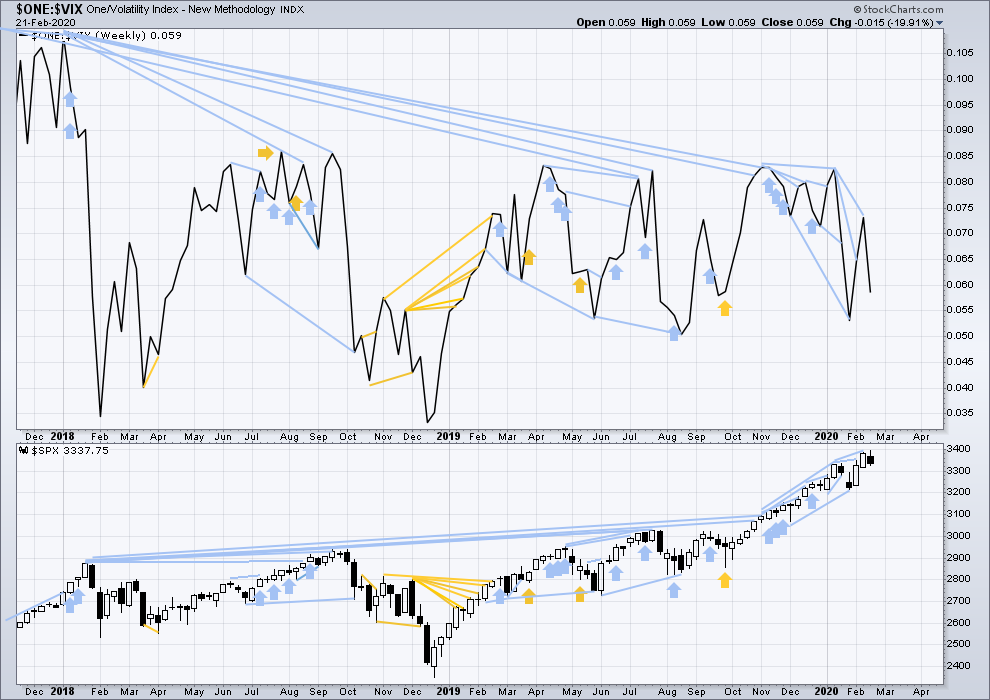
Click chart to enlarge. Chart courtesy of StockCharts.com. So that colour blind members are included, bearish signals
will be noted with blue and bullish signals with yellow.
The all time high for inverted VIX was on 30th October 2017. There is now over two years of bearish divergence between price and inverted VIX.
The rise in price is not coming with a normal corresponding decline in VIX; VIX remains elevated. This long-term divergence is bearish and may yet develop further as the bull market matures.
This divergence may be an early warning, a part of the process of a top developing that may take years. It is clearly not useful in timing a trend change from bull to a fully fledged bear market.
This week both price and inverted VIX have moved lower. There is no new short-term divergence.
DAILY CHART
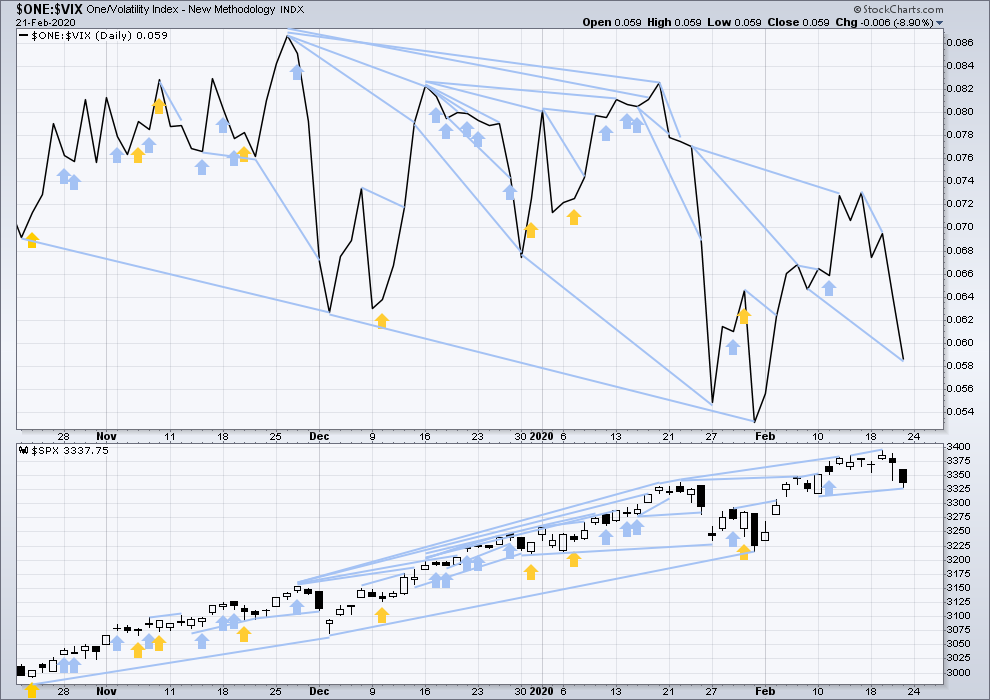
Click chart to enlarge. Chart courtesy of StockCharts.com. So that colour blind members are included, bearish signals
will be noted with blue and bullish signals with yellow.
Both price and inverted VIX moved lower on Friday. Inverted VIX has made a new low below the prior swing low of 7th/10th February, but price has not. This divergence is bearish and supports the main Elliott wave count.
DOW THEORY
Dow Theory confirmed a bear market in December 2018. This does not necessarily mean a bear market at Grand Super Cycle degree though; Dow Theory makes no comment on Elliott wave counts. On the 25th of August 2015 Dow Theory also confirmed a bear market. The Elliott wave count sees that as part of cycle wave II. After Dow Theory confirmation of a bear market in August 2015, price went on to make new all time highs and the bull market continued.
DJIA: 23,344.52 – a close on the 19th of December at 23,284.97 confirms a bear market.
DJT: 9,806.79 – price has closed below this point on the 13th of December.
S&P500: 2,532.69 – a close on the 19th of December at 2,506.96 provides support to a bear market conclusion.
Nasdaq: 6,630.67 – a close on the 19th of December at 6,618.86 provides support to a bear market conclusion.
With all the indices having moved higher following a Dow Theory bear market confirmation, Dow Theory would confirm a bull market if the following highs are made:
DJIA: 26,951.81 – a close above this point has been made on the 3rd of July 2019.
DJT: 11,623.58 – to date DJT has failed to confirm an ongoing bull market.
S&P500: 2,940.91 – a close above this point was made on the 29th of April 2019.
Nasdaq: 8,133.30 – a close above this point was made on the 26th of April 2019.
Published @ 11:21 p.m. EST.
—
Careful risk management protects your trading account(s).
Follow my two Golden Rules:
1. Always trade with stops.
2. Risk only 1-5% of equity on any one trade.
—
New updates to this analysis are in bold.


Strong bearish finish before close.
Yes, and only 3 waves up from the bottom. That was probably a 4th wave, so new lows are I’m the cards
With today’s gap down there is now an island-top-reversal from February 4 (it actually looks more like a continent-top). This island-top-reversal will remain as long as SPX is under ~3280 and is a bearish pattern.
If I didn’t know better (and I don’t), I’d wonder if some “one” used their cash weapons to drive the futures market down hard overnight…so they could accumulate at lower prices.
We have now surrendered ALL of 2020’s gains.
It would appear the “January Effect” is alive and well…
Bounce tomorrow…?
Don’t think ONE day of selling is enough but we shall let the markets decide that…as have been burnt a few times.
Good morning everybody.
I can now see a zigzag down complete. If intermediate (4) is subdividing as one of the more likely structures (flat, combination or triangle) then the first downwards wave would most likely be a zigzag and that could now be over at any moment.
That may be followed by a high bounce, which technically may make a new all time high.
It’s also possible that intermediate (4) may subdivide as a zigzag and a five down for minor A may continue lower.
Lots of index monthly shooting stars…
Very interesting, something to keep an eye on. I suspect Feb SPX ends up an up candle with close above the high of Jan. But maybe not!! I believe in the secular bull (the current high tf trend)…until it tells me not to. A shoot star or even dark cloud cover Feb monthly candle would be a strong suggestion from Ms. Market.
Interestingly, the symmetric projection of the intermediate 2 from the recent ATH points exactly at the 38.2% retrace level of the move up from the intermediate 2 low. (I know my count here is not Lara’s main, that’s not material here.) 3172 or so target.
Just a bit lower that you chart shows is the top / high of Intermediate 1. If the main count is on track, then the Intermediate 1 high must hold. A move to this area would present a relatively longer term chart showing a break out of the 3000 SPX level followed by a retest of previous resistance. If we approach 3050 SPX, the chart will look perfect and a time to back up the trucks with a very close by stop loss (say 3000 SPX). But I have no idea, at least yet, if we will go that low. Waiting patiently for this correction to give clues as to when to go long. As Lara says, Use corrections as an opportunity to join the larger trend, in this case, up.
Hey Rodney – if 3050 is the level to watch are you looking at options (3 months out or more) or straight underlying equity? Appreciate your input.
I no longer use options. I am not confident the SPX will go to 3050. I am pointing out, that level may be a great long entry point. I suspect I will at least take some long positions below 3200 and for sure IF we reach 3150. I will be scaling in my next long positions and figuring to hold them to the 3475 – 3500 level.
Of course, my opinion will change as Lara updates her counts. What we know now is that the shorter term trend has definitely changed from up to down while the longer term (weekly and monthly) is still upwards strongly. Longer term investors use corrections as an opportunity to join the longer term trend. That describes my strategy. My guess is that we are still in Minor A of Intermediate 4. I am also guessing we will see a triangle for Intermediate 4 which will use up time to allow the market a breather before scaling the upper 3000’s.
With the SPX currently near 3220, I am tempted to take the 1st of my long positions (say 10%). If Intermediate 4 is a triangle, then Minor A may be the low point in price for the triangle.
For trading the averages for consistent profits on the long side, I’m a huge fan of selling spreads under market for 1-4 weeks out. Take advantage of premium decay! And if they hit quickly (70% or more of max profit available)…consider cashing (goodbye risk!) and reloading judiciously for the same expiry to increase total profits and rate of profits. I’m pretty aggressive about managing my risk with these; I NEVER allow them to get very close to full loss sizes (max about 1/2 of that before stopping, and ideally much higher structural stops that are levels invalidating my set up).
Makes sense and much appreciated!
Watch carefully for support at the highs of the late Nov to early December consolidation zone. 3154 area, which is just below the 38.2% retrace level. I strongly suspect that area will hold, if reached, and if I see a turn off that level, I will be on it.
Thanks Kevin. I appreciate the chart.
Rolling up a massive bull put spread on UVXY from 12.50/13.00 to 13.00/13.50, this Friday expiration. Looks to me like vol move higher not quite done…
VIX is also interesting. Despite the gap higher, it still looks to me like complacency remains quite elevated. We are not really seeing steady accumulation of long vol positions but more a knee-jerk reaction to the down-side dive, which appears to have taken many market participants by surprise….
Dip buyers will be back in full force if not already. Need to see more brutal selling for a bottom, maybe margin calls from today might lead to one tomorrow…waiting and watching high beta plays…
Price in virtually all the indices have moved back down to tag prior consolidation/break-out price area. I think we need to hold these levels to avoid some serious trouble for the markets. Taking out the January lows ( only DJIA so far ) is a cautionary note if we don’t close back above today….
Anyone want to take a guess where we close tonight
Now this is what I call a gap down. More to come to the downside! ?
Hey Rodney – Nice to hear from you…getting itchy…
Lol buffet saying stocks good but can go down by 50%
This is very likely a C or third wave, and that has very interesting degree implications.
Gotta decide whether to take the money and run on TSLA and BLK shorts or bigger things yet to come.
Watching VIX…
I know your expectation for a quick resolution of the parabolic rise on TSLA!
This is a LOG chart of TSLA since the IPO, with a quick-and-dirty traced trend channel. I’m happy to count 5 waves up since the IPO, but I would wait for 1400/1500 to enter short. This may not be the time yet.
Hmmm…juicy indeed at $1,000 plus levels
Perhaps. I am opting for a conservative approach and scalping the declines, despite my expectation for much more downside. Ringing the register today and will reload above 900.
Also RR on BLK. Despite the dive, the general public is still unaware of the Ukraine/ Templeton Fund connection and the insiders may be starting to scoot ahead of it becoming news. I still think that animal is going to see an at least 30% hair-cut when word finally gets out. Plan is to re-short (via put options, of course!) on any move back above 555.00
Yes indeed, an impulsive 3 down. Should be a 4, then 5 down to complete this overall impulse. I cashed my Friday sold call spread in SPY and IWM (SPY was at 95% of max profit, and IWM was at 75%), and my sold put spreads in GLD (why didn’t I buy some VIX calls?? grrrr), and am striving to be patient here. Corrections are “easy” in the first big drop…and very, very challenging thereafter. I’ve got a SPY ‘fly right around current price (but two weeks out in expiry) and a similar ‘fly in AAPL; those are low price high payoff gambles, but looking nice right now.
Good morning Kevin. Could you show how you are currently charting this move? Thank you.
ES is reaching Lara’s target for correcting & her comments were not very bearish in the video, as she was expecting that this target may be too low.
Will this correction be a triangle and today be the low point? I’m thinking of covering and maybe try long.
I did. Good luck !
Even on the most frenzied, CB liquidity- injections- induced buying mania, we have never seen 700 point DJIA up days; not even in the middle of impulsive third waves up. A seven hundred point decline for an intermediate degree wave is not necessarily out of the ordinary, but it has me wondering about the sentiment behind that kind of intra-day dive. If we don’t hold 3250, I think we could test 3000.00 and that would have interesting implications for the over-all EW count.
Symmetry with intermediate 2 would put the ultimate low of this int. 4 at 3175 or so. Probably not going that deep but definitely could.
I’m expecting we are in a 4 of a C down on the SPX. There are many interesting points on the ES chart for a reversal and I’m hoping to see ~3300 to re-enter short. I would cover such short way above 3175 though… 3215 maybe
The failure so far to push up into that gap indicates it’s not likely to do so today…
Big gap down in SPX futures (/ES) so far tonight. 3289 at the moment.
Glad I took some shorts on Friday…and bailed out of my few remaining open longs! No question the I4 is here.
I guess we were discussing possibility like this on friday. Waiting and watching how this goes today. Futures down to 3255 now…
Airfares expected to rise by 30% as Boeing 737s are taken out of service. Maybe re examination of BA exposure is warranted as stock price has not reflected the same. Some significant hit on revenues expected.
Use active voice. Who is the source?
The grounding of the 737 happened almost 1 year ago now. Why would airlines raise price in the future? Shouldn’t they have raised prices already?
Air travel to China has been reduced. If coronavirus expands further, air travel will probably reduce worldwide, and this will not put pressure on ticket pricing (maybe a repeat of the post 9/11 conditions).
I would think the 737 issue mostly affects BA, not the airline industry.
I saw article on Apple news on fare rise coming soon and it was referring to Boeing 737 Max. However, my thoughts were to guage Boeing exposure and execute the same.
BTW, same article indicated average Chinese traveller spent $7,000 in US. Given the shutdown on travel from China, I expect domino effect across the travel industry.
That’s the coronavirus effect, and it will affect the airline industry tremendously. It has nothing to do with 737.
All in, I do not think one can expect air ticket prices to go up
Air New Zealand have been heavily affected, a huge proportion of our tourists are now from China and tourism is a huge sector for us.
They’re having big sales on airfares to Australia right now. It’s reported planes are half empty.
I’m flying to Houston on Thursday, that’ll be interesting.
Pratham
Madhyama purusha ???
uttam purush