An inside day to end the session prints a Dragonfly Doji. In the context of an upwards trend, this is bullish.
The alternate Elliott wave count was invalidated this week leaving only the one main Elliott wave count at this time. Targets remain the same.
Summary: The trend is up.
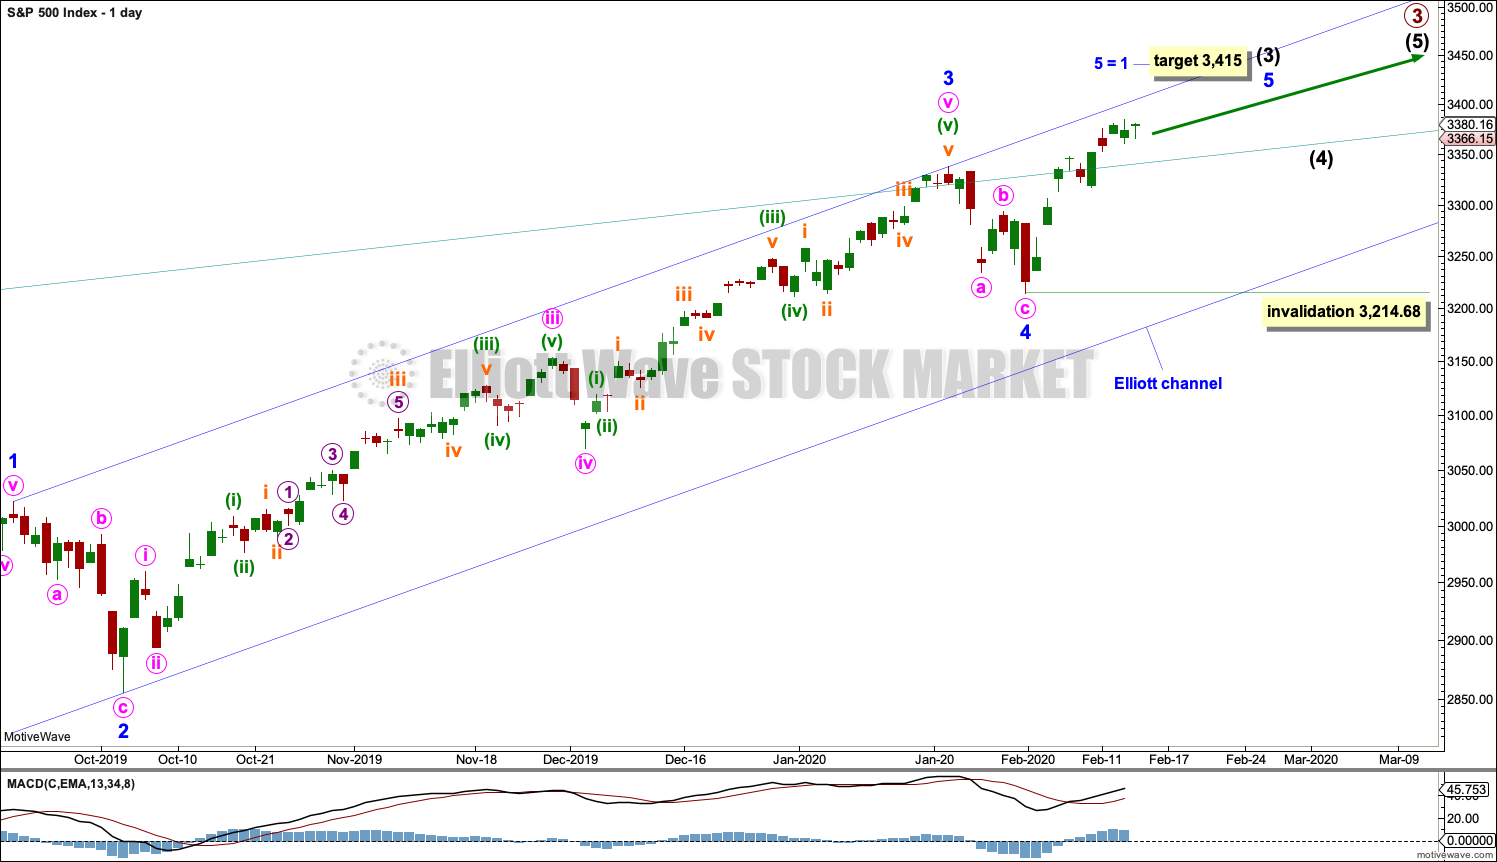
The target for the next interruption to the trend is at 3,415.
Two more large pullbacks or consolidations (fourth waves) during the next 1-2 years are expected: for intermediate (4) and then primary 4.
If price makes a new high by any amount at any time frame above 3,477.39 (even a fraction of a point on a tick chart), then this analysis switches to one of the very bullish alternate monthly charts. The next cycle degree target would then be either 4,092 or 4,213.
The biggest picture, Grand Super Cycle analysis, is here.
Last monthly charts analysis is here with video here.
ELLIOTT WAVE COUNTS
FIRST WAVE COUNT
WEEKLY CHART
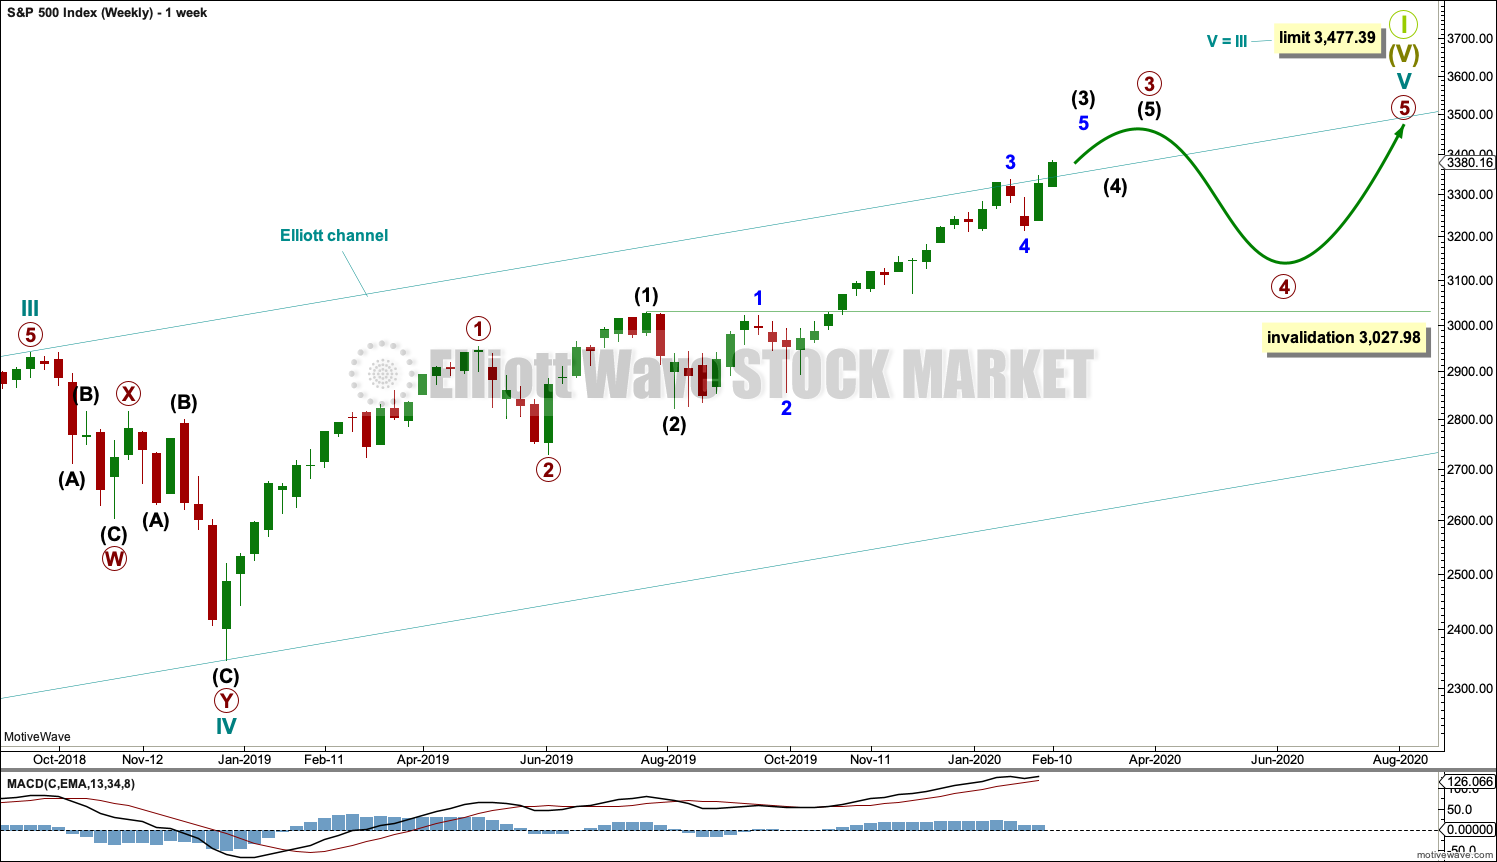
Cycle wave V may subdivide either as an impulse or an ending diagonal. Impulses are much more common, and it is clear at this stage that cycle wave V is an impulse and not a diagonal.
At this stage, cycle wave V may take another one to two or so years to complete.
A channel is drawn about the impulse of Super Cycle wave (V) using Elliott’s first technique. Draw this channel first from the high of 2,079.46 on the 5th of December 2014 to the high of 2,940.91 on the 21st of September 2018, then place a parallel copy on the low at 1,810.10 on the 11th of February 2016. Cycle wave IV found support about the lower edge.
Within Super Cycle wave (V), cycle wave III may not be the shortest actionary wave. Because cycle wave III is shorter than cycle wave I, this limits cycle wave V to no longer than equality in length with cycle wave III at 3,477.39. A new high by any amount at any time frame above this point would invalidate this main wave count in favour of one of the two alternate wave counts in the monthly chart analysis which are much more bullish.
The daily chart below will focus on movement from the end of minor wave 1 within intermediate wave (3).
Within cycle wave V, primary waves 1 and 2 may be complete. Within primary wave 3, intermediate waves (1) and (2) may be complete. Intermediate wave (3) may be over at any stage now. Intermediate wave (4) may not move into intermediate wave (1) price territory below 3,027.98.
Within cycle wave V, the corrections of primary wave 2, intermediate wave (2) and minor wave 2 all show up clearly on the weekly chart. For cycle wave V to have the right look, the corresponding corrections of minor wave 4, intermediate wave (4) and primary wave 4 should also show up on the weekly chart. Minor wave 4 now shows up on the weekly chart, and so now two more large multi-week corrections are needed as cycle wave V continues higher, and for this wave count the whole structure must complete at or before 3,477.39.
DAILY CHART
Minor waves 2 and 4 for this wave count both subdivide as zigzags; there is no alternation in structure. Minor wave 2 is deep at 0.83 the length of minor wave 1, and minor wave 4 is shallow at 0.26 the length of minor wave 3; there is alternation in depth. Minor wave 2 lasted 10 sessions and minor wave 4 lasted 7 sessions; the proportion is acceptable and gives the wave count the right look.
There is no adequate Fibonacci ratio between minor waves 1 and 3. This makes it more likely that minor wave 5 may exhibit a Fibonacci ratio. The target expects minor wave 5 to exhibit the most common Fibonacci ratio within an impulse.
Within minor wave 5, no second wave correction may move beyond its start below 3,214.68.
When intermediate waves (3) and (4) may be complete, then a target will again be calculated for primary wave 3.
Price is now above the upper edge of the teal channel, which is copied over from the weekly chart. This trend line may now be about where price may find some support.
HOURLY CHART
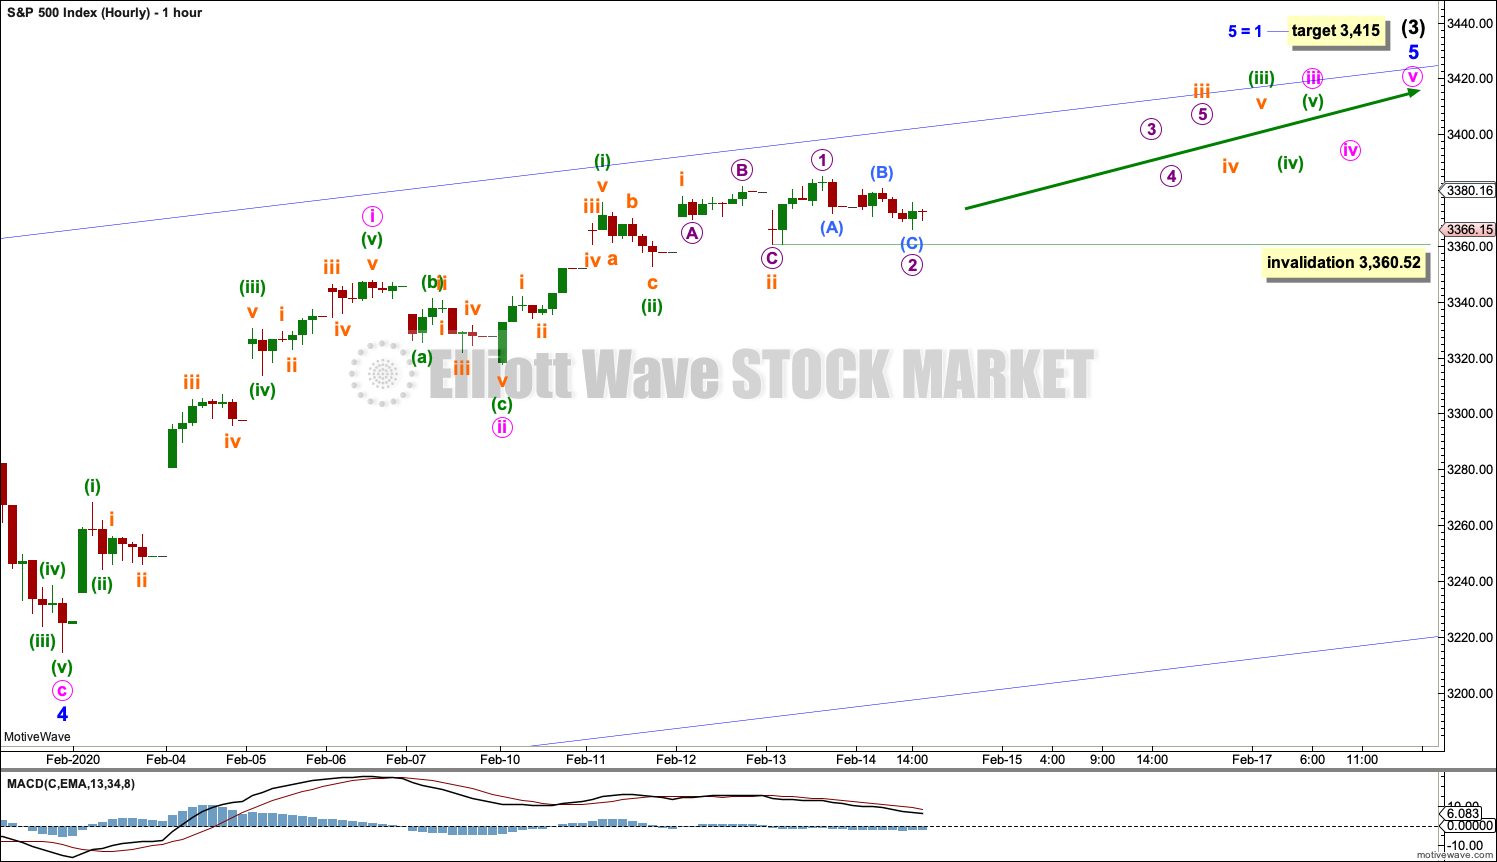
Minor wave 5 may subdivide as either an ending diagonal or an impulse. An impulse is much more common and so shall be charted unless overlapping suggests a diagonal.
So far within minor wave 5, minute waves i and ii may be complete. Minute wave iii may have begun. Within minute wave iii, minuette waves (i) and (ii) may be complete.
Within minuette wave (iii), subminuette waves i and ii may be complete. Within subminuette wave iii, micro wave 1 may be complete and micro wave 2 may not move beyond the start of micro wave 1 below 3,360.52.
This wave count now expects the next upwards movement may be a third wave at four small degrees. Some increase in momentum may be expected.
SECOND WAVE COUNT
WEEKLY CHART
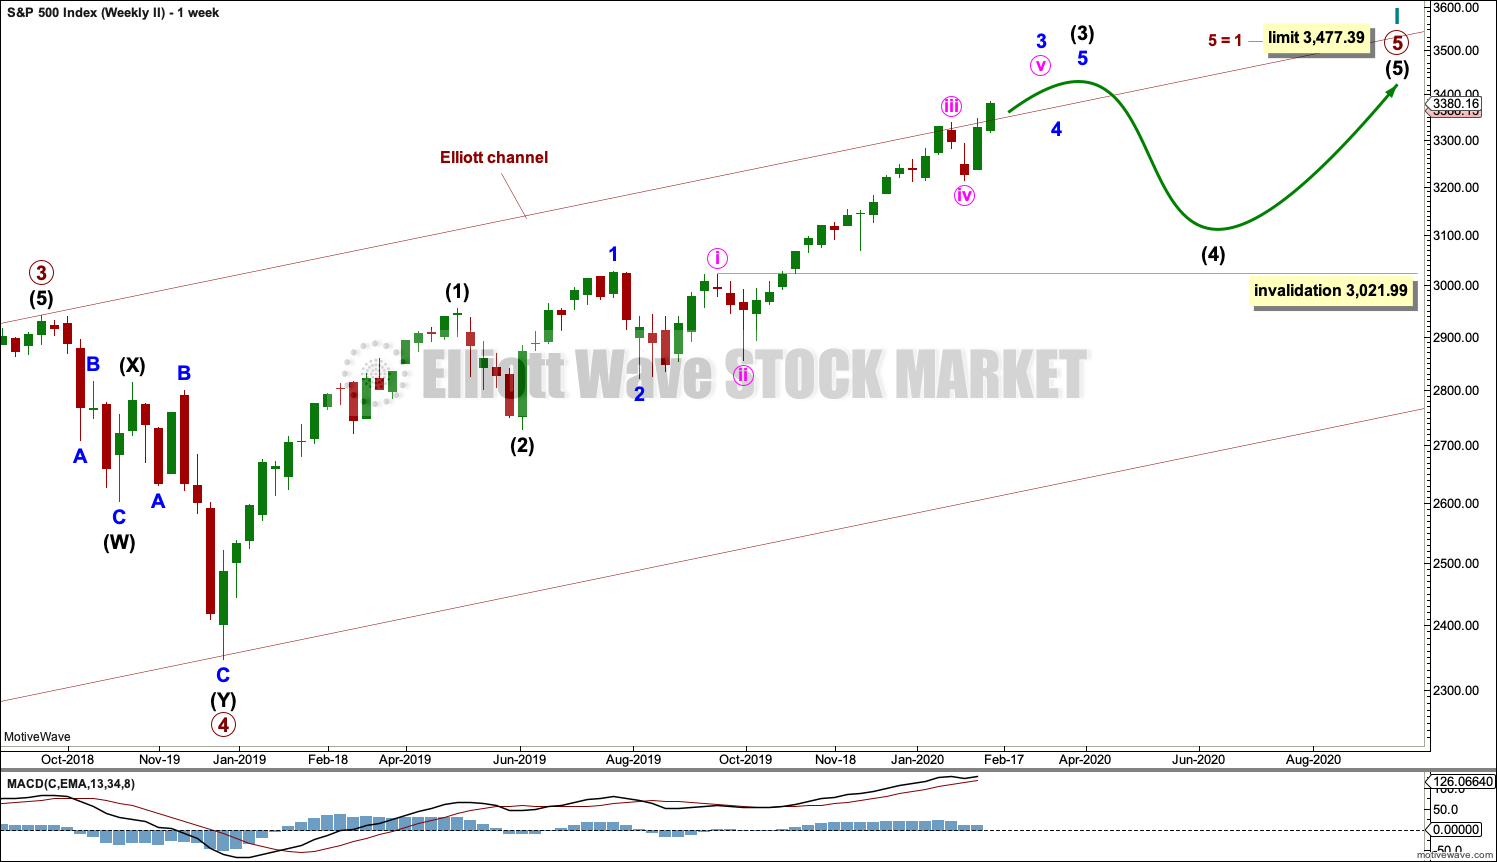
This second wave count sees all subdivisions from the end of the March 2009 low in almost the same way, with the sole difference being the degree of labelling.
If the degree of labelling for the entirety of this bull market is all moved down one degree, then only a first wave at cycle degree may be nearing an end.
When cycle wave I is complete, then cycle wave II should meet the technical definition of a bear market as it should retrace more than 20% of cycle wave I, but it may end about either the 0.382 or 0.618 Fibonacci Ratios of cycle wave I. Cycle wave II may end close to the low of primary wave II within cycle wave I, which is at 1,810.10. It is also possible that cycle wave II could be fairly shallow and only barely meet the definition of a bear market.
The impulse is still viewed as nearing an end; a fifth wave is still seen as needing to complete higher. This wave count labels it primary wave 5. Primary wave 5 may still need another year to two or so to complete, depending upon how time consuming the corrections within it may be.
Primary wave 5 may be subdividing as an impulse, in the same way that cycle wave V is seen for the first weekly chart.
TECHNICAL ANALYSIS
WEEKLY CHART
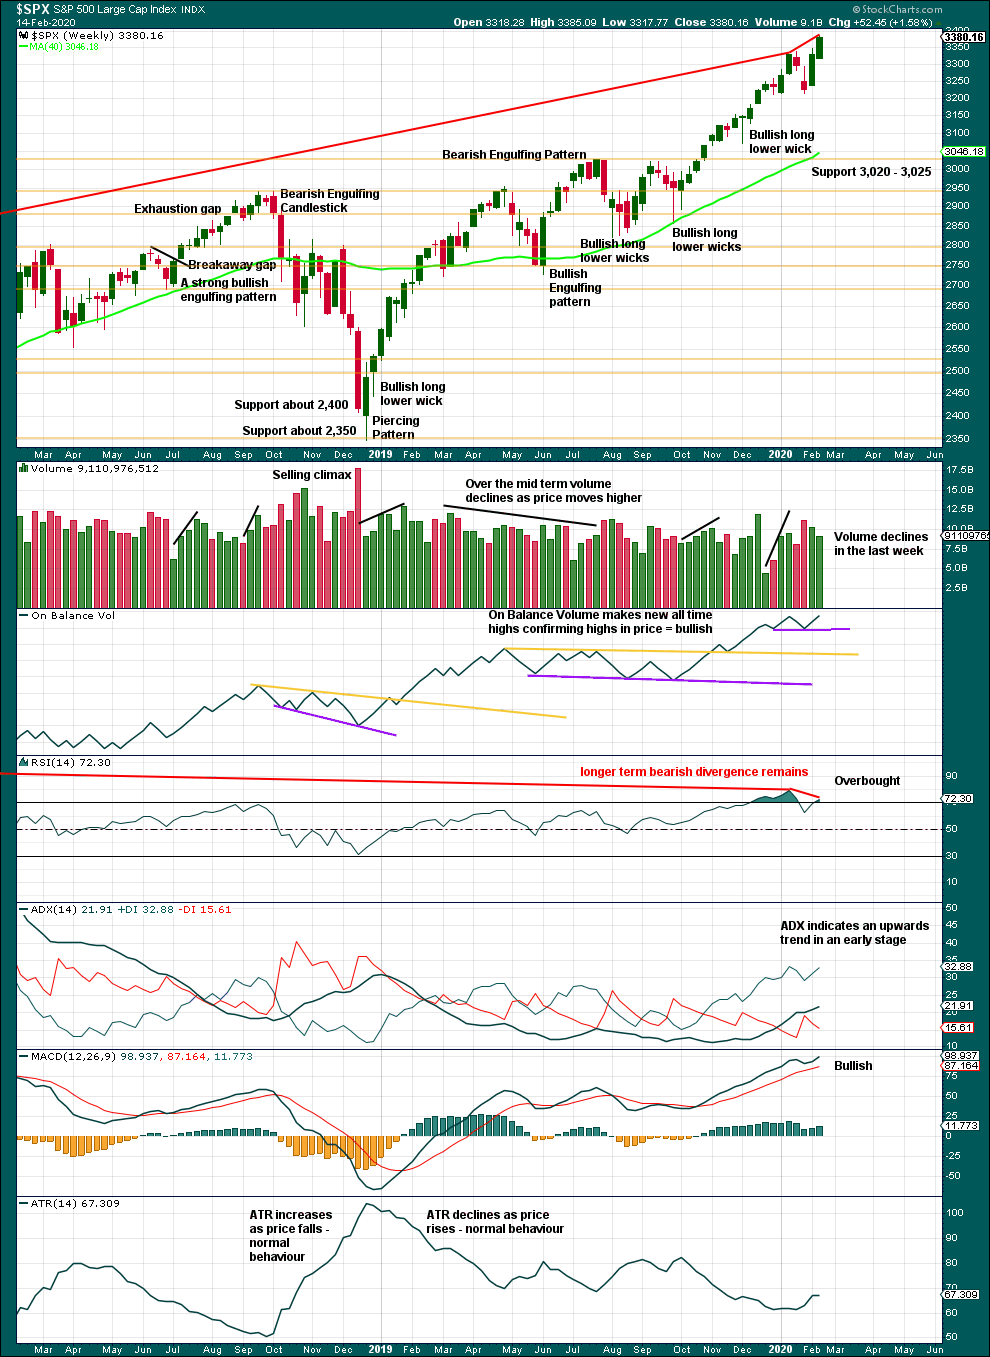
Click chart to enlarge. Chart courtesy of StockCharts.com.
It is very clear that the S&P is in an upwards trend and the bull market is continuing. Price does not move in straight lines; there will be pullbacks and consolidations along the way.
This chart is overall bullish. There are no signs of weakness in upwards movement.
A pullback or consolidation is complete and found strong support below about 3,020 to 3,025.
This bull market beginning in March 2009 has been characterised now for many years by rising price on declining volume. Despite all technical textbooks stating this is unsustainable, it has now been sustained for over a decade. This is concerning for an eventual bearish move as it may mean that support below is thin and weak, but for now the bull market continues. A decline in volume in current market conditions shall not be read necessarily as bearish.
This week exhibits some strength in upwards movement with reasonable range, although a small decline in volume again is not of a concern here.
Further pullbacks or consolidations will unfold. Do not expect price to move in a straight line. Pullbacks to support in a bull market may be used as opportunities to join an established trend.
Continued bearish divergence for the short term between price and RSI suggests the risk of a pullback remains high.
DAILY CHART

Click chart to enlarge. Chart courtesy of StockCharts.com.
The larger trend, particularly at the monthly time frame, remains up. Expect pullbacks and consolidations to be more short term in nature although they can last a few weeks.
Look for initial support for any pullbacks about 3,350. For the short term, the Dragonfly Doji on Friday is bullish.
BREADTH – AD LINE
WEEKLY CHART
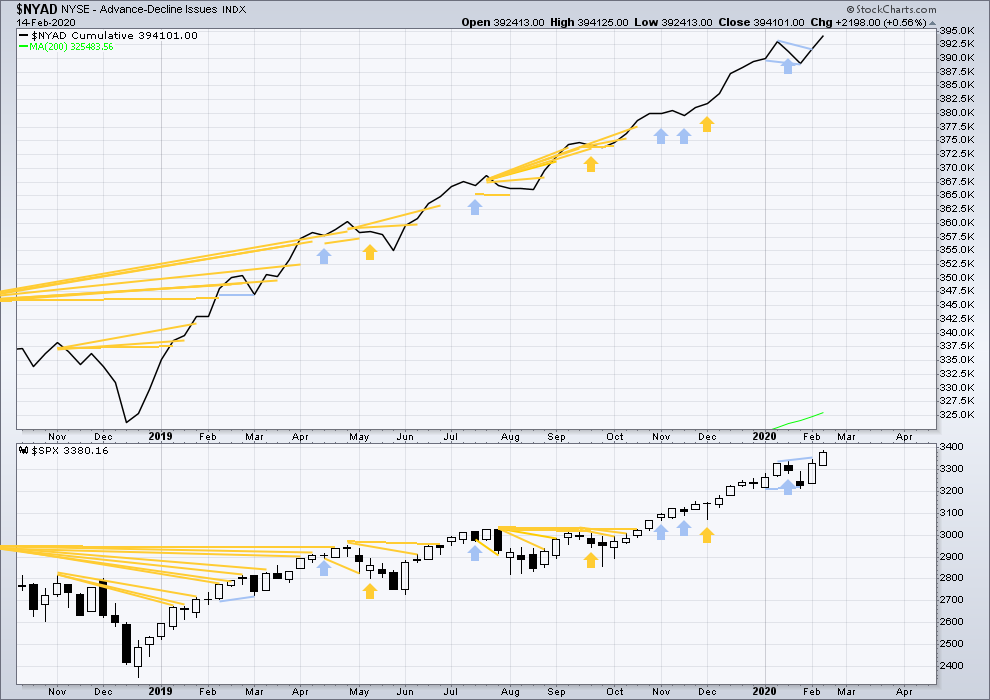
Click chart to enlarge. Chart courtesy of StockCharts.com. So that colour blind members are included, bearish signals
will be noted with blue and bullish signals with yellow.
Bear markets from the Great Depression and onwards have been preceded by an average minimum of 4 months divergence between price and the AD line with only two exceptions in 1946 and 1976. With the AD line making new all time highs last week, the end of this bull market and the start of a new bear market is very likely a minimum of 4 months away, which is mid May 2020.
In all bear markets in the last 90 years there is some positive correlation (0.6022) between the length of bearish divergence and the depth of the following bear market. No to little divergence is correlated with more shallow bear markets. Longer divergence is correlated with deeper bear markets.
If a bear market does develop here, it comes after no bearish divergence. It would therefore more likely be shallow.
Bearish short-term divergence noted last week has not been followed by any downwards movement. It is considered to have failed.
This week both price and the AD line have made new all time highs. Upwards movement has support from rising market breadth. This is bullish and supports the Elliott wave count.
Large caps all time high: 3,385.09 on 13th February 2020.
Mid caps all time high: 2,106.30 on 17th January 2020.
Small caps all time high: 1,100.58 on 27th August 2018.
For the short term, there is a little weakness now in only large caps making most recent new all time highs.
DAILY CHART
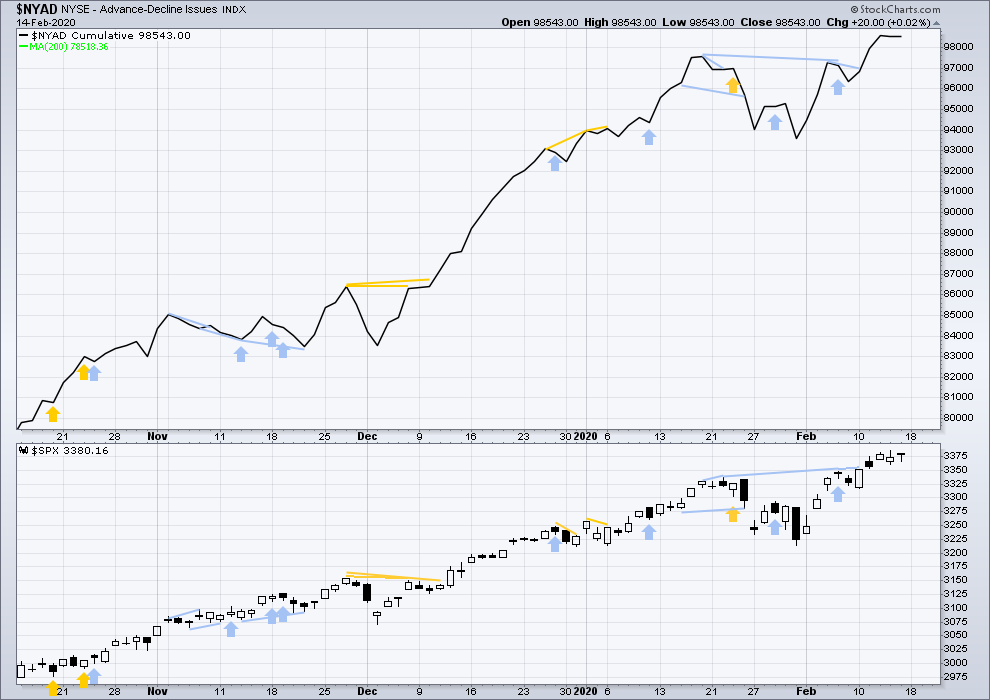
Click chart to enlarge. Chart courtesy of StockCharts.com. So that colour blind members are included, bearish signals
will be noted with blue and bullish signals with yellow.
Breadth should be read as a leading indicator.
A sideways day for price with the AD line flat is neutral.
The last all time high in price had support from a corresponding new all time high in the AD line. This supports the Elliott wave count.
VOLATILITY – INVERTED VIX CHART
WEEKLY CHART
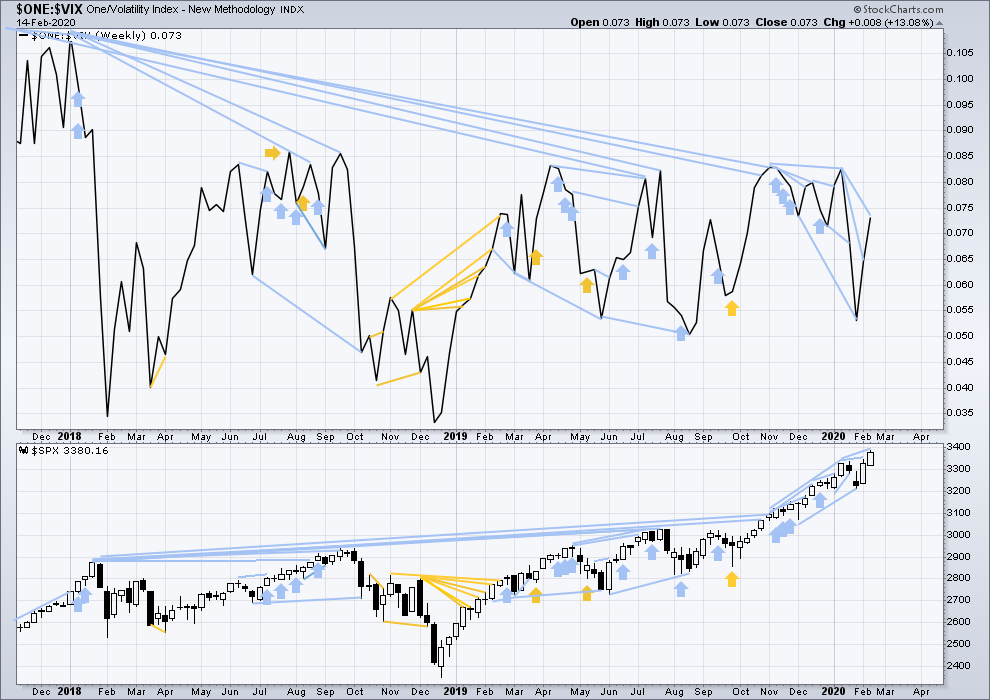
Click chart to enlarge. Chart courtesy of StockCharts.com. So that colour blind members are included, bearish signals
will be noted with blue and bullish signals with yellow.
The all time high for inverted VIX was on 30th October 2017. There is now over two years of bearish divergence between price and inverted VIX.
The rise in price is not coming with a normal corresponding decline in VIX; VIX remains elevated. This long-term divergence is bearish and may yet develop further as the bull market matures.
This divergence may be an early warning, a part of the process of a top developing that may take years. It is clearly not useful in timing a trend change from bull to a fully fledged bear market.
Price has moved higher and made a new high, but inverted VIX has not. There is again short, mid and long-term bearish divergence. This supports the main Elliott wave count.
DAILY CHART

Click chart to enlarge. Chart courtesy of StockCharts.com. So that colour blind members are included, bearish signals
will be noted with blue and bullish signals with yellow.
Price has completed an inside day. Inverted VIX has increased.
While price has moved sideways, VIX has declined. This is bullish.
DOW THEORY
Dow Theory confirmed a bear market in December 2018. This does not necessarily mean a bear market at Grand Super Cycle degree though; Dow Theory makes no comment on Elliott wave counts. On the 25th of August 2015 Dow Theory also confirmed a bear market. The Elliott wave count sees that as part of cycle wave II. After Dow Theory confirmation of a bear market in August 2015, price went on to make new all time highs and the bull market continued.
DJIA: 23,344.52 – a close on the 19th of December at 23,284.97 confirms a bear market.
DJT: 9,806.79 – price has closed below this point on the 13th of December.
S&P500: 2,532.69 – a close on the 19th of December at 2,506.96 provides support to a bear market conclusion.
Nasdaq: 6,630.67 – a close on the 19th of December at 6,618.86 provides support to a bear market conclusion.
With all the indices having moved higher following a Dow Theory bear market confirmation, Dow Theory would confirm a bull market if the following highs are made:
DJIA: 26,951.81 – a close above this point has been made on the 3rd of July 2019.
DJT: 11,623.58 – to date DJT has failed to confirm an ongoing bull market.
S&P500: 2,940.91 – a close above this point was made on the 29th of April 2019.
Nasdaq: 8,133.30 – a close above this point was made on the 26th of April 2019.
Published @ 10:09 p.m. EST.
—
Careful risk management protects your trading account(s).
Follow my two Golden Rules:
1. Always trade with stops.
2. Risk only 1-5% of equity on any one trade.
—
New updates to this analysis are in bold.

TSLA has broken a parabolic rise. Reloading 630 strike May 15 puts for 30.80 per contract….a close back above 900 says I am toast! 🙂
I think I’ll wait for a double top around 960…the TSLA fan base is RABID!!
Elon just might be able to scrounge up a few more billion to plow into share buybacks. Hopefully he retired some of that 2 billion already floated. Bezos has been unloading Amazon shares like there is no tomorrow….hmmnnn…!
https://www.marketwatch.com/story/the-hedge-fund-investor-who-has-beaten-warren-buffett-by-200x-likely-made-a-killing-on-tesla-2020-02-18
he just bought a mansion in Beverly hills
I am waiting for break below $755 to short.
If the markets closes GREEN today, suspect a lot of shorts will be trapped and slight ramp(expecting tomorrow based on repo monies) will catch fire quickly. Still a lot of trading left in the day…watching patiently.
Hourly chart update
When I look at minor 5 on the daily chart , this is how I want to label it.
It looks like an unfolding five (or a complete three).
It will fit on the hourly chart if in the middle of minute iii, subminuette ii is an expanded flat and subminuette i price territory reaches up to 3,368.17, then subminuette iv has its price territory at 3,369.72.
If this count is invalidated then I’d consider intermediate (4) as maybe just begun, or minor 4 continuing as an expanded flat (but that would have a lower probability because of poor proportion)
The implication is that even in the “bullish case”, this market only has a minute v to run up before an intermediate 4 down (!!!) initiates. A few days perhaps.
Also, because this minor 5 is so small, the target nominal range for said intermediate 4 is not very deep. Which is consistent with a broader bullish view (which I have/share).
Stay nimble friends!
Hi everyone
What would happen if we violate the hourly chart. Below 3,360.52 level?
Thank You
Every chart above just show it only goes up with 0 options to the downside!
It has been violated already. That is the same question I had for Lara last week
Potentially it’s a complete minor 5 up, which completes the intermediate 3 up, and now the intermediate 4 down is starting.
Along with selling an overhead bear call spread in RUT for Friday, I’ve also put on an SPX butterfly for Friday, 3360-3340-3320. We’ll see!
Just watch as TWO separate repo coming out for approx 30 billion each with open date Feb 14 and expiration of Feb 25 and 27 (short term repo). That money will find way into the market sooner than later. Today’s close will be fun to watch.
this could also be start of Minor 4, with the last down leg being Minute 4 of Minor 3… so lots of possibilities.
I also thought that it still might be late minor 4 coming finally, but Lara has invalidated original minor 4 count. I’m actually not 100% sure why.
Because to see minor 4 continuing would now see it only 2/3 complete and when its done it would be way longer in duration than minor 2. The disproportion would give it the wrong look.
It could be a reasonable alternate idea though
Here’s a model that completes the intermediate 3. Assuming the final ending diagonal at minute degree is legit (the final minuette v is truncated).
Full disclosure: bailed on my SPX butterfly for a few $’s loss, exited my RUT bear call spread for few $’s profit…and holding fairly large sold bull put spreads in SPX and NDX for Friday. So I’m long. But staying nimble here. I still suspect some significant selling before week’s end, but I think my bull spreads are safe.
Above 330 you should be good, with a roll out if needed with a round number test. After we tag around 3400 the wave down wll likely slice through it…
All major US equity markets moving down in overnight futures.
/RTY with 4 hour bars here, with overnight data. As shown, breaks of the swing trend lines tends to be “significant”. And this action Monday night is breaking the current up trend line, to the down side.
High potential for a significant selling day tomorrow.
Looks like Apple reiterated the earning guidance towards the lower end of the range. Interesting day ahead indeed.
New York is closed today to celebrate Washington’s Birthday.
Next analysis will be tomorrow.
Has anyone looked at SHOP chart lately? Stock price is way out of whack. Observations welcome.
Nice base and breakout last Fall.
Now, I won’t touch it. Shorting skyrocketing stocks just isn’t my game. I trade for consistent profits, and making “risky” bets is the last thing I’m interested in. Okay, actually, I LOVE to make risky bets!!! And I work my ass off to stop myself from doing so. My “gamble gamble” nature is my biggest enemy.
Thanks Kevin- understand the urge to take that gamble as I have been putting it off for a while. There will be time to short it but for now just watching from distance.
The hourly chart shows 4 series of 1-2, which is very bullish.
In my experience, the more 1-2 I see, the more I’m looking for another structure. I’m following the count below, with an ending diagonal developing in the final wave up. I’m happy with the 3415 target, but I’m waiting for a quick resolution.
I get very nervous every time I see a highly nested sequence of 1-2’s myself. If there’s a break upward and it keeps moving…sure!!! But caution is warranted in my view.
As for your proposed count here, it would appear your minor 5 would end up being hugely out of proportion with your minor 1 and 3. Seems unlikely to me.
Ignoring the count for a moment, as I said early Friday, it looks a bit like topping action (slowing momentum, rounding top setting up). Doesn’t mean it is. Just “indicates” that. So caution is warranted. I’m waiting for clarifying action on Tuesday morning before establishing any significant new positions. I really WANT to sell a big load of put spreads under market for expiry on Friday…but not until I have some confidence that some kind of 2 wave isn’t initiating this coming week that could take price down by as much as 61.8% of the move up!
Oops, I miss read your count there, and retract my comment about it having proportionality problems.
I’m looking at the move out of the blue 4 low and wondering if it might be tracing out an ending diagonal to complete the intermediate 3 and soon (this week or maybe next Monday) launch intermediate 4 down. I continue to be very suspicious about a strong bullish posture here primarily due to this slowing momentum.
Ekam
Dve