Downwards movement unfolded as expected for Friday. At the end of the week, all of volume, breadth and volatility are used to indicate which Elliott wave count may be most likely.
Summary: A pullback or consolidation is most likely still underway. It may end sometime next week. A downwards swing may continue that may end slightly below 3,214.68, or it may fall short of this point.
Alternatively, it is possible the pullback was brief and shallow and over on the 31st of January. This alternate wave count has little support from technical analysis.
Three large pullbacks or consolidations (fourth waves) during the next 1-2 years are expected: for minor wave 4 (underway), then intermediate (4), and then primary 4.
The biggest picture, Grand Super Cycle analysis, is here.
Last monthly charts analysis is here with video here.
ELLIOTT WAVE COUNTS
FIRST WAVE COUNT
WEEKLY CHART
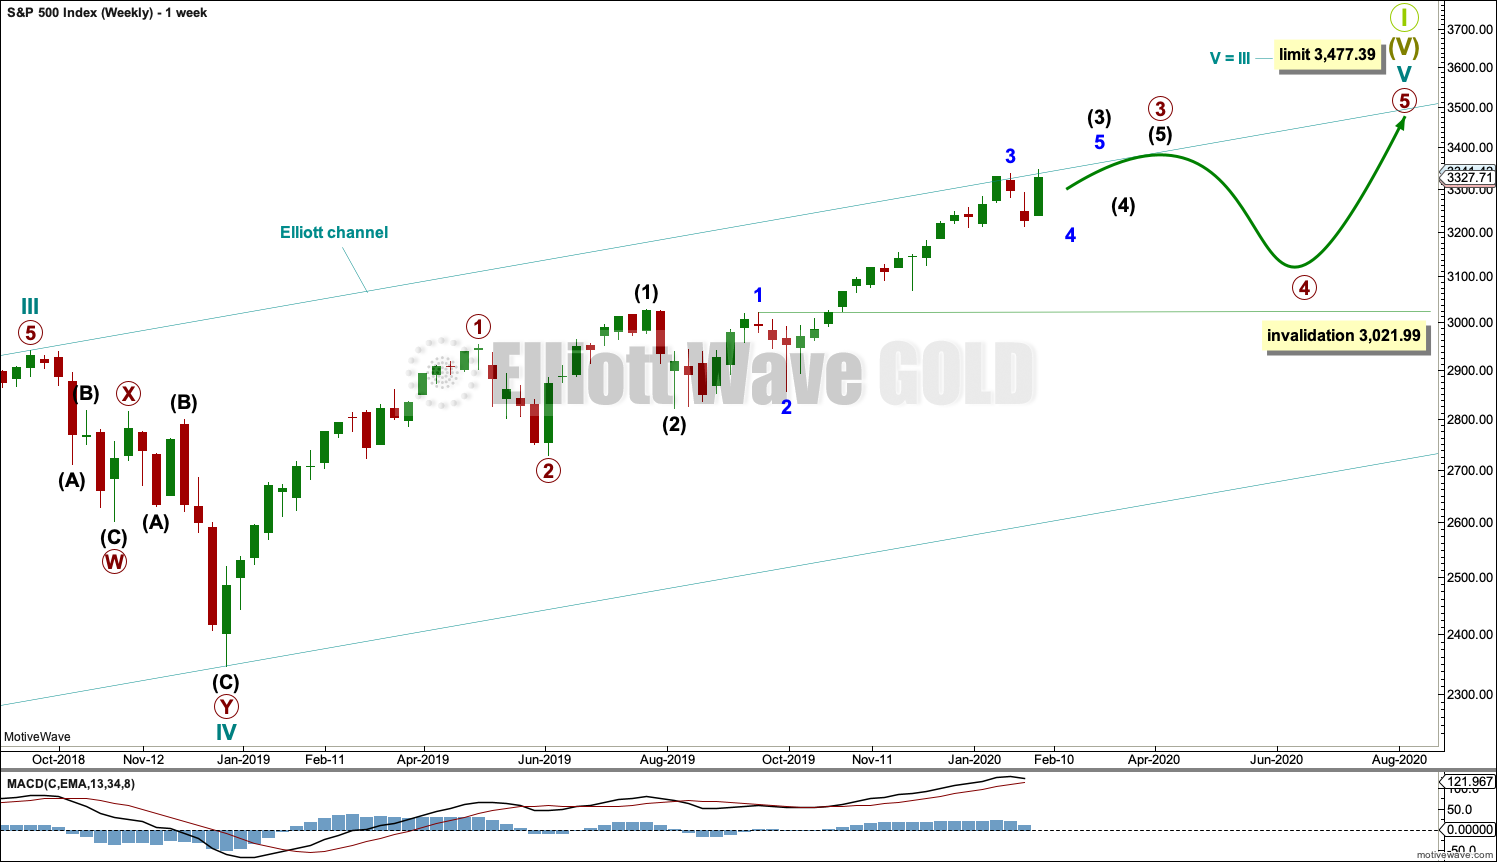
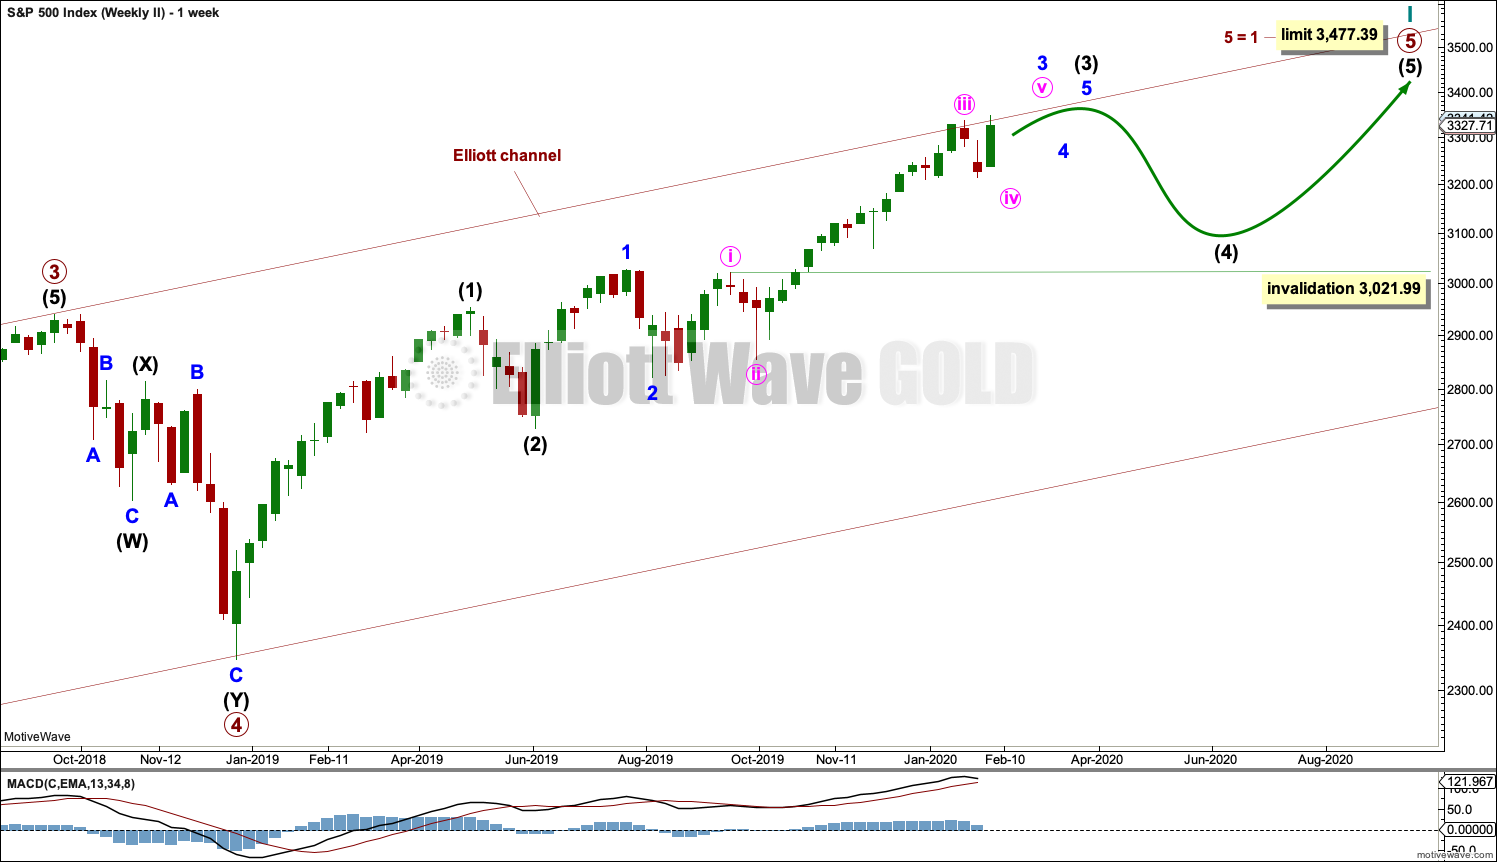
Cycle wave V may subdivide either as an impulse or an ending diagonal. Impulses are much more common, and it is clear at this stage that cycle wave V is an impulse and not a diagonal.
At this stage, cycle wave V may take another one to two or so years to complete.
A channel is drawn about the impulse of Super Cycle wave (V) using Elliott’s first technique. Draw this channel first from the high of 2,079.46 on the 5th of December 2014 to the high of 2,940.91 on the 21st of September 2018, then place a parallel copy on the low at 1,810.10 on the 11th of February 2016. Cycle wave IV found support about the lower edge.
Within Super Cycle wave (V), cycle wave III may not be the shortest actionary wave. Because cycle wave III is shorter than cycle wave I, this limits cycle wave V to no longer than equality in length with cycle wave III at 3,477.39. A new high by any amount at any time frame above this point would invalidate this main wave count in favour of one of the two alternate wave counts in the monthly chart analysis which are much more bullish.
The daily chart below will focus on movement from the end of minor wave 1 within intermediate wave (3).
Within cycle wave V, primary waves 1 and 2 may be complete. Within primary wave 3, intermediate waves (1) and (2) may be complete. Within intermediate wave (3), minor wave 4 may not move into minor wave 1 price territory below 3,021.99.
Within cycle wave V, the corrections of primary wave 2, intermediate wave (2) and minor wave 2 all show up clearly on the weekly chart. For cycle wave V to have the right look, the corresponding corrections of minor wave 4, intermediate wave (4) and primary wave 4 should also show up on the weekly chart. Three more large multi-week corrections are needed as cycle wave V continues higher, and for this wave count the whole structure must complete at or before 3,477.39.
DAILY CHART
All of primary wave 3, intermediate wave (3) and minor wave 3 may only subdivide as impulses.
Minor wave 3 now looks complete.
Minor wave 2 was a sharp deep pullback, so minor wave 4 may be expected to be a very shallow sideways consolidation to exhibit alternation. Minor wave 2 lasted 2 weeks. Minor wave 4 may be a longer lasting consolidation. Minor wave 4 may end within the price territory of the fourth wave of one lesser degree; minute wave iv has its range from 3,154.26 to 3,070.49. However, this target zone at this stage looks to be too low.
Minor wave 4 may not move into minor wave 1 price territory below 3,021.99.
When minor wave 4 may be complete, then a target will again be calculated for intermediate wave (3).
When intermediate waves (3) and (4) may be complete, then a target will again be calculated for primary wave 3.
Draw an Elliott channel about intermediate wave (3): draw the first trend line from the end of minor wave 1 to the end of minor wave 3, then place a parallel copy on the end of minor wave 2. Minor wave 4 may find support at the lower edge of this channel if it is long lasting or deep enough. It is possible that minor wave 4 may breach the lower edge of the channel as fourth waves are not always contained within a channel drawn using this technique. If minor wave 4 breaches the channel, then it shall need to be redrawn using Elliott’s second technique.
Price has again reached the upper edge of the teal channel copied over from the weekly chart and then quickly reversed to close back within the channel on Friday. This trend line has strong technical significance and so a further reaction down from here is a reasonable expectation.
Minor wave 4 may subdivide as any corrective structure, most likely a flat, triangle or combination. Within all of a flat, triangle or combination, there should be an upwards wave which may be fairly deep. That may now be complete, but it is possible that it may continue a little higher. The common range for minute wave b within a flat is from 3,337.77 to 3,384.45.
HOURLY CHART
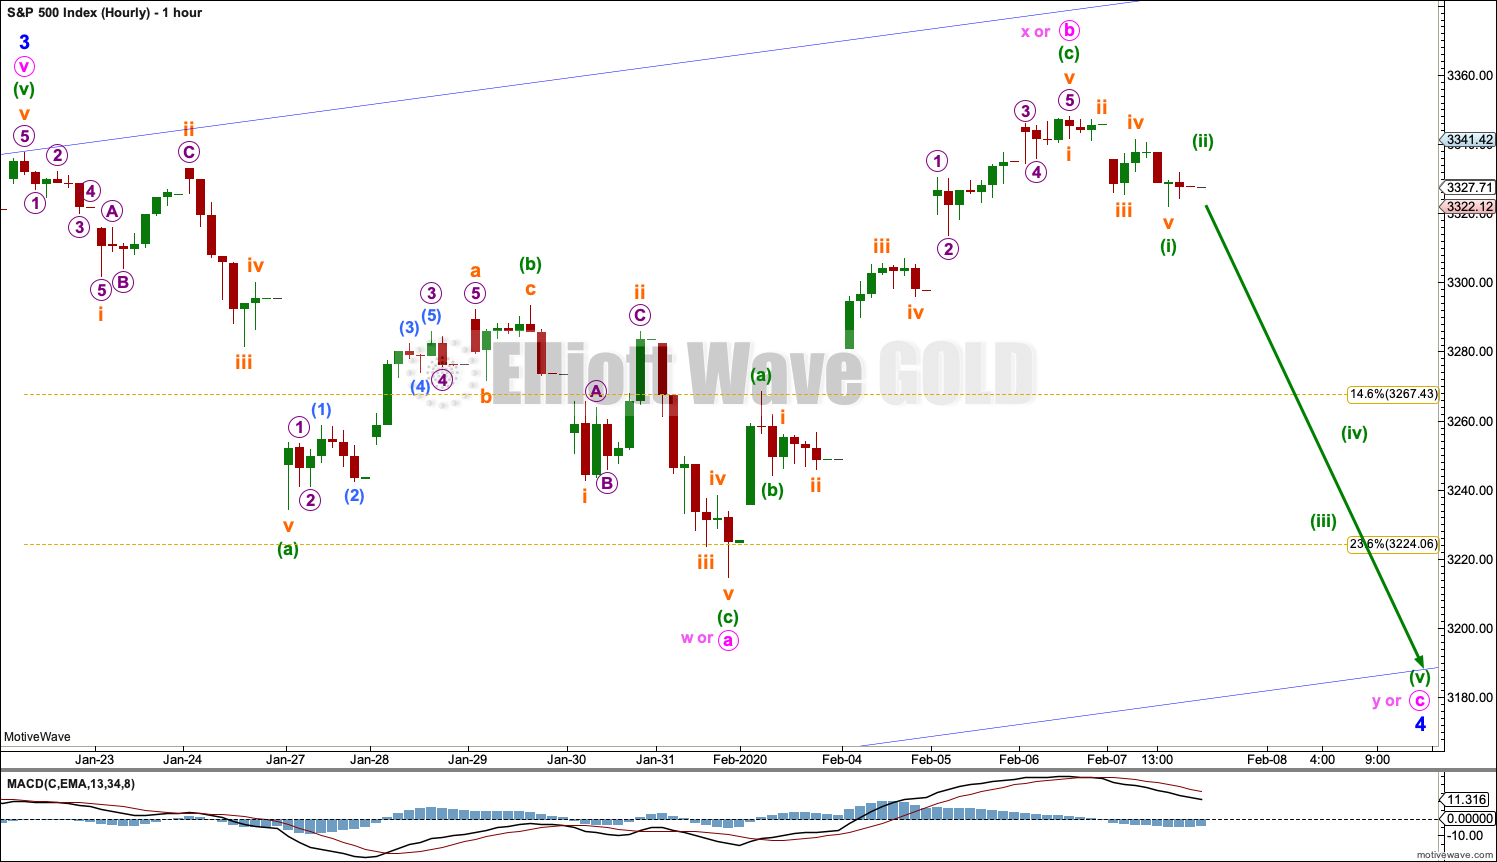
Minor wave 4 is here labelled a possible expanded flat correction, but it may still morph into one of either a combination or a running triangle.
If minor wave 4 unfolds as an expanded flat correction, then within it minute wave c downwards may have just begun. The most common Fibonacci ratio for minute wave c within an expanded flat would be 1.618 the length of minute wave a, at 3,148. However, this target would break below support of the blue Elliott channel. Although this is possible, it has a lower probability than price finding support there. The blue channel may be used as a guide to where an expanded flat may end.
If minor wave 4 unfolds as a running triangle, then minute wave b may be complete or may extend higher. Minute wave c may not move beyond the end of minute wave a below 3,214.68.
If minor wave 4 unfolds as a combination, then minute wave x within it may be complete, or may extend higher. Minute wave y would need to unfold as either a flat or triangle. Minute wave y may end about the same level as minute wave w at 3,214.68, so that the structure takes up time and moves price sideways.
Downwards movement for Friday will subdivide as a five wave impulse on the five minute chart; this is labelled minuette wave (i). If this is correct, then minuette wave (ii) may not move beyond the start of minuette wave (i) above 3,347.96.
ALTERNATE DAILY CHART
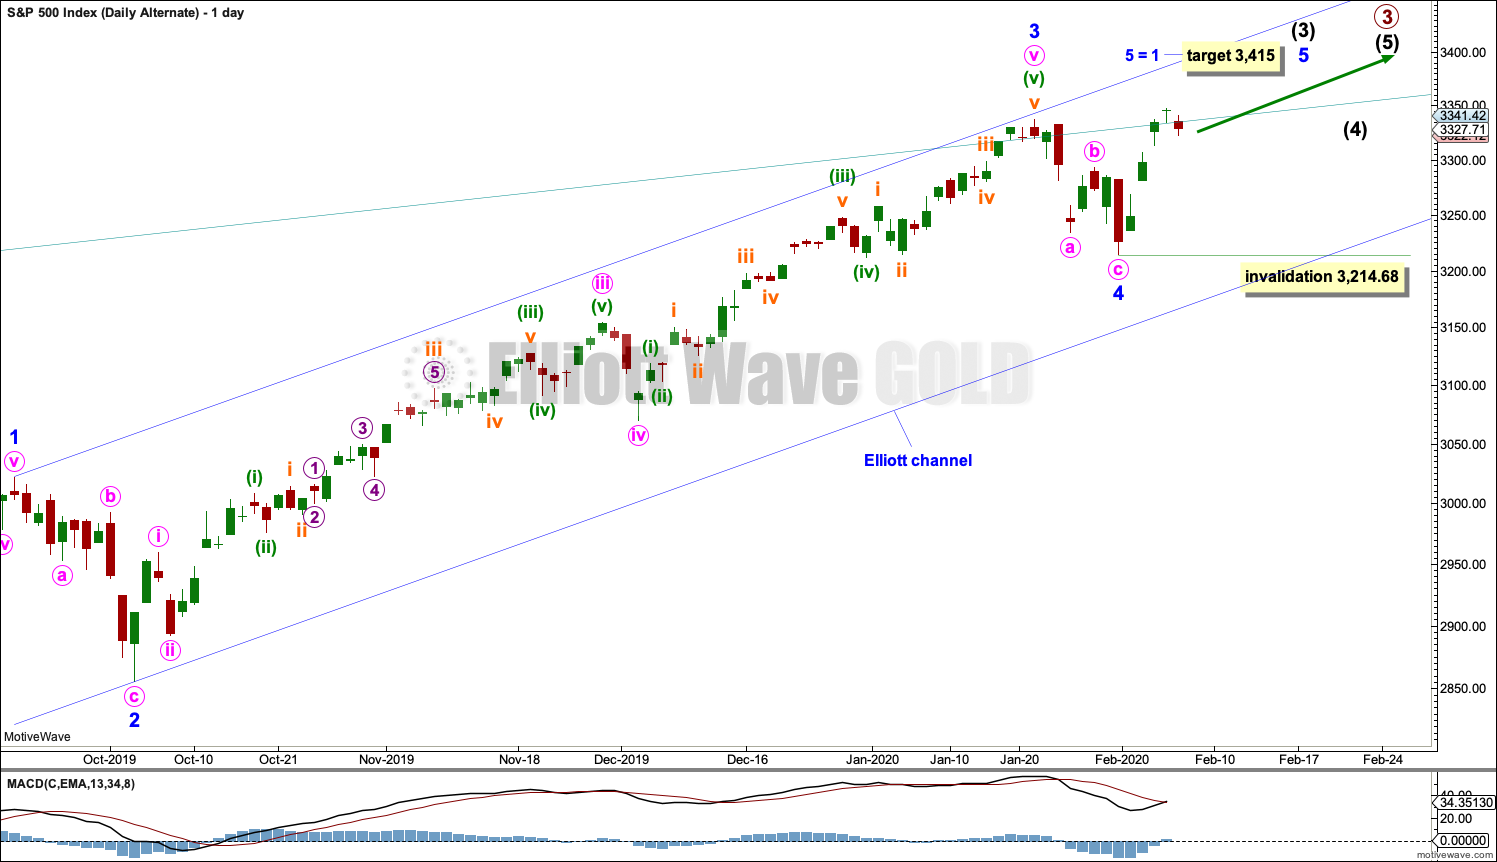
This alternate daily chart looks at the possibility that minor wave 4 may be a complete zigzag over at the last low. This alternate chart does not have as much support from classic technical analysis as the main wave count.
Minor waves 2 and 4 for this wave count both subdivide as zigzags; there is no alternation in structure. Minor wave 2 is deep at 0.83 the length of minor wave 1, and minor wave 4 is shallow at 0.26 the length of minor wave 3; there is alternation in depth. Minor wave 2 lasted 10 sessions and minor wave 4 lasted 7 sessions; the proportion is acceptable and gives the wave count the right look.
There is no adequate Fibonacci ratio between minor waves 1 and 3. This makes it more likely that minor wave 5 may exhibit a Fibonacci ratio. The target expects minor wave 5 to exhibit the most common Fibonacci ratio within an impulse.
Within minor wave 5, no second wave correction may move beyond its start below 3,214.68.
ALTERNATE HOURLY CHART
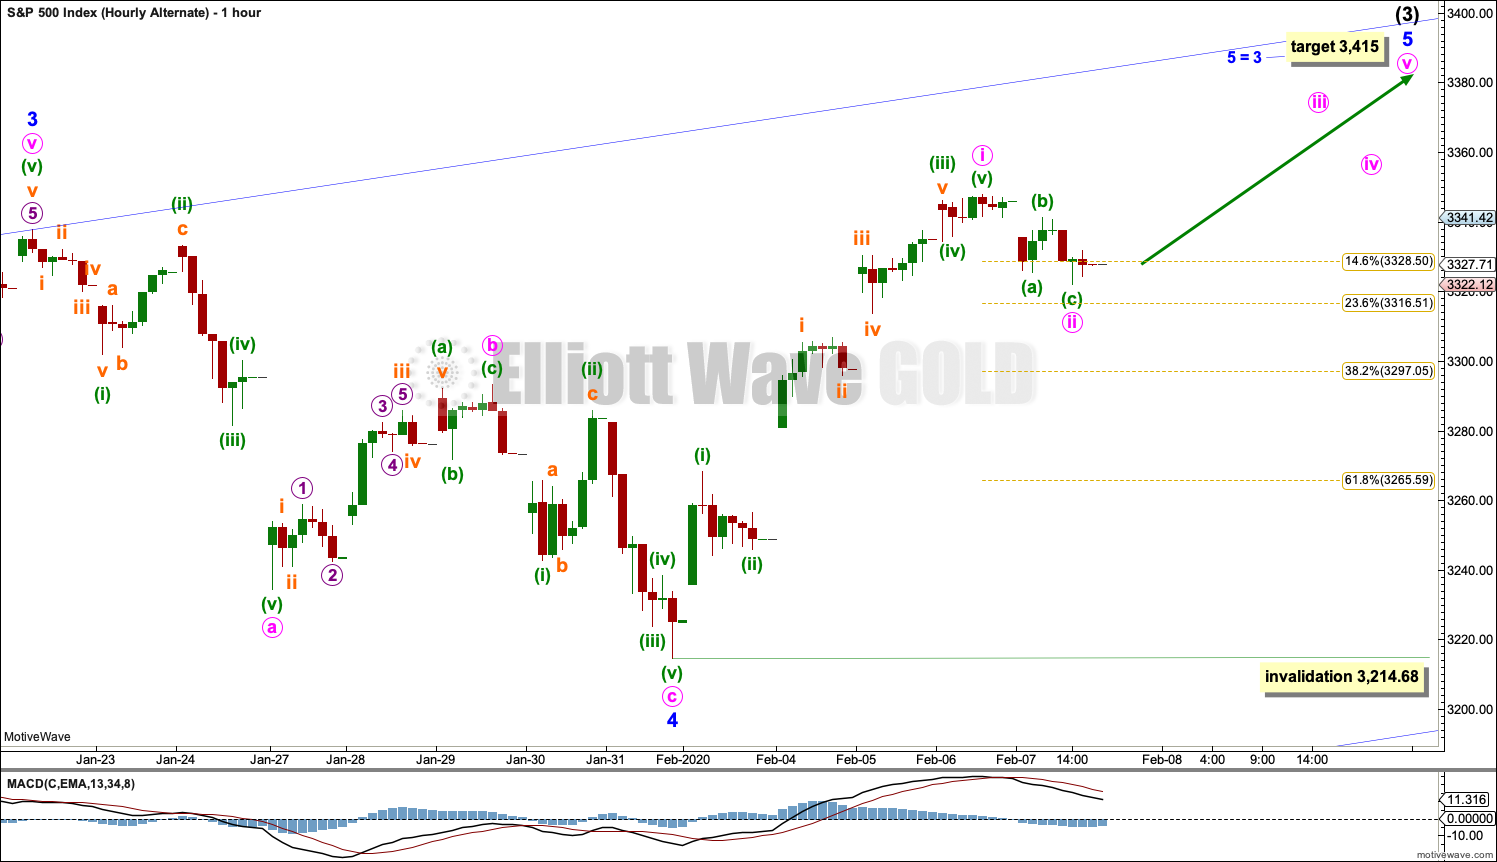
Minute wave i may be complete. Minute wave ii may also be complete as a brief shallow zigzag. Minute wave ii may also continue lower as a double zigzag.
Minute wave ii may not move beyond the start of minute wave i below 3,214.68.
SECOND WAVE COUNT
WEEKLY CHART
This second wave count sees all subdivisions from the end of the March 2009 low in almost the same way, with the sole difference being the degree of labelling.
If the degree of labelling for the entirety of this bull market is all moved down one degree, then only a first wave at cycle degree may be nearing an end.
When cycle wave I is complete, then cycle wave II should meet the technical definition of a bear market as it should retrace more than 20% of cycle wave I, but it may end about either the 0.382 or 0.618 Fibonacci Ratios of cycle wave I. Cycle wave II may end close to the low of primary wave II within cycle wave I, which is at 1,810.10. It is also possible that cycle wave II could be fairly shallow and only barely meet the definition of a bear market.
The impulse is still viewed as nearing an end; a fifth wave is still seen as needing to complete higher. This wave count labels it primary wave 5. Primary wave 5 may still need another year to two or so to complete, depending upon how time consuming the corrections within it may be.
Primary wave 5 may be subdividing as an impulse, in the same way that cycle wave V is seen for the first weekly chart.
TECHNICAL ANALYSIS
WEEKLY CHART
Click chart to enlarge. Chart courtesy of StockCharts.com.
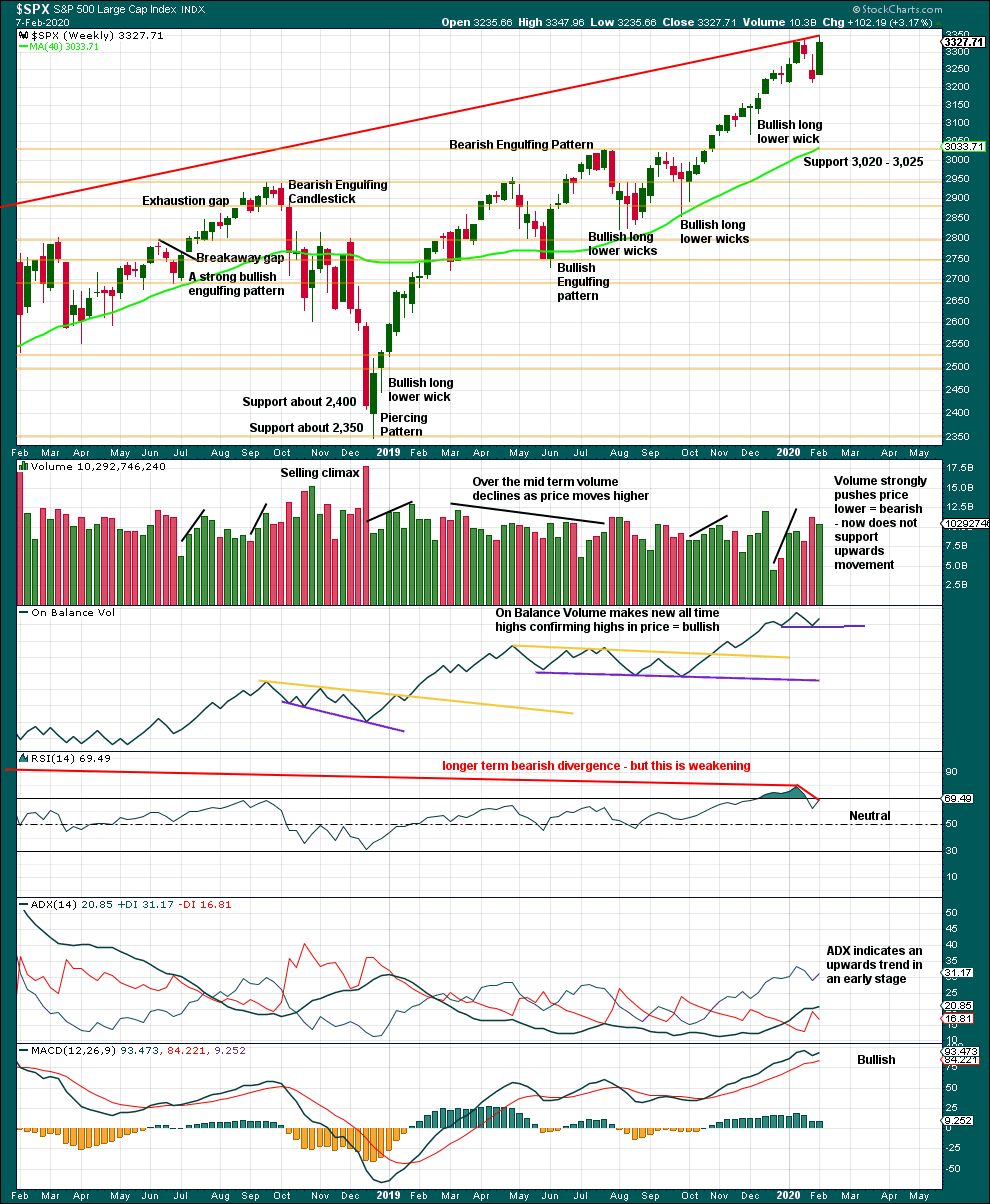
It is very clear that the S&P is in an upwards trend and the bull market is continuing. Price does not move in straight lines; there will be pullbacks and consolidations along the way.
This chart is overall bullish. There are no signs of weakness in upwards movement.
A pullback or consolidation has begun. This is relieving extreme conditions. Look for strong support below about 3,020 to 3,025.
Although price has made a slight new high this week, it has not done so with conviction. Volume is weaker than the prior downwards week, and RSI and On Balance Volume exhibit short-term bearish divergence.
DAILY CHART
Click chart to enlarge. Chart courtesy of StockCharts.com.
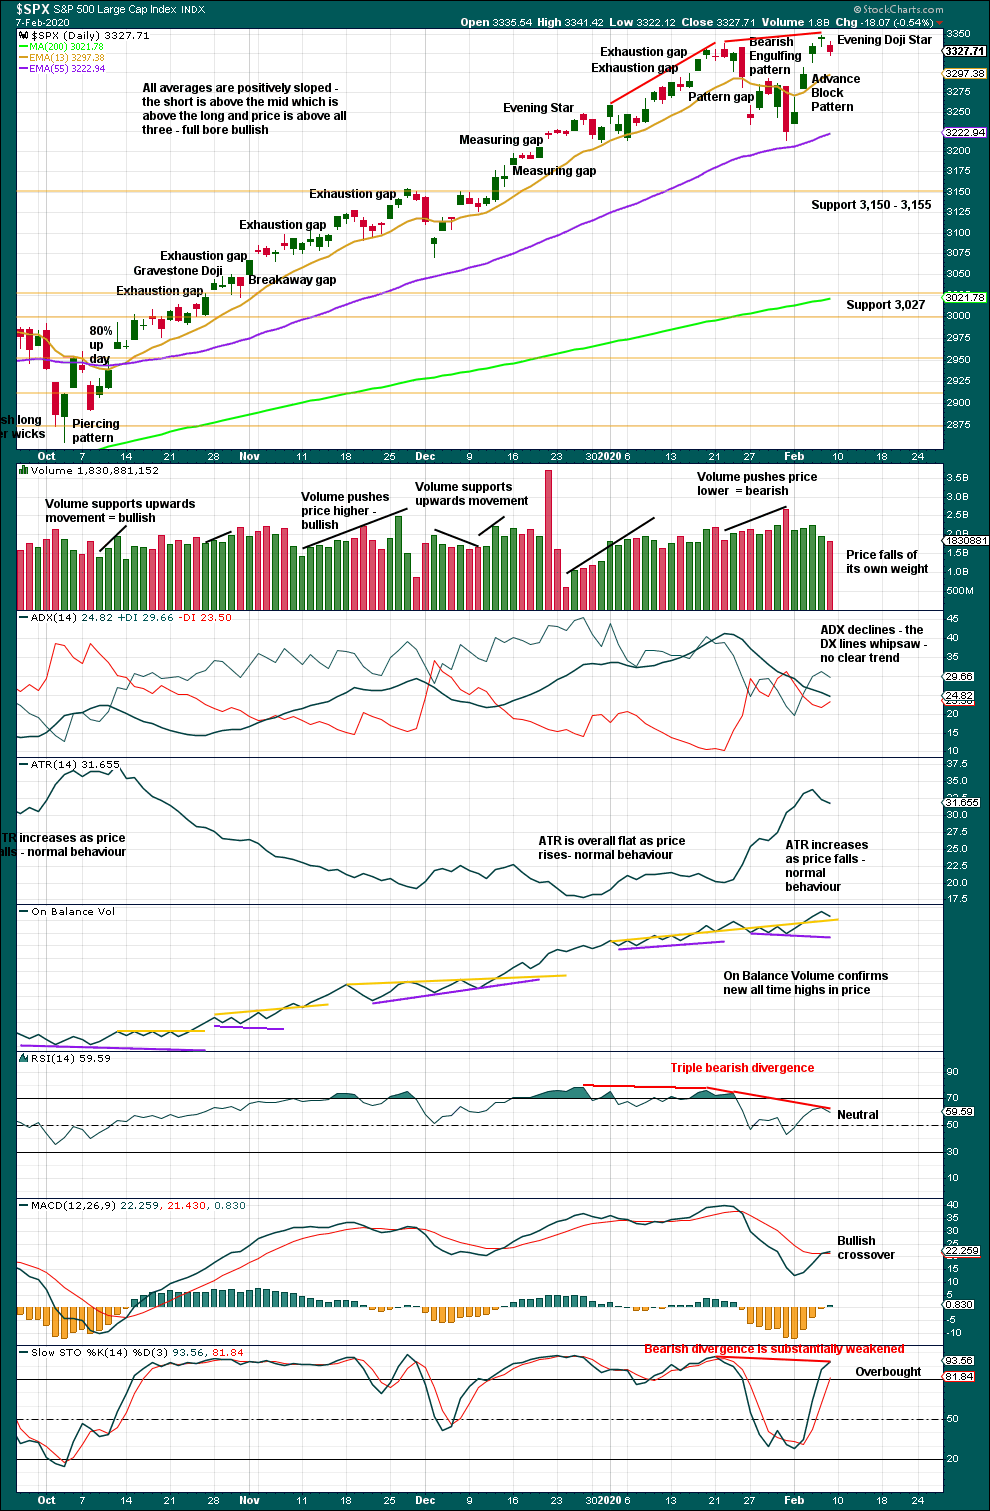
The larger trend, particularly at the monthly time frame, remains up. Expect pullbacks and consolidations to be more short term in nature although they can last a few weeks.
In a bull market which may continue for months or years, pullbacks and consolidations may present opportunities for buying when price is at or near support.
Sustainable lows may be identified by a 180° reversal of sentiment in a 90% down day followed by one or more of the following things:
– Either a 90% up day or two back to back 80% up days within 3 sessions of the 90% down day.
– RSI may reach oversold and then exhibit bullish divergence.
– A strong bullish candlestick pattern with support from volume.
In the absence of bullish reversal signs, expect the pullback or consolidation to continue.
The Advance Block pattern is now followed by a small Evening Doji Star. Together these indicate weakness in upwards movement and a potential trend change. In conjunction with now strong and triple bearish divergence between price and RSI, after the prior upwards trend reached extreme and after RSI reached overbought, caution for long positions is warranted.
BREADTH – AD LINE
WEEKLY CHART
Click chart to enlarge. Chart courtesy of StockCharts.com. So that colour blind members are included, bearish signals
will be noted with blue and bullish signals with yellow.
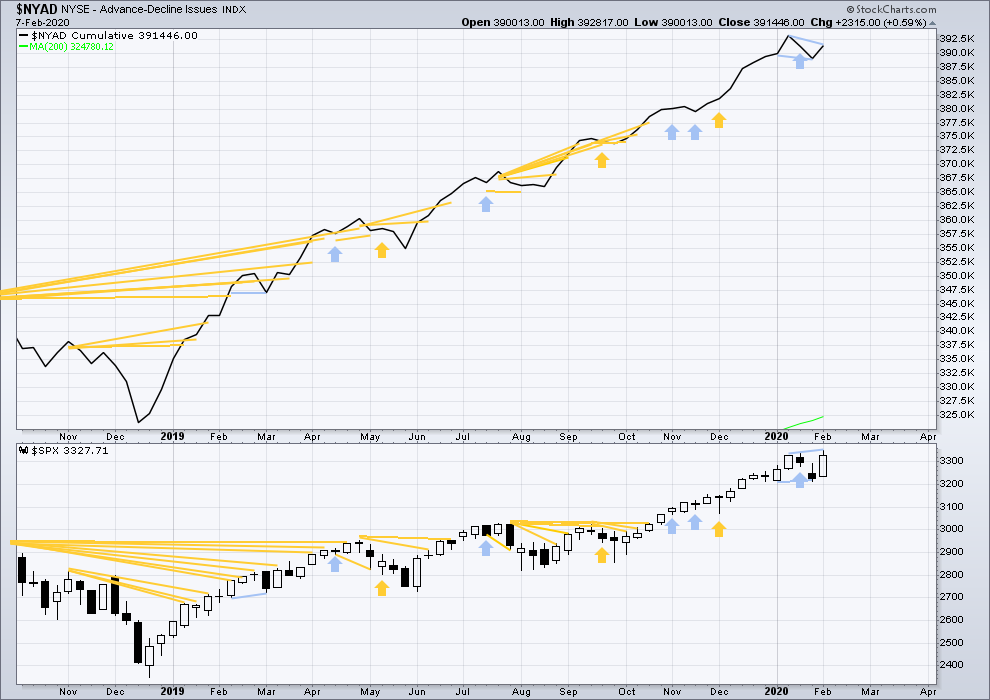
Bear markets from the Great Depression and onwards have been preceded by an average minimum of 4 months divergence between price and the AD line with only two exceptions in 1946 and 1976. With the AD line making new all time highs last week, the end of this bull market and the start of a new bear market is very likely a minimum of 4 months away, which is mid May 2020.
In all bear markets in the last 90 years there is some positive correlation (0.6022) between the length of bearish divergence and the depth of the following bear market. No to little divergence is correlated with more shallow bear markets. Longer divergence is correlated with deeper bear markets.
If a bear market does develop here, it comes after no bearish divergence. It would therefore more likely be shallow.
This week price has made a new high, but the AD line has not. There is now short-term bearish divergence that supports the main Elliott wave count.
Large caps all time high: 3,337.96 on 6th February 2020.
Mid caps all time high: 2,106.30 on 17th January 2020.
Small caps all time high: 1,100.58 on 27th August 2018.
For the short term, there is a little weakness now in only large caps making most recent new all time highs.
DAILY CHART
Click chart to enlarge. Chart courtesy of StockCharts.com. So that colour blind members are included, bearish signals
will be noted with blue and bullish signals with yellow.
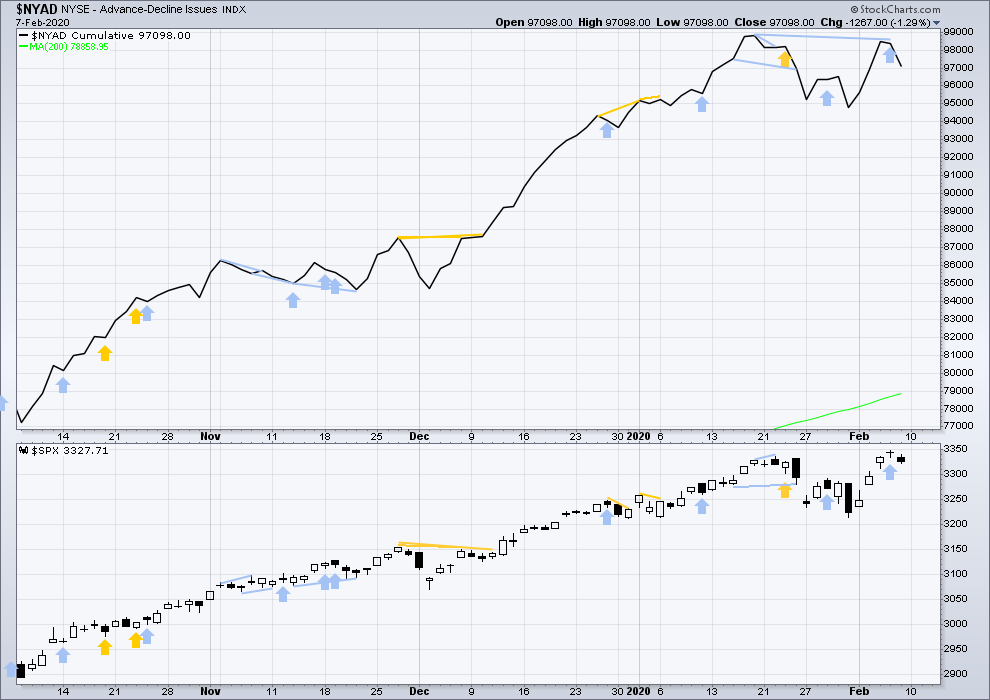
Breadth should be read as a leading indicator.
Bearish divergence noted in last analysis has now been followed by a downwards day. Short-term bearish divergence remains.
VOLATILITY – INVERTED VIX CHART
WEEKLY CHART
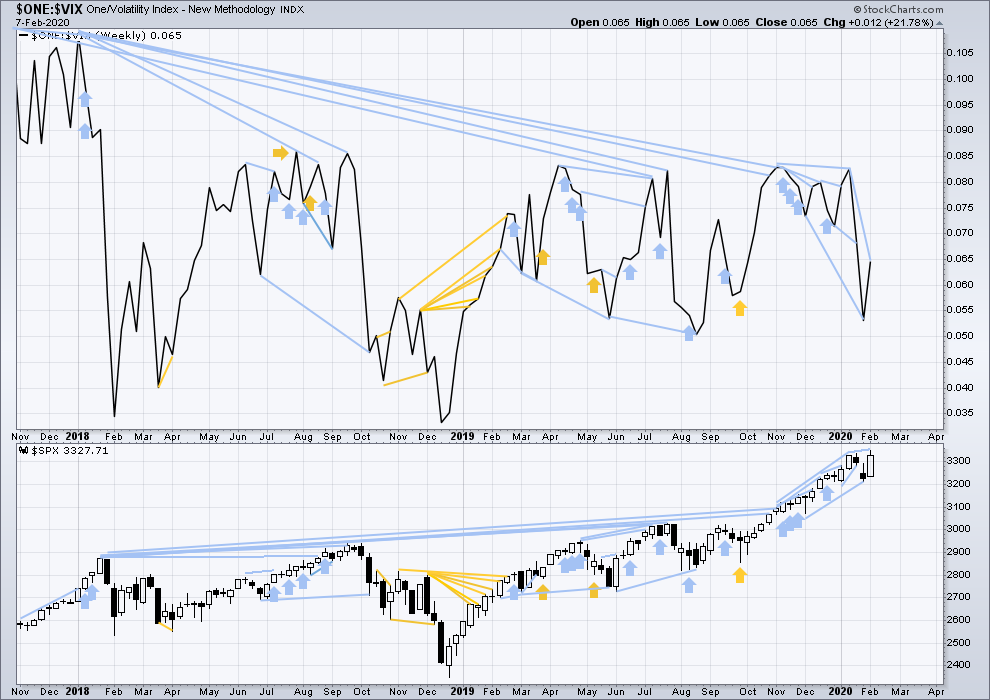
Click chart to enlarge. Chart courtesy of StockCharts.com. So that colour blind members are included, bearish signals
will be noted with blue and bullish signals with yellow.
The all time high for inverted VIX was on 30th October 2017. There is now over two years of bearish divergence between price and inverted VIX.
The rise in price is not coming with a normal corresponding decline in VIX; VIX remains elevated. This long-term divergence is bearish and may yet develop further as the bull market matures.
This divergence may be an early warning, a part of the process of a top developing that may take years. It is clearly not useful in timing a trend change from bull to a fully fledged bear market.
Price has moved higher and made a new high, but inverted VIX has not. There is again short, mid and long-term bearish divergence. This supports the main Elliott wave count.
DAILY CHART
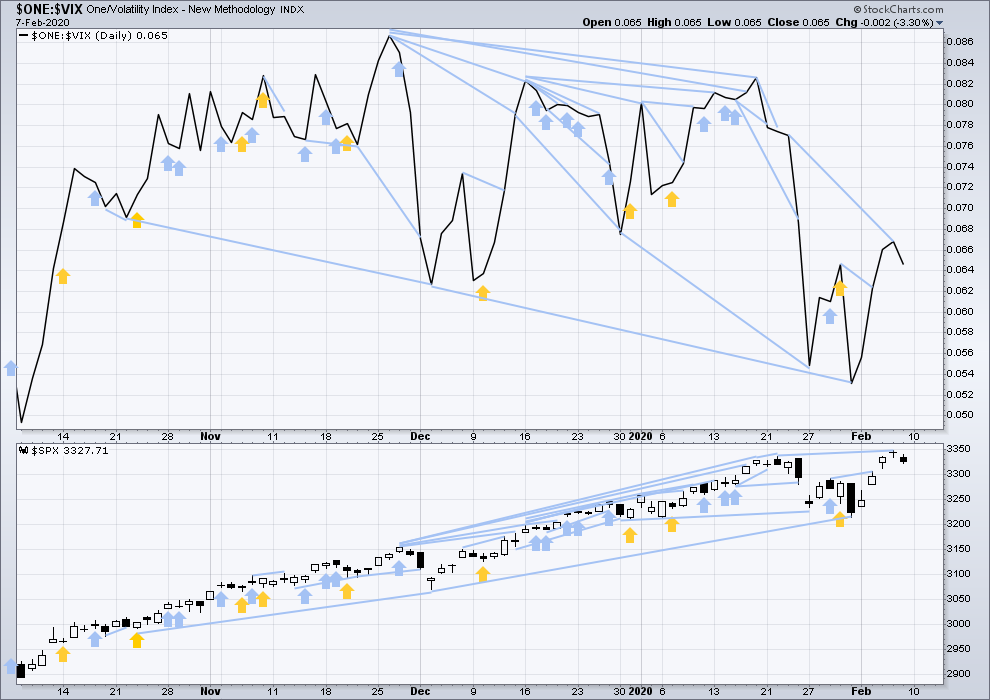
Click chart to enlarge. Chart courtesy of StockCharts.com. So that colour blind members are included, bearish signals
will be noted with blue and bullish signals with yellow.
Both price and inverted VIX have moved lower on Friday. There is no new short-term divergence.
DOW THEORY
Dow Theory confirmed a bear market in December 2018. This does not necessarily mean a bear market at Grand Super Cycle degree though; Dow Theory makes no comment on Elliott wave counts. On the 25th of August 2015 Dow Theory also confirmed a bear market. The Elliott wave count sees that as part of cycle wave II. After Dow Theory confirmation of a bear market in August 2015, price went on to make new all time highs and the bull market continued.
DJIA: 23,344.52 – a close on the 19th of December at 23,284.97 confirms a bear market.
DJT: 9,806.79 – price has closed below this point on the 13th of December.
S&P500: 2,532.69 – a close on the 19th of December at 2,506.96 provides support to a bear market conclusion.
Nasdaq: 6,630.67 – a close on the 19th of December at 6,618.86 provides support to a bear market conclusion.
With all the indices having moved higher following a Dow Theory bear market confirmation, Dow Theory would confirm a bull market if the following highs are made:
DJIA: 26,951.81 – a close above this point has been made on the 3rd of July 2019.
DJT: 11,623.58 – to date DJT has failed to confirm an ongoing bull market.
S&P500: 2,940.91 – a close above this point was made on the 29th of April 2019.
Nasdaq: 8,133.30 – a close above this point was made on the 26th of April 2019.
Published @ 05:07 a.m. EST on February 8, 2020.
—
Careful risk management protects your trading account(s).
Follow my two Golden Rules:
1. Always trade with stops.
2. Risk only 1-5% of equity on any one trade.
—
New updates to this analysis are in bold.


Note that the primary count for oil has it going up now, and for gold, going down now. Both of which are consistent with equities moving up in concert with those price movements (at least re: recent relationships between these markets).
Looks like we need a small five up for an A= symmetry….
A = C…
Nice job of running short term stops.
Let’s see how tomorrow develops….
Hi Verne,
Which A and C do you refer to? Do you refer to the main count minute A and C waves? Or something else?
So are we still in wave B then and C didn’t start yet? As otherwise, main count is invalidated with subminuette ii going above subminuette i start.
NDX’s action is not supportive of the main. A “contrary indicator” I would say. Doesn’t mean all US equities don’t tank later this week consistent with the main. Only that right now, I find it hard to view SPX in a continuing correction when NDX pretty clearly is not.
Hourly chart updated:
Minuette (ii) may need a small subminuette c up to complete it
Thanks, Lara. And invalidation of the main count would be if ATH is broken?
technically youde be looking at wave 2 moving beyond the starting point of wave 1 so you are correct. however the confusion on my end revolves the fact that B wave may not be over and can technically move beyond the start of A. anyone,
please correct my ineptitude.
It already did move beyond wave A. So as you said either we are still in wave B or the main count is invalidated. It is confusing, I agree.
Just looking at the main count again we could mark wave B’s minuette a at 3347.96 on Feb 6th, then minuette b ending at 3317.77 today and now we are in minuette c (could go on for some time for more ATHs), but it could still be minute wave. Lara – can it be correct or the main count is definitely invalidated?
Sadly, minute b could continue a little higher and the main count would remain valid
that’s why I haven’t put an invalidation point at the last ATH
Opening “stink bid” on Wednesdy Feb 12 SPY 334 strike puts for 1.00 even…1/2 position….
C’mon guys…fill on ONE lousy contract??! Misers! 🙂
Hi Lara
Is this count still valid?
Thank You
well, i have to short this move… good luck
this is what I am trading
GUSH 17 strike Feb 21 strike calls for 1.35. 10 contracts….
Interesting, calls on a 3x etf … I have UCO calls for feb 28
A bit risky. They are going to flush out the early birds…!
Selling Feb 19 VIX 12.50 X 14.50 bull call spread for 0.40 …
Reloading DIA Feb 28 297.50 strike puts for7.03…upward correction now longer in time than prior downward wave…hard stop on close above 292.81…
g’luck.
obviously not yet any follow through on Friday’s action to give C down confirming indications. Quite the contrary so far, SPX action indicating the alternate is in play, and NDX pushing up to new ATH’s again. On the other hand, all the action is on the tepid side. But SPX daily and hourly look generally bullish to me at the moment.
are you holding past the close, Peter?
Advance block pattern, something new to learn about ….
Funny, because I immediately had to look it up too. The rules I found say:
– The price action has displayed an upward trend or a significant bounce within a downtrend.
– Three white candles appear that have progressively shorter real bodies.
– The open of the second and third candles lie within the real body of the previous candles respectively.
– The upper shadows of the three candles gradually become taller—especially the shadow of the last candle.
I don’t see the 2nd and 3rd candles lying in the bodies of the prior, however, due to the gap openings.
It does appear that the slowing Chinese manufacturing impacting world-wide manufacturing could certainly drive a sell off next week.
Some investment establishments were shorting the market into close as they think manufacturing industry might not open next week. I suspect it will not be the narrative coming from China.
I’m using the description in Nison:
“If the last two candles are long white ones that make a new high followed by a small white candle, it is called a stalled pattern (see Exhibit 6.30). It is also sometimes called a deliberation pattern. The bulls’ strength has been at least temporarily exhausted after this formation. This last small white candle can either gap away from the long white body (in which case it becomes a star) or it can be, as the Japanese express it, “riding on the shoulder” of the long white real body (that is, be at the upper end of the prior long white real body). The small real body discloses a deterioration of the bulls’ power.”
-Nison, Steve. Japanese Candlestick Charting Techniques (p. 99).
and:
“There is not much difference between the advance block and stalled pattern. The main factor to consider with three white soldiers is that it is most constructive for each of the three candles to close at or near its highs. If the latter two white candles show signs of hesitation, either with small real bodies or upper shadows, then it is a clue that the rally is losing force.”
-Nison, Steve. Japanese Candlestick Charting Techniques (p. 100).
Looking at the diagrams and examples he uses, this pattern doesn’t have to come at the end of a rise.
However, the candlesticks in this case are rather small, and so it is a wee bit of a stretch possibly to label it and Advance Block. The important bit, and the reason why I chose to label it as such, is the smaller real body in the last candlestick.
I know this description differs from others. I have decided some time ago that with the conflicting descriptions that I will rely only on Nison. Because he is the original introduction of candlesticks to the west.
Others will differ. And IMO that’s okay.
Nice Satutday Morning read! Looking forward to next week as China update on manufacturing resuming comes out starting Monday.
Rishi, I really appreciate the article link you posted yesterday about the government of China seeking to kill over 20,000 of its citizens. How shocking! Things must be way worse than they are letting on.
A false internet meme. The Chinese gov’t isn’t going to intentionally kill their own people. Killing 20,000 wouldn’t do a darn thing to halt the spread of CV. Even killing a million wouldn’t slow it down much if at all. While the Chinese gov’t can be inept through it’s own authoritarianism, they are not blindly ignorant, irrational and murderous for no valid reason, and murdering their own citizens would be vastly destabilizing for those in power.
Ummmm… I spent 10 years reading everything I could get my hands on about China after WWII. Autobiographies, biographies and text books.
There is plenty of evidence that the CCP have, can and will indefinitely without trial incarcerate citizens, and kill them.
And as for irrational, take a look at what happened in the Chinese Cultural Revolution, and before that, the Great Leap Forward.
Jasper Beckett’s “Hungry Ghosts” for the Great Leap Forward was a pretty solid text, as one example.
With possibly a million Uighurs in camps currently on the pretext of terrorism, it does not look like the CCP has lost the old tendencies.
I really do apologise to any members from China if this comment offends you. It has come from a place of learning and is not anti China. I read about China because it’s fascinating, and I wanted to know it better before visiting. I also learned about a culture rich in history, inventions and a huge value on family.
Absolutely! Anyone who contends that the CCP would/has not killed Chinese citizens extra-judicially does not understand that system….
The ability and willingness of powerful governments to terminate their own citizens isn’t the question here, nor the history of different gov’ts in doing exactly that. The question is what goal would be served by doing so, and at what cost, and based on that, what’s the likelihood of this having any credence? My thesis is that there is no goal that would be served: you can’t stop a flu virus from spreading by killing people, period. This meme is dead on arrival. Add to that (though not necessary) the political risk and cost of killing people to try to control something as low risk as the flu (only 2-3% of the people who get this die; it’s “just the flu”). An ineffective (almost absurd) solution that destabilizes the government. No.
Will the Chinese gov’t happily kill lots of people again someday? Oh yea…when their power is threatened (and China is nowhere unique in this regard).
This is just another bogus internet meme. In my opinion.
Kevin. Your statement was that the Chinese government was not going to intentionally kill its own people, and that assertion is what both Lara and I are contending is not accurate. I understand your clarification. It assumes autocratic decisions are always driven by sound logic. I am not certain that is true.
The aim of autocrats is always to retain power and control…by any means ncessary, logical or otherwise…
Coronavirus may be considered a loss of face for China in the global community, and so I can imagine the CCP doing everything in its power to possibly contain it. And what they choose to do may be driven more by emotion and power, and not logic.
The Great Leap Forward and Cultural Revolution were highly illogical. Some of the things they did in the GLF especially, like close planting for example, defied all science and logic. It failed spectacularly, but they persevered.
Here’s another thought though. Given their past behaviour, it’s possible that the CCP could be lying to us and underreporting numbers of infected and dead.
But then there is the tendency of viruses as an epidemic matures to become less virulent. The death rate may fall, and it may become just like the annual flu epidemics which no one closes borders for.
It’s hard to know whats happening with those in charge not being fully honest and transparent.
I sincerely hope they are not doing this or anything along these lines.
Things are definately worse than the official news. I recently saw pictures from South Asia major airports and they are deserted. If someone tells me there is no impact on travel, I wonder why the cover up. Travel companies are delaying the reflection of this in ticket prices so far.
I expect market heading towards 3387plus on positive news from China on manufacturing next week.
One more time:
250,000 to 500,000 DIE OF THE FLU EVERY YEAR.
So far, perhaps 1000 people have died of CV. Contrast that with the flu in the US in 2017-18: 60,000 people died! Was the news full of “epidemic”, “pandemic”, etc etc? Nope. Nada. And appropriately so.
Draw your own conclusions. Hysteria and FUD should be resisted, based on actual data, in my opinion.
Two quick things to keep in mind.
Simplistic citing of mormidity rates for flu and using that to draw conclusions about risk relative to coronavirus fails to distinguish between morbidity and lethaliy. The current outbreak is a few months old at best and the Chinese government is clearly misrepresenting the number of casualties. No government has ever quranteened an entire city of millions of people because of the flu. Transmissibility and susceptibility considerations are also in order when comparing flu and coronavirus.
Eight crematoriums in Wuhan are running 24/7. The severity of this is being down-played by too many and I don’t understand why.
Sorry about qurantine mis-spell, saw too late to ediit…. 😉
Sorry, I misspoke. The figures are for “lethality”, not “morbidity”. They are only moderately high at 2-3% of those infected.
I mean, this hysteria could be just that. Mass public hysteria and panic, not supported by facts.
People do tend to do that, from time to time.
It could also be based upon some reality as we may not be getting a fully honest and transparent report from those in charge.
And for all of us here there is really no way to know which situation is true.
The enormity of what is occurring in China, and the way some (primarily the CCP)are attempting to down-play it is imho quite startling…this is NOT like the flu, as will swiftly become more apparent…
The flu in the 2017-2018 season in the US killed about 60,000. It was a bad flu season. Just to put this in perspective.
But if factories in China are idle despite high demand, that’s obviously very serious to the world economy and the market will price that in. It appears that perhaps events are unfolding as required to fulfill the C of minor 4 in a big way. Always funny how that happens.
Preparing……..
Kevin,
I agree – as we discussed last month or so ago – some news came out that confirmed the wave count from Lara at that time. As I was new to this service then I was very surprised at timing of those news and I also mentioned that time to you that it feels like the market drives the news and not the other way. Same is happening now with market wave count driving the news. And now I’m not surprised anymore. it becomes a reality to me now. I’m now more and more inclined to the fact that there are forces that will move this market in the right way no matter what. If it wouldn’t be coronovirus, it would be something else right at that time. Otherwise, how can we explain rally to ATH last week after the news of cornovirus were in place the week before that and it was presumably discounted. Then all of a sudden, market decided to ignore those news and now at the end of last week and possibly this week we are back to coronovirus story again. Why? Because we are most probably still in wave 4C and it needs to be completed. No matter how crazy it might sound.
Yes, news often arrives to fulfill the count.
And…often the count is uncertain. In fact it’s ALWAYS uncertain, just sometimes more so (clear alternates with significant probability) and sometimes less so (no alternates).
And it is uncertain right now. I will not be overly surprised to see the alternate play out here. The bullish trend is very strong at the monthly and weekly time frames.
I do NOT view the future as in any way foreordained, by wave counts or anything. Something “random” that happens today will affect the market in a way that would not have happened had the random event not happened. I truly view the EW counts a simply potential “roadmaps” of more or less likely price action, but what path is followed is non-deterministic.
Perhaps you have seen this but alarm bells are getting louder…
https://apple.news/ANiKOsiOLTz6yd6RyR91o2Q
https://apple.news/As1iX_qrXSEeWlMUQKtPfjw
Forced quarantine