
A little more upwards movement was expected for the short term, which is exactly what has happened.
Today members have two Elliott wave counts, with the main wave count having more support from classic technical analysis.
Summary: A pullback or consolidation is underway. It may continue now through to the end of this week and possibly a little longer. Support is expected to be about 3,153; but if this expectation is wrong, it may be too low.
For the short term, now the final downwards swing within a consolidation may begin tomorrow. The target for support is at 3,213.
Three large pullbacks or consolidations (fourth waves) during the next 1-2 years are expected: for minor wave 4 (underway), then intermediate (4), and then primary 4.
The biggest picture, Grand Super Cycle analysis, is here.
Last monthly charts analysis is here with video here.
ELLIOTT WAVE COUNTS
FIRST WAVE COUNT
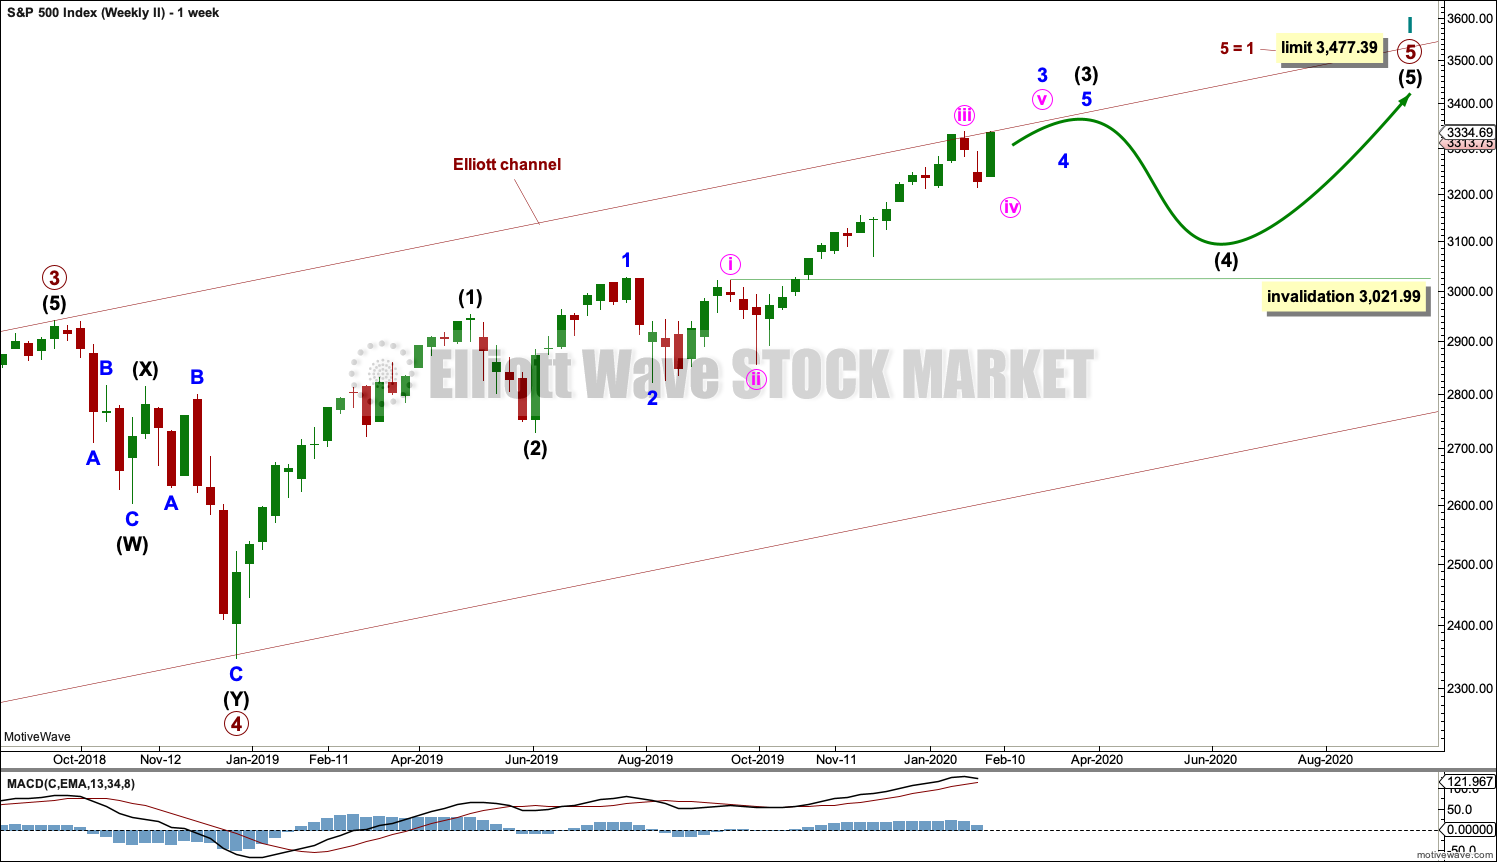
WEEKLY CHART
Click chart to enlarge.
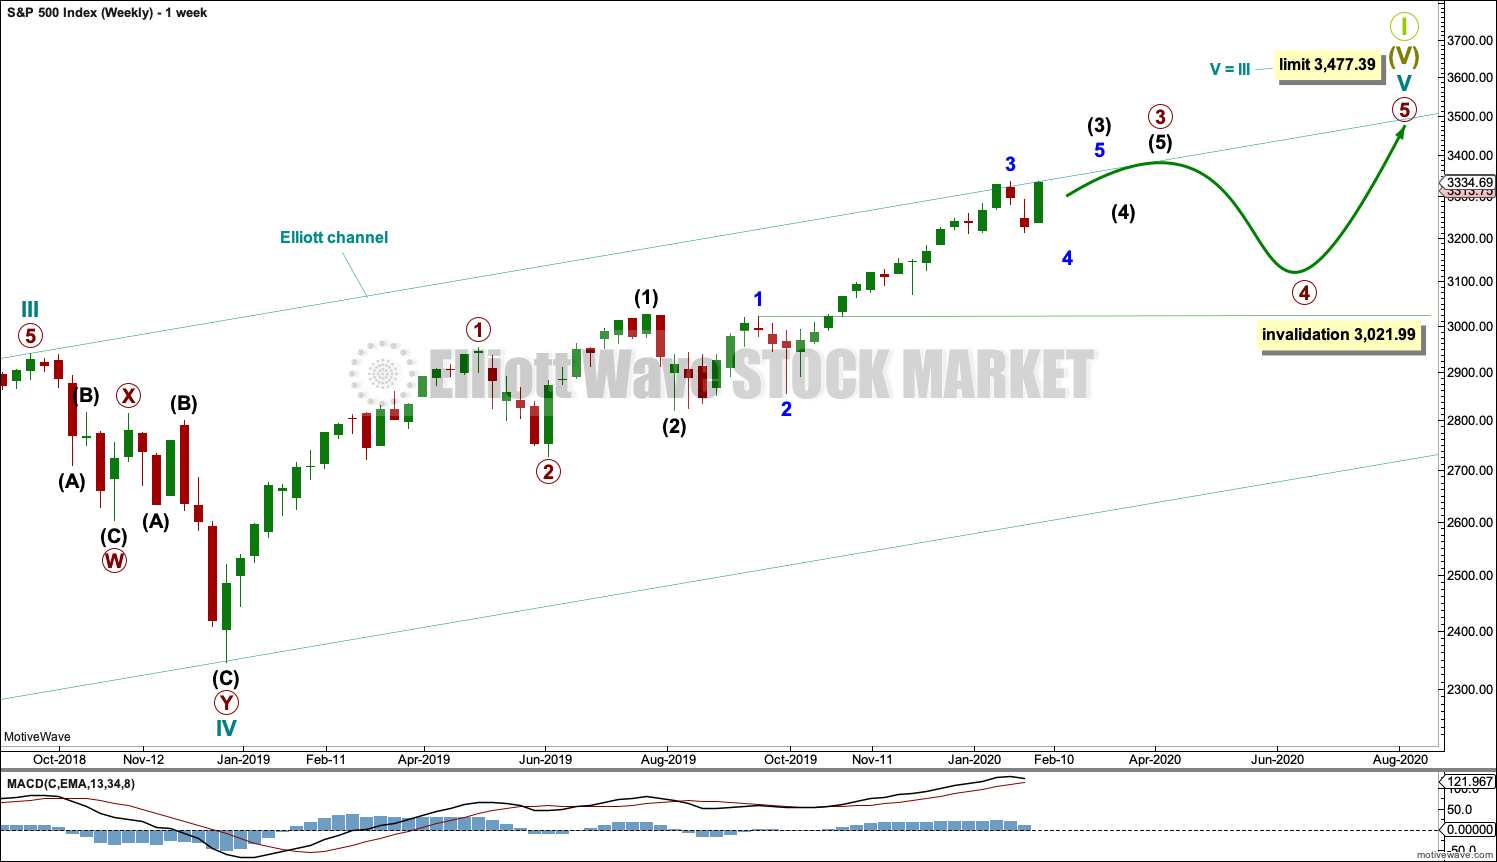
Cycle wave V may subdivide either as an impulse or an ending diagonal. Impulses are much more common, and it is clear at this stage that cycle wave V is an impulse and not a diagonal.
At this stage, cycle wave V may take another one to two or so years to complete.
A channel is drawn about the impulse of Super Cycle wave (V) using Elliott’s first technique. Draw this channel first from the high of 2,079.46 on the 5th of December 2014 to the high of 2,940.91 on the 21st of September 2018, then place a parallel copy on the low at 1,810.10 on the 11th of February 2016. Cycle wave IV found support about the lower edge.
Within Super Cycle wave (V), cycle wave III may not be the shortest actionary wave. Because cycle wave III is shorter than cycle wave I, this limits cycle wave V to no longer than equality in length with cycle wave III at 3,477.39. A new high by any amount at any time frame above this point would invalidate this main wave count in favour of one of the two alternate wave counts in the monthly chart analysis which are much more bullish.
The daily chart below will focus on movement from the end of minor wave 1 within intermediate wave (3).
Within cycle wave V, primary waves 1 and 2 may be complete. Within primary wave 3, intermediate waves (1) and (2) may be complete. Within intermediate wave (3), minor wave 4 may not move into minor wave 1 price territory below 3,021.99.
Within cycle wave V, the corrections of primary wave 2, intermediate wave (2) and minor wave 2 all show up clearly on the weekly chart. For cycle wave V to have the right look, the corresponding corrections of minor wave 4, intermediate wave (4) and primary wave 4 should also show up on the weekly chart. Three more large multi-week corrections are needed as cycle wave V continues higher, and for this wave count the whole structure must complete at or before 3,477.39.
DAILY CHART
Click chart to enlarge.
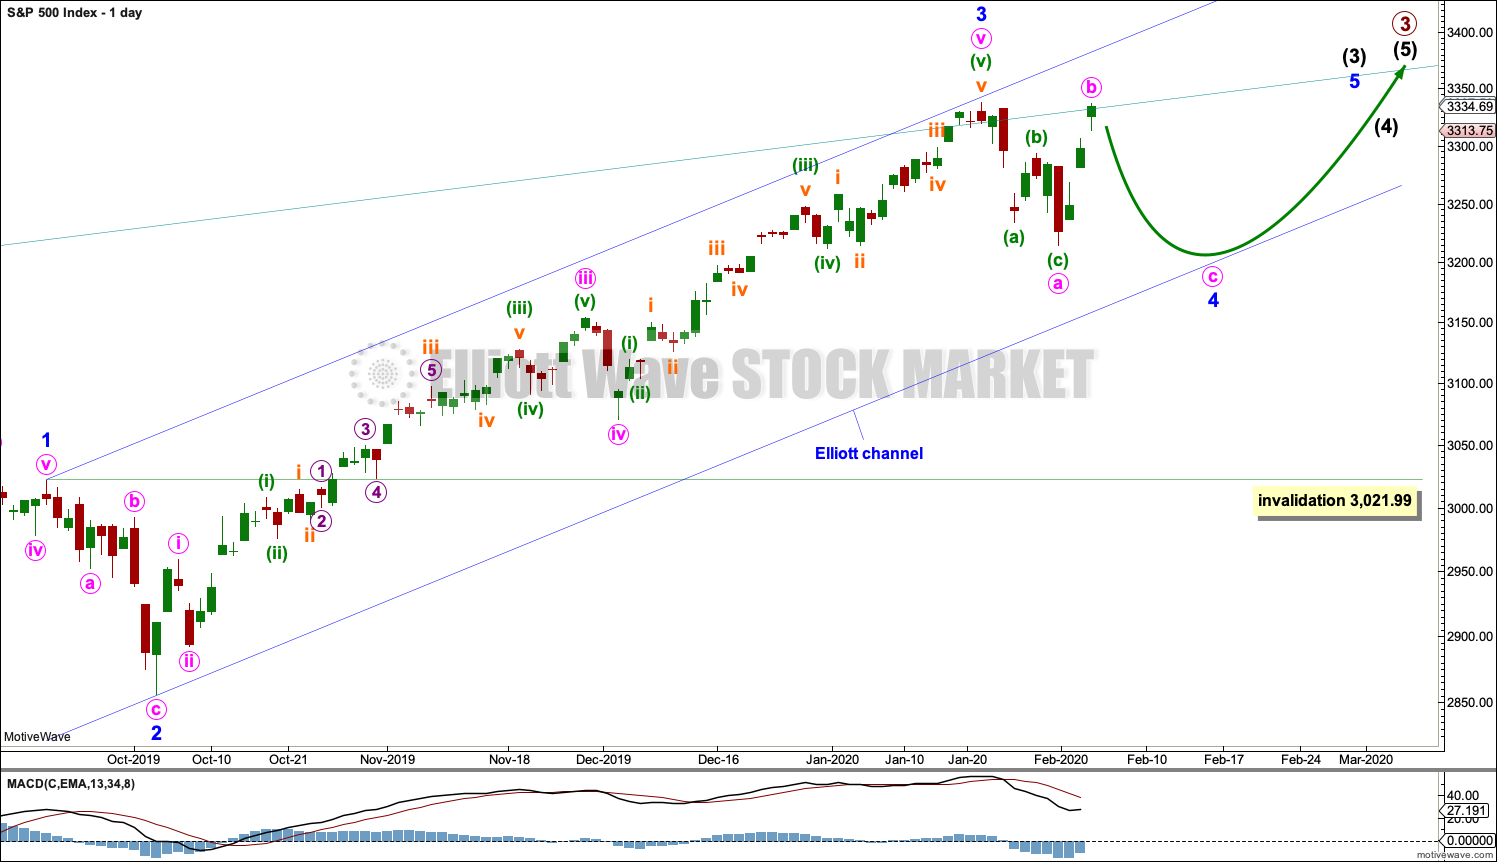
All of primary wave 3, intermediate wave (3) and minor wave 3 may only subdivide as impulses.
Minor wave 3 now looks complete.
Minor wave 2 was a sharp deep pullback, so minor wave 4 may be expected to be a very shallow sideways consolidation to exhibit alternation. Minor wave 2 lasted 2 weeks. Minor wave 4 may be about the same duration, or it may be a longer lasting consolidation. Minor wave 4 may end within the price territory of the fourth wave of one lesser degree; minute wave iv has its range from 3,154.26 to 3,070.49. However, this target zone at this stage looks to be too low.
Minor wave 4 may not move into minor wave 1 price territory below 3,021.99.
When minor wave 4 may be complete, then a target will again be calculated for intermediate wave (3).
When intermediate waves (3) and (4) may be complete, then a target will again be calculated for primary wave 3.
Draw an Elliott channel about intermediate wave (3): draw the first trend line from the end of minor wave 1 to the end of minor wave 3, then place a parallel copy on the end of minor wave 2. Minor wave 4 may find support at the lower edge of this channel if it is long lasting or deep enough. It is possible that minor wave 4 may breach the lower edge of the channel as fourth waves are not always contained within a channel drawn using this technique. If minor wave 4 breaches the channel, then it shall need to be redrawn using Elliott’s second technique.
Price has recently reached just above the upper edge of the wide teal channel copied over from monthly and weekly charts. A reaction downwards here increases the technical significance of this trend line.
Minor wave 4 may subdivide as any corrective structure, most likely a flat, triangle or combination. Within all of a flat, triangle or combination, there should be an upwards wave which may be fairly deep. That may now be complete.
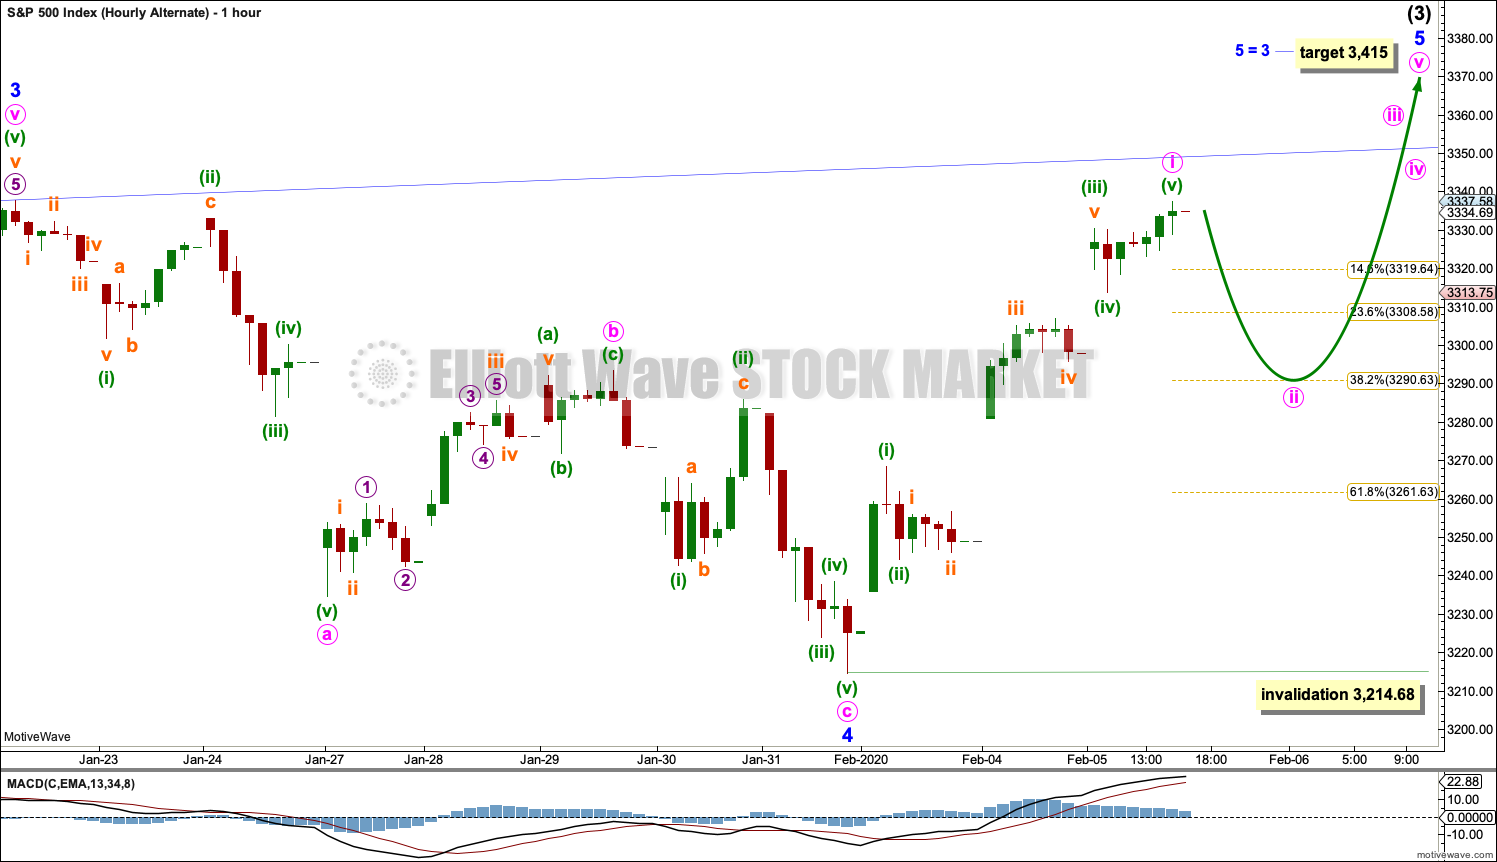
HOURLY CHART
Click chart to enlarge.
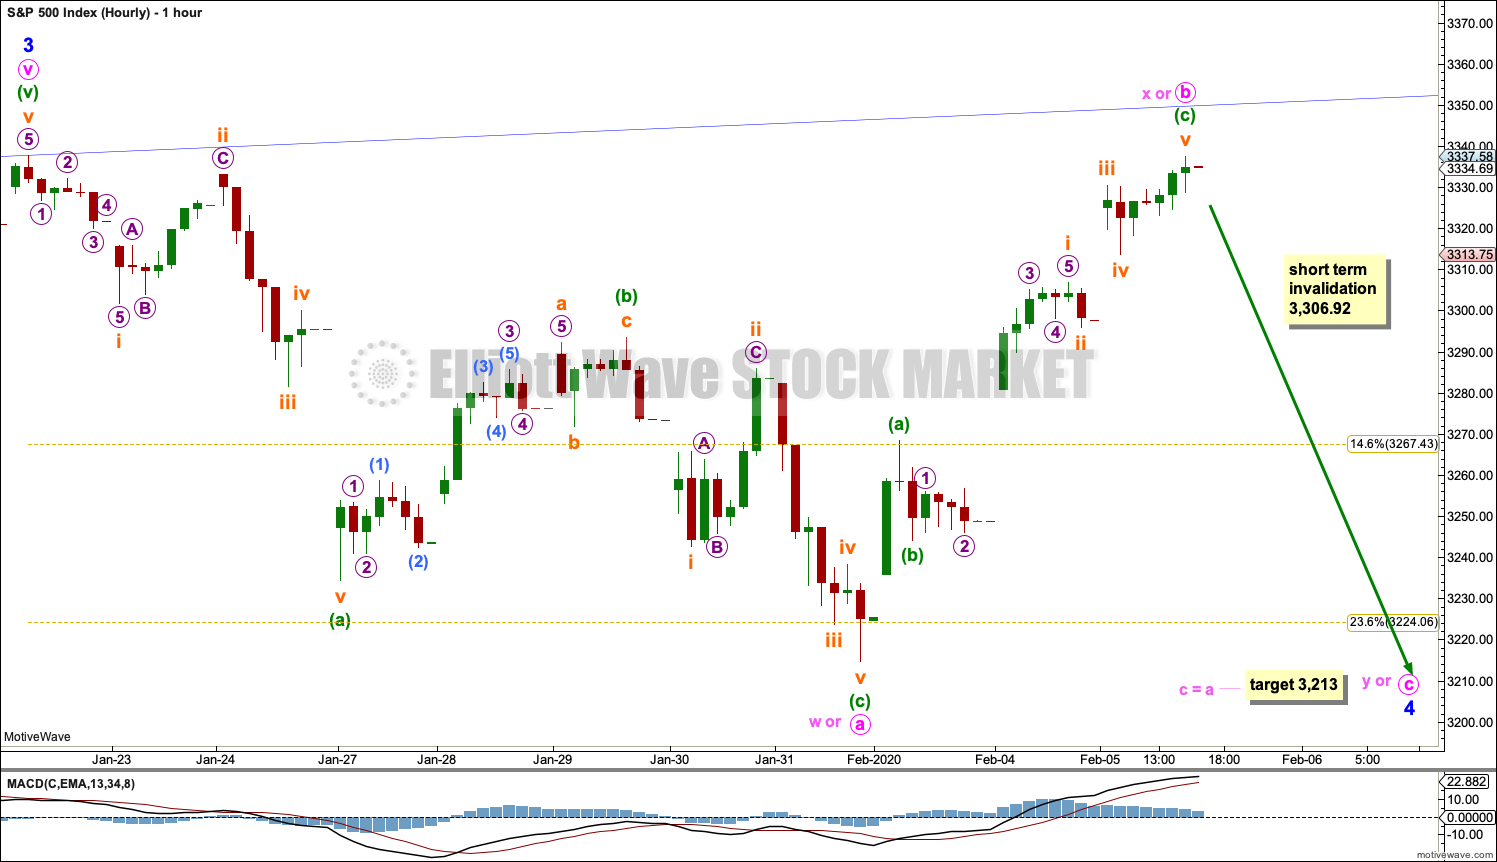
Minor wave 4 is here labelled a possible regular flat correction, but it may still morph into one of either an expanded flat (if price continues higher tomorrow), a combination or a triangle.
If minor wave 4 unfolds as a regular flat correction, then within it minute wave c downwards may begin tomorrow. The target for minute wave c within a regular flat is for it to reach the most common Fibonacci ratio to minute wave a.
If minor wave 4 unfolds as an expanded flat, then minute wave b may extend higher tomorrow. The common range for minute wave b within an expanded flat is from 1 to 1.38 times the length of minute wave a, giving a range from 3,337.77 to 3,384.54. There is no upper invalidation point for this wave count, because there is no Elliott wave rule stating a limit for minute wave b within a flat. There is a guideline which states minute wave b would be unlikely to exceed twice the length of minute wave a at 3,460.86. Minute wave c downwards should unfold and would be very likely to move at least slightly below minute wave a at 3,214.68 to avoid a truncation.
If minor wave 4 unfolds as a triangle, then minute wave b within it may be complete, or may extend higher as in a running triangle. Minute wave c may not move beyond the end of minute wave a below 3,214.68.
If minor wave 4 unfolds as a combination, then minute wave x within it may be complete, or may extend higher. Minute wave y would need to unfold as either a flat or triangle. Minute wave y may end about the same level as minute wave w at 3,214.68, so that the structure takes up time and moves price sideways.
ALTERNATE DAILY CHART
Click chart to enlarge.
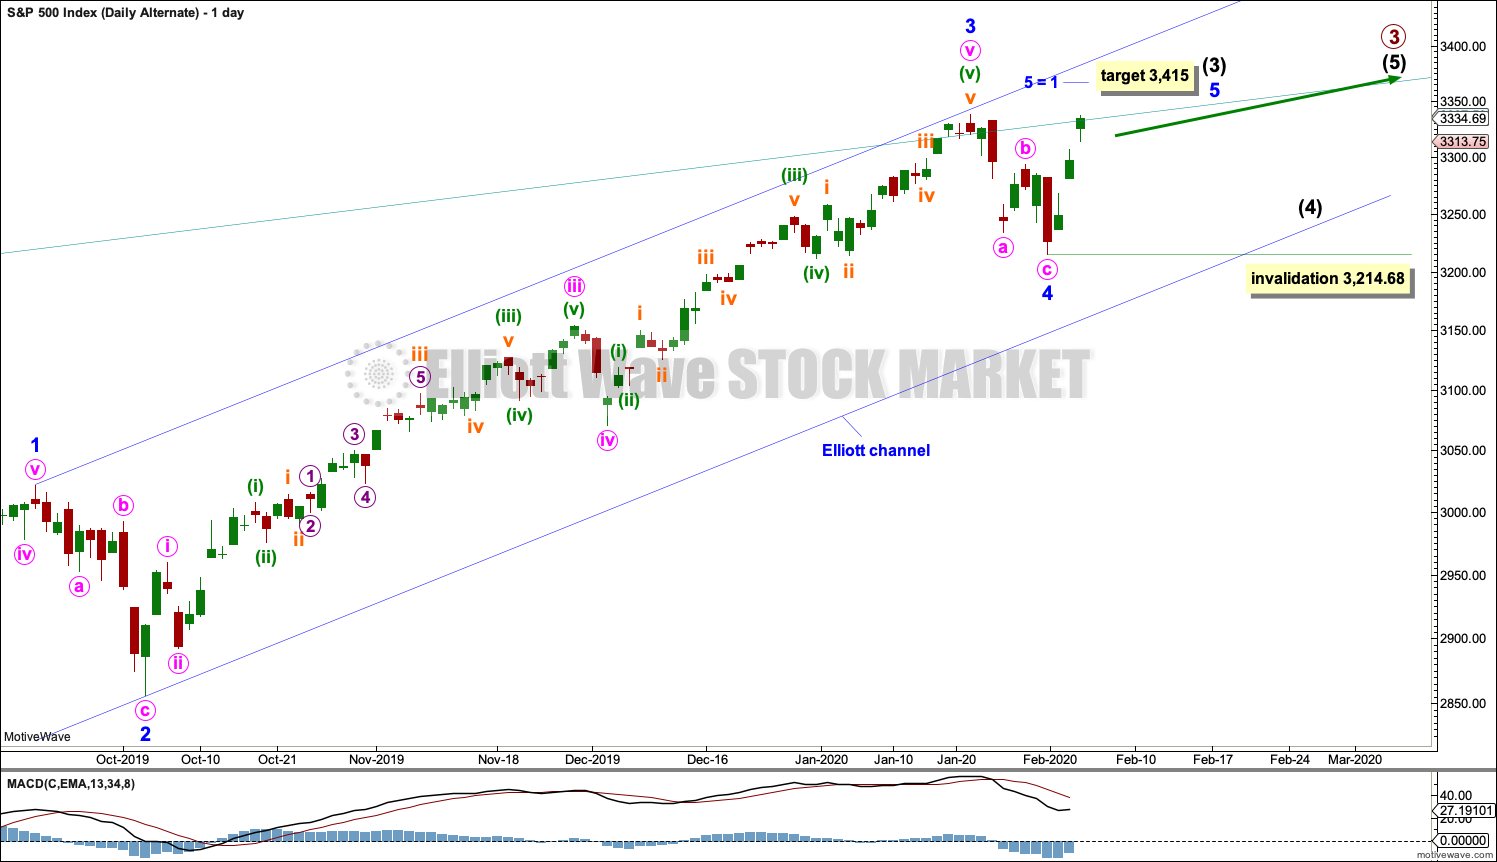
This alternate daily chart looks at the possibility that minor wave 4 may be a complete zigzag over at the last low. This alternate chart does not have as much support from classic technical analysis as the main wave count.
Minor waves 2 and 4 for this wave count both subdivide as zigzags; there is no alternation in structure. Minor wave 2 is deep at 0.83 the length of minor wave 1, and minor wave 4 is shallow at 0.26 the length of minor wave 3; there is alternation in depth. Minor wave 2 lasted 10 sessions and minor wave 4 lasted 7 sessions; the proportion is acceptable and gives the wave count the right look.
There is no adequate Fibonacci ratio between minor waves 1 and 3. This makes it more likely that minor wave 5 may exhibit a Fibonacci ratio. The target expects minor wave 5 to exhibit the most common Fibonacci ratio within an impulse.
Within minor wave 5, no second wave correction may move beyond its start below 3,214.68.
ALTERNATE HOURLY CHART
Click chart to enlarge.
It is possible to count the upwards wave off the low from 31st January as either a three or a five. This alternate wave count sees it as a five. Both possibilities must be considered.
If a five up is complete, then it may be labelled minute wave i. Minute wave ii may move lower, to end about either of the 0.382 or 0.618 Fibonacci ratios.
Minute wave ii may not move beyond the start of minute wave i below 3,214.68.
SECOND WAVE COUNT
WEEKLY CHART
Click chart to enlarge.
This second wave count sees all subdivisions from the end of the March 2009 low in almost the same way, with the sole difference being the degree of labelling.
If the degree of labelling for the entirety of this bull market is all moved down one degree, then only a first wave at cycle degree may be nearing an end.
When cycle wave I is complete, then cycle wave II should meet the technical definition of a bear market as it should retrace more than 20% of cycle wave I, but it may end about either the 0.382 or 0.618 Fibonacci Ratios of cycle wave I. Cycle wave II may end close to the low of primary wave II within cycle wave I, which is at 1,810.10. It is also possible that cycle wave II could be fairly shallow and only barely meet the definition of a bear market.
The impulse is still viewed as nearing an end; a fifth wave is still seen as needing to complete higher. This wave count labels it primary wave 5. Primary wave 5 may still need another year to two or so to complete, depending upon how time consuming the corrections within it may be.
Primary wave 5 may be subdividing as an impulse, in the same way that cycle wave V is seen for the first weekly chart.
TECHNICAL ANALYSIS
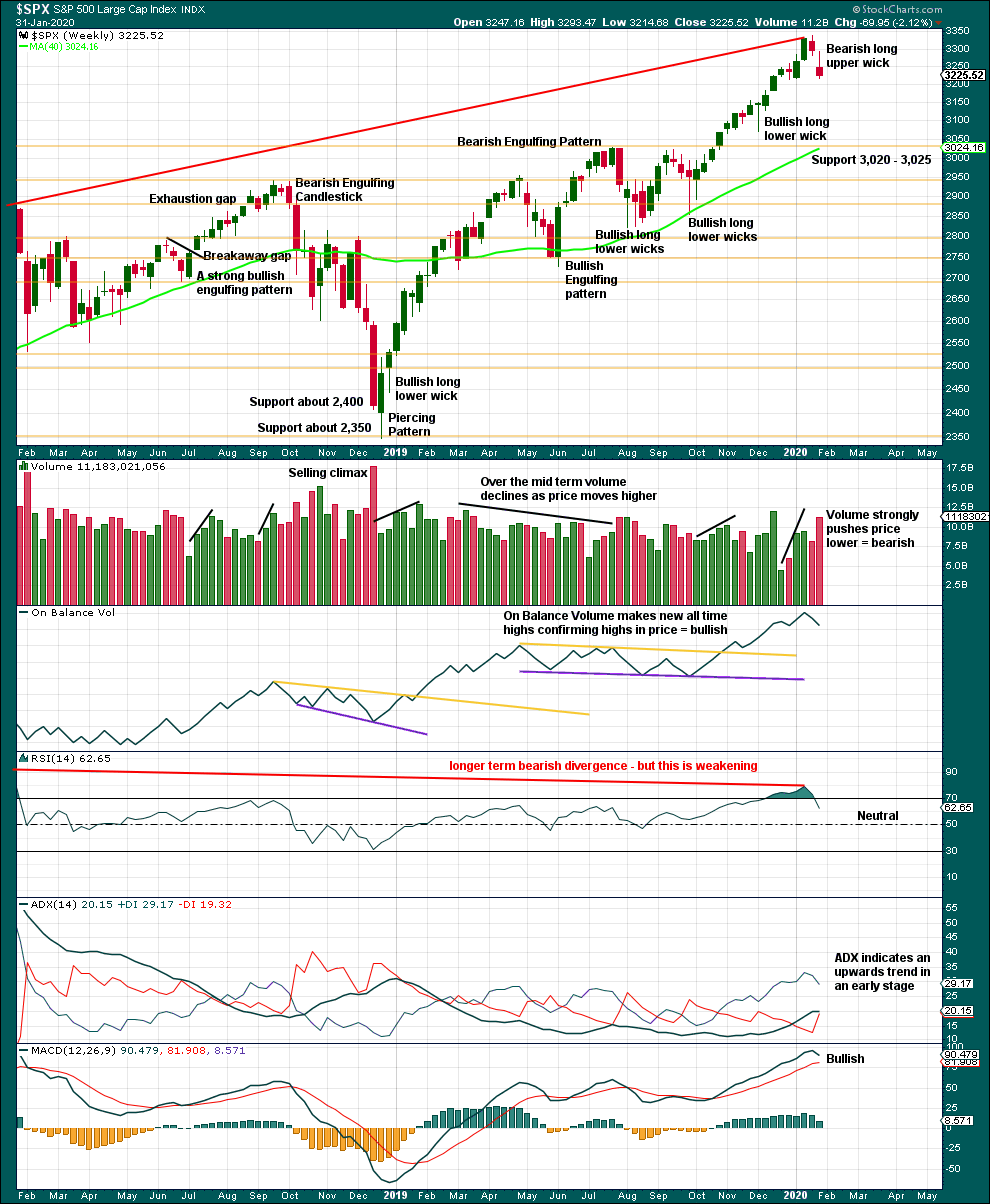
WEEKLY CHART
Click chart to enlarge. Chart courtesy of StockCharts.com.
It is very clear that the S&P is in an upwards trend and the bull market is continuing. Price does not move in straight lines; there will be pullbacks and consolidations along the way.
This chart is overall bullish. There are no signs of weakness in upwards movement.
A pullback or consolidation has begun. This is relieving extreme conditions. Look for strong support below about 3,020 to 3,025.
DAILY CHART
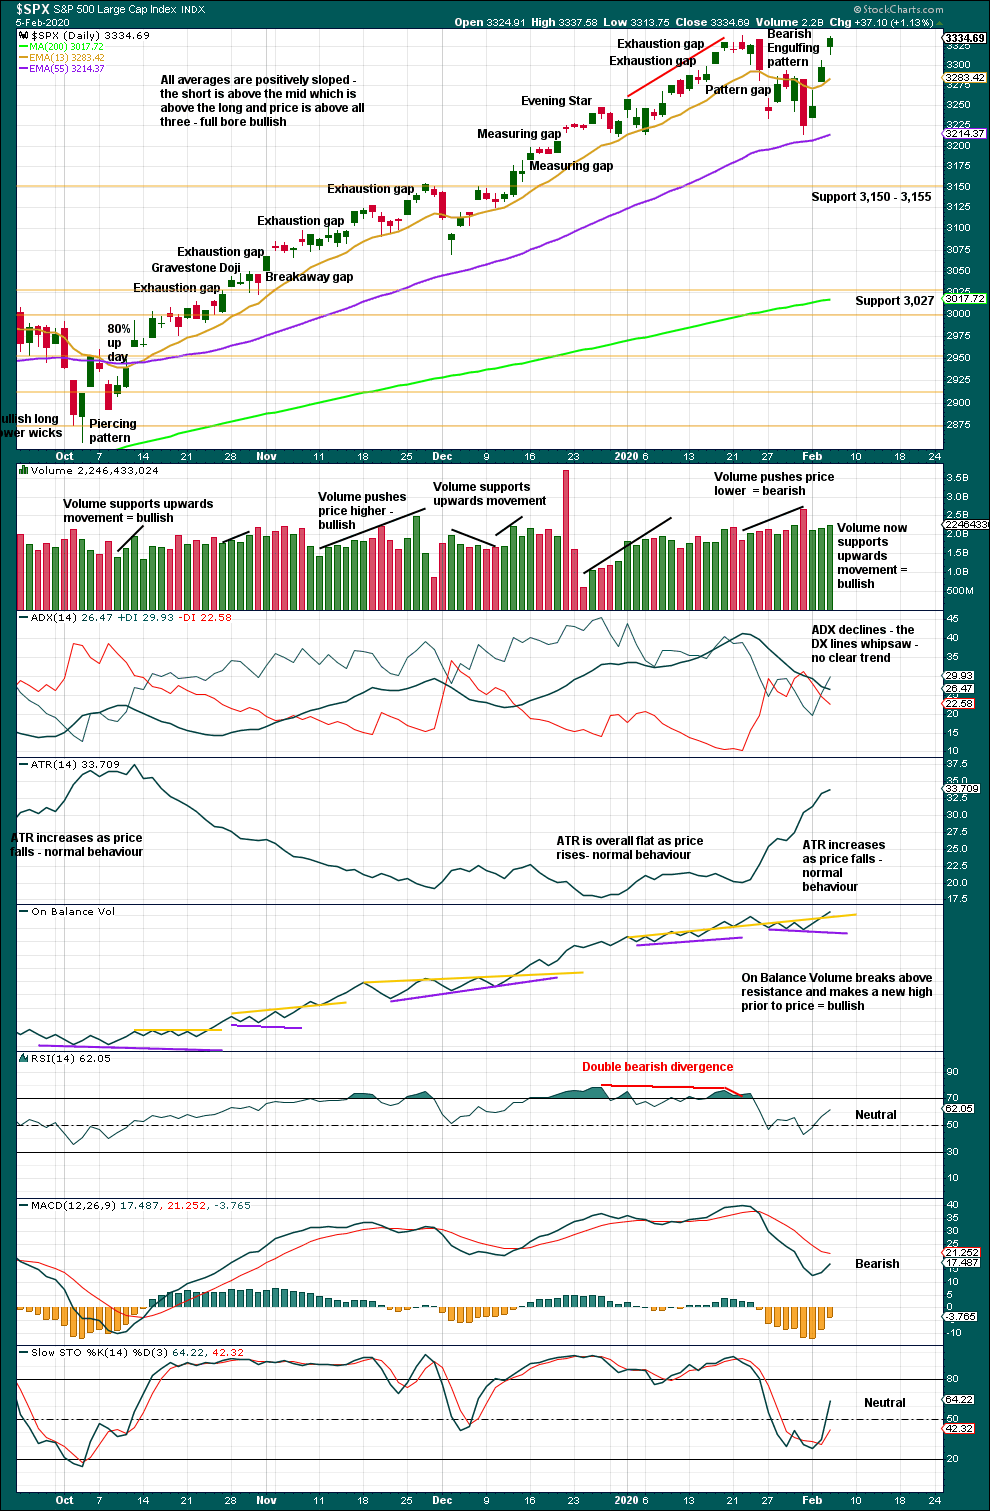
Click chart to enlarge. Chart courtesy of StockCharts.com.
The larger trend, particularly at the monthly time frame, remains up. Expect pullbacks and consolidations to be more short term in nature although they can last a few weeks.
In a bull market which may continue for months or years, pullbacks and consolidations may present opportunities for buying when price is at or near support.
Sustainable lows may be identified by a 180° reversal of sentiment in a 90% down day followed by one or more of the following things:
– Either a 90% up day or two back to back 80% up days within 3 sessions of the 90% down day.
– RSI may reach oversold and then exhibit bullish divergence.
– A strong bullish candlestick pattern with support from volume.
In the absence of bullish reversal signs, expect the pullback or consolidation to continue.
Three small range days in a row moving price higher all lack conviction. None meet the definition of an 80% or 90% upwards day. However, volume and On Balance Volume are both bullish, so the alternate Elliott wave count must be seriously considered.
BREADTH – AD LINE
WEEKLY CHART
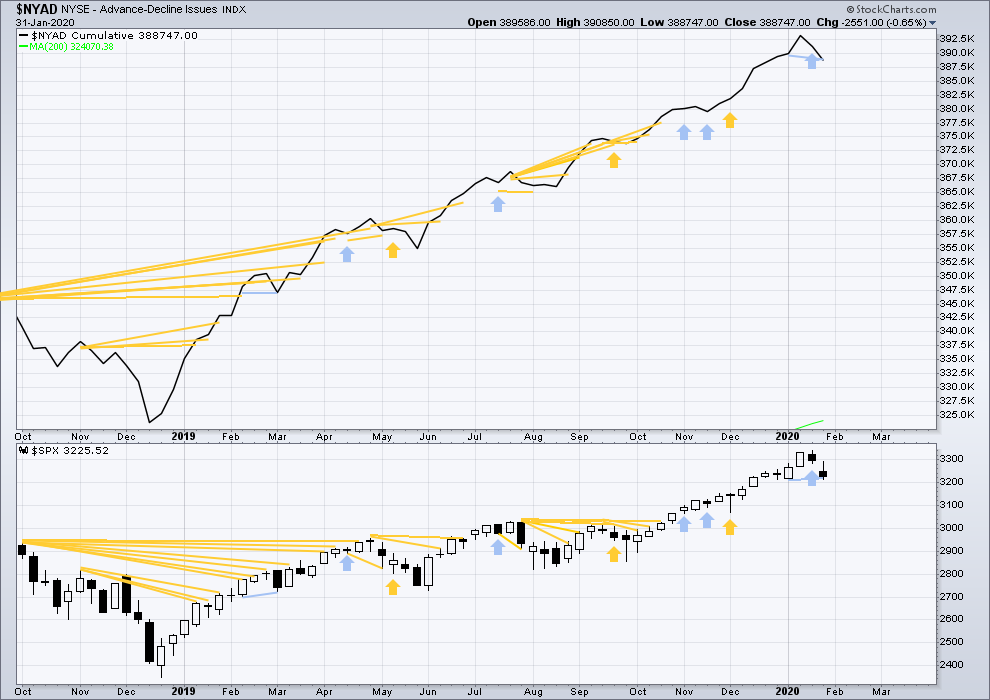
Click chart to enlarge. Chart courtesy of StockCharts.com. So that colour blind members are included, bearish signals
will be noted with blue and bullish signals with yellow.
Bear markets from the Great Depression and onwards have been preceded by an average minimum of 4 months divergence between price and the AD line with only two exceptions in 1946 and 1976. With the AD line making new all time highs last week, the end of this bull market and the start of a new bear market is very likely a minimum of 4 months away, which is mid May 2020.
In all bear markets in the last 90 years there is some positive correlation (0.6022) between the length of bearish divergence and the depth of the following bear market. No to little divergence is correlated with more shallow bear markets. Longer divergence is correlated with deeper bear markets.
If a bear market does develop here, it comes after no bearish divergence. It would therefore more likely be shallow.
Last week both price and the AD line have moved lower. Downwards movement has support from declining market breadth. The AD line has made a slight new low below the short-term low three weeks prior, but price has not but only by 0.04 points. This divergence is bearish, but it is very weak. The important point to note is that it is not bullish.
Large caps all time high: 3,337.77 on 22nd January 2020.
Mid caps all time high: 2,106.30 on 17th January 2020.
Small caps all time high: 1,100.58 on 27th August 2018.
For the short term, there is a little weakness now in only large caps making most recent new all time highs.
DAILY CHART
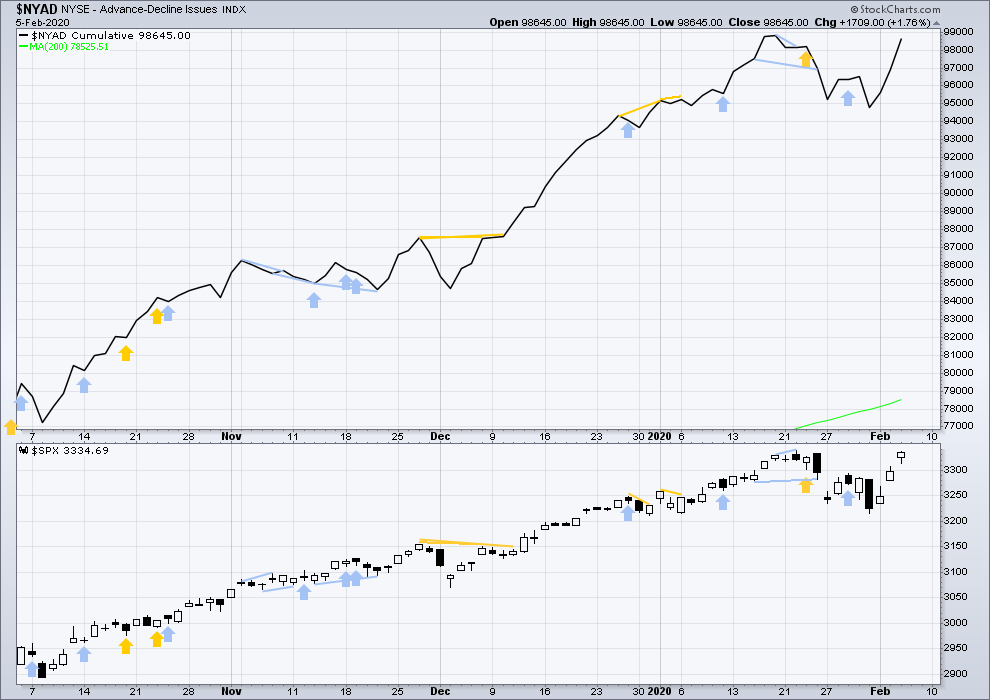
Click chart to enlarge. Chart courtesy of StockCharts.com. So that colour blind members are included, bearish signals
will be noted with blue and bullish signals with yellow.
Breadth should be read as a leading indicator.
Upwards movement for Wednesday has a corresponding rise in the AD line. There is no new divergence.
VOLATILITY – INVERTED VIX CHART
WEEKLY CHART
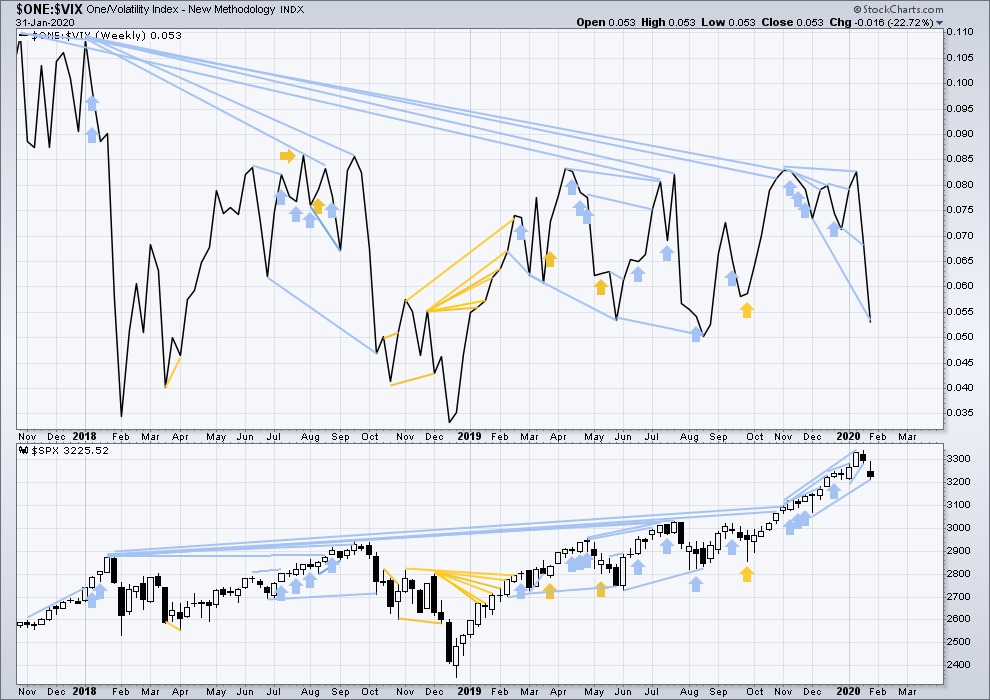
Click chart to enlarge. Chart courtesy of StockCharts.com. So that colour blind members are included, bearish signals
will be noted with blue and bullish signals with yellow.
The all time high for inverted VIX was on 30th October 2017. There is now over two years of bearish divergence between price and inverted VIX.
The rise in price is not coming with a normal corresponding decline in VIX; VIX remains elevated. This long-term divergence is bearish and may yet develop further as the bull market matures.
This divergence may be an early warning, a part of the process of a top developing that may take years. It may is clearly not useful in timing a trend change from bull to a fully fledged bear market.
Last week both price and inverted VIX have moved lower. Inverted VIX is falling faster than price. It has made a new mid-term low below the prior low 8 weeks ago, but price has not. This divergence is bearish.
DAILY CHART
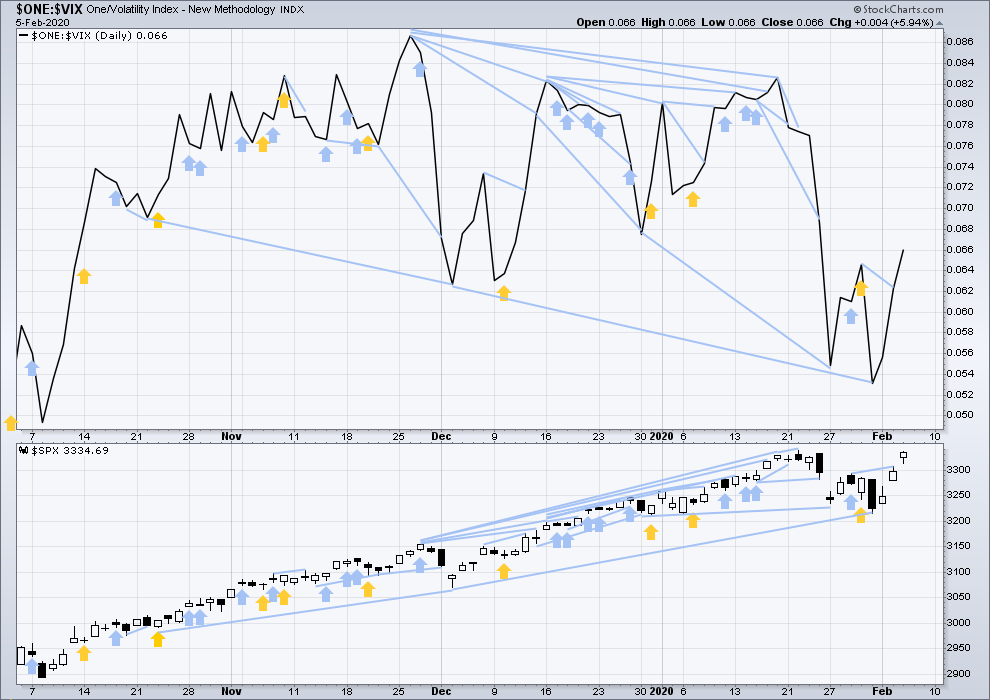
Click chart to enlarge. Chart courtesy of StockCharts.com. So that colour blind members are included, bearish signals
will be noted with blue and bullish signals with yellow.
Short term bearish divergence noted in yesterday’s analysis has not been followed by downwards movement.
Today both inverted VIX and price have moved higher. Neither have made new highs. There is no new short-term divergence, but mid and long-term bearish divergence remains.
DOW THEORY
Dow Theory confirmed a bear market in December 2018. This does not necessarily mean a bear market at Grand Super Cycle degree though; Dow Theory makes no comment on Elliott wave counts. On the 25th of August 2015 Dow Theory also confirmed a bear market. The Elliott wave count sees that as part of cycle wave II. After Dow Theory confirmation of a bear market in August 2015, price went on to make new all time highs and the bull market continued.
DJIA: 23,344.52 – a close on the 19th of December at 23,284.97 confirms a bear market.
DJT: 9,806.79 – price has closed below this point on the 13th of December.
S&P500: 2,532.69 – a close on the 19th of December at 2,506.96 provides support to a bear market conclusion.
Nasdaq: 6,630.67 – a close on the 19th of December at 6,618.86 provides support to a bear market conclusion.
With all the indices having moved higher following a Dow Theory bear market confirmation, Dow Theory would confirm a bull market if the following highs are made:
DJIA: 26,951.81 – a close above this point has been made on the 3rd of July 2019.
DJT: 11,623.58 – to date DJT has failed to confirm an ongoing bull market.
S&P500: 2,940.91 – a close above this point was made on the 29th of April 2019.
Nasdaq: 8,133.30 – a close above this point was made on the 26th of April 2019.
Published @ 09:45 p.m. EST.
—
Careful risk management protects your trading account(s).
Follow my two Golden Rules:
1. Always trade with stops.
2. Risk only 1-5% of equity on any one trade.
—
New updates to this analysis are in bold.
Main hourly wave count updated:
Minute b would now be 1.08 the length of minute a, indicating for this wave count either an expanded flat, running triangle or combination.
Alternate hourly chart updated:
Minute i may be close to completion. When its done, if this is the correct count, then minute ii may pull back to a shallow 0.236 or 0.382 of minute i.
Hi Lara, thank you for update. Could you explain what short term invalidation @ 3330.53 mean? Does it mean that if price action doesn’t break that level on the downside, this count is invalidated?
I think elgleon that means forget new highs
Not necessarily.
For the short term for the main count subminuette iv may now move into subminuette i price territory.
A new low below that point (prior to new highs) means I’ve labelled minuette (c) wrong.
Verne, I’m trying to reach you by email. Please look for an email from me admin@elliottwavestockmarket.com dated yesterday. Thanks.
Got it!
NDX’s extremely strong push up and definitive state of “correction complete” (beyond levels associated with expanding flat) strongly suggests to me the state of SPX and RUT are similar. Not to say new/smaller corrections aren’t immediately in front of us, but I’m extremely doubtful now that any such would be of the nature of back down to last Friday’s lows (or beyond). Of course anything can happen.
HI Kevin
Why would Lara post the daily and the weekly chart as her first choice?
For the market to go to back down to last Friday’s lows?
Kevin and I don’t always have the same conclusions in our analysis.
And that’s okay.
Correction is due soon, if not now as NDX is 17% away from 200 MA (the largest delta was back on Jan 26, 2018 with 16.7%).
Kevin, IWM trying to reverse ?
Yup, giving signs with stall/start of pivot off the 78% retrace level, I took a pilot short, RUT puts Feb 20. May the Force be with us…
However, SPX has the look of heading up to a very clean Fibonacci fit level at 3355 before final taking a deep “consolidation” breath. If that happens, maybe RUT stays under 1692…but maybe not.
Triangle there … last leg up? Wait and see
Closed my short positions for a small loss. Live to fight another day!
Silver has finished a 5 up, and retraced…. let’s go!
FOUR gaps up in a row…. people got to be getting hungry for some hot cakes by now ?!?!
It’s happening again! Now with SPY my underwater puts are profitable with SPY at a higher price….. just like TSLA before the dumperstilsken!
Everything back to normal …
Nothing like that with my SPX put-cakes, which I sold a bit on stale and going cold fast side pretty close to the low of the gap fill. “If first you don’t succeed…” Well, maybe, but ya know what? Trading in line with the dominant higher time frame trends puts a lot of +EV on your side. Shorting against said trends can be heroic…but often you take a bullet trying. How many times have I experienced that lesson? Too many times.
And yet I just sold a SPY call spread 334-337 for tomorrow…am I my own worst enemy? Maaaaybe…..but I can’t ignore that intraday double top, the complete nature of the 5 wave move up in /ES from Friday’s low, and the high degree of Fibonacci fit of that move with the current pivot high. Lol!!!!
Good morning Rodney. As one who has been anticipating a long entry based upon the completion of a larger correction..as have I, how do you approach the possibility that the correction has already completed? Regrouping verses holding the course is most challenging to me. I would appreciate any input. Thank you.
Well, that is a good question. Right now I have closed my short position because I don’t want to fight the upward momentum. As far as entering long again, I will wait patiently for the next sizable correction, perhaps Intermediate 4 if Minor 4 is over. When I see a decent entry price, I will go long. However, that may be a long time relatively speaking. For me as I approach retirement, capital preservation is utmost. I certainly would not want to go long here as the downside risk is significant. I may not participate in the remainder of the upside towards 3380. But I am fine with that. Each must choose a path based on goals and needs etc. Risk management is high on my list.
Also I am going out of town today for several days as my wife has hip replacement surgery (#2). I don’t want to be thinking or worrying about my equity positions especially leveraged positions like I had for my short position. Too much distraction.
Finally, the McClellan Oscillator gave a buy signal two days ago. It is not always correct. But with the momentum of this up move since, I should have heeded the signal.
Thank you for the response. I’m trying to learn to “ambush” my entries rather than chasing the market and falling prey to it. Best wishes to you and your wife concerning her procedure. I hope everything goes far better than expected.
I think this is what you call “irrational exuberance”
This move is relentless, and super super high momentum. That all said…I still see a 5 wave impulse here approaching conclusion. Which isn’t to stay it can’t or won’t extend, it may very well.
Where is your [i],[ii] at the same degree as the [iii],[iv] on the chart?
As shown. This count puts the highest momentum period (sorry, RSI isn’t shown here) which was in mid December at the “3 of 3” period. Which doesn’t make it right but it’s a viable alternative. I also note that the minute iv here reached exactly the price zone of the correction of one lower degree; if it was a minor 3, that would have been quite a bit lower. So two reasons why I consider it a viable alt.
I must be dreamin’…
Omg
California dreamin’.