
A cluster of signals (from VIX, the AD line, Friday’s candlestick and volume) suggests at the end of the week that an alternate Elliott wave count may be more likely for the short-term outlook.
Summary: It is possible that minor wave 3 could be over. Reasonable confidence in this view may be had with a new low below 3,258.14. The risk of a larger pullback or consolidation beginning here or very soon remains fairly high. This view has support from bearish signals from VIX and the AD line and a Bearish Engulfing candlestick pattern on the daily chart with support from volume.
If price continues higher next week, then next targets are 3,348 and then at 3,379.
Three large pullbacks or consolidations (fourth waves) during the next 1-2 years are expected: for minor wave 4 (possibly just begun), then intermediate (4), and then primary 4.
The biggest picture, Grand Super Cycle analysis, is here.
Last monthly charts analysis is here with video here.
ELLIOTT WAVE COUNTS
FIRST WAVE COUNT
WEEKLY CHART

Click chart to enlarge.
Cycle wave V may subdivide either as an impulse or an ending diagonal. Impulses are much more common, and it is clear at this stage that cycle wave V is an impulse and not a diagonal.
At this stage, cycle wave V may take another one to two or so years to complete.
A channel is drawn about the impulse of Super Cycle wave (V) using Elliott’s first technique. Draw this channel first from the high of 2,079.46 on the 5th of December 2014 to the high of 2,940.91 on the 21st of September 2018, then place a parallel copy on the low at 1,810.10 on the 11th of February 2016. Cycle wave IV found support about the lower edge.
Within Super Cycle wave (V), cycle wave III may not be the shortest actionary wave. Because cycle wave III is shorter than cycle wave I, this limits cycle wave V to no longer than equality in length with cycle wave III at 3,477.39. A new high by any amount at any time frame above this point would invalidate this main wave count in favour of one of the two alternate wave counts in the monthly chart analysis which are much more bullish.
The daily chart below will focus on movement from the end of minor wave 1 within intermediate wave (3).
Within cycle wave V, primary waves 1 and 2 may be complete. Within primary wave 3, intermediate waves (1) and (2) may be complete. Within the middle of intermediate wave (3), minor wave 4 may not move into minor wave 1 price territory below 3,021.99.
Within cycle wave V, the corrections of primary wave 2, intermediate wave (2) and minor wave 2 all show up clearly on the weekly chart. For cycle wave V to have the right look, the corresponding corrections of minor wave 4, intermediate wave (4) and primary wave 4 should also show up on the weekly chart. Three more large multi-week corrections are needed as cycle wave V continues higher, and for this wave count the whole structure must complete at or before 3,477.39.
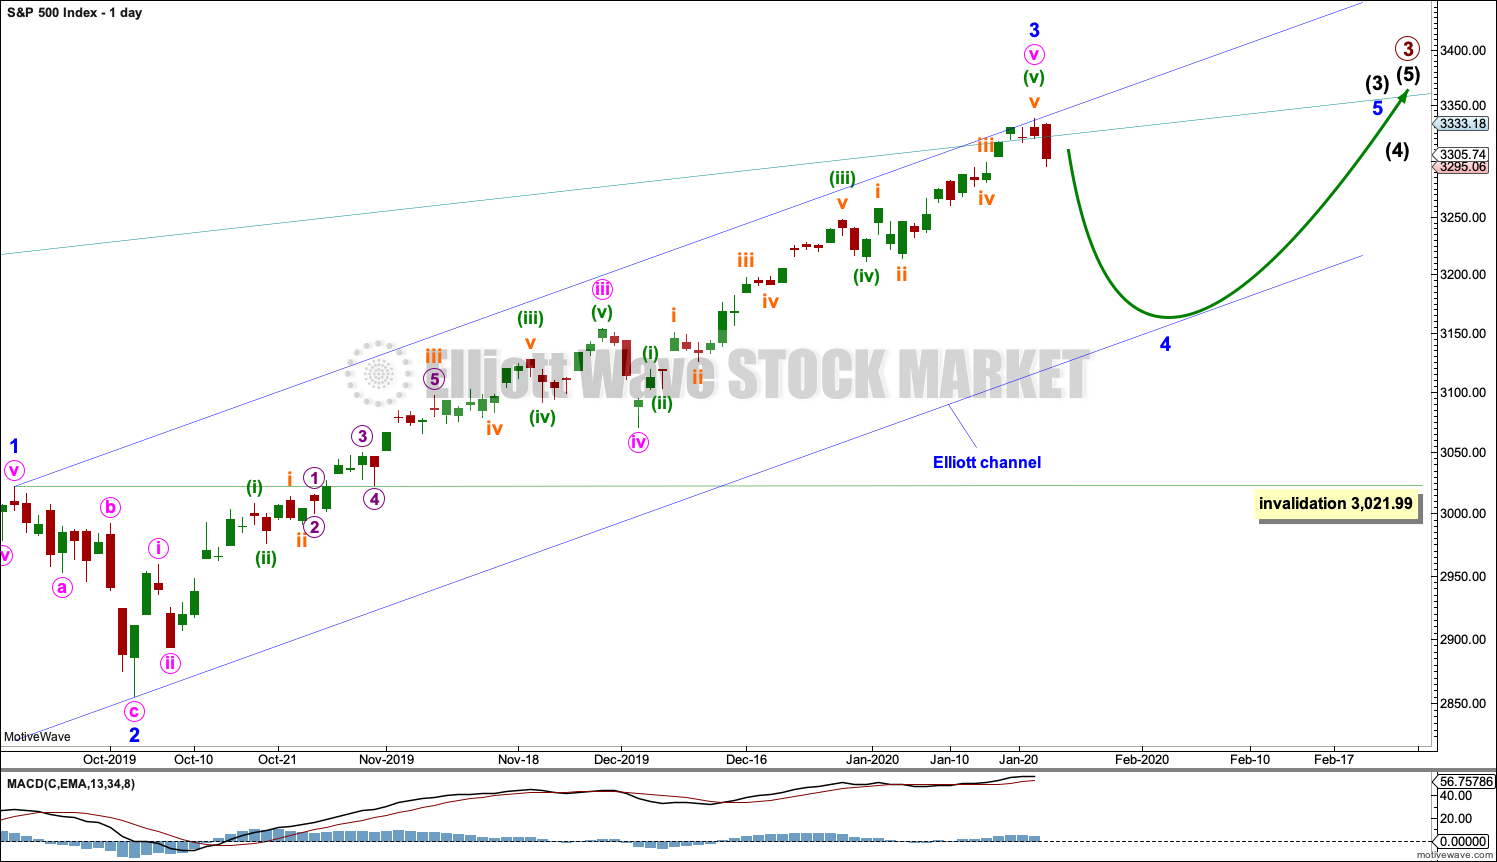
DAILY CHART
Click chart to enlarge.
All of primary wave 3, intermediate wave (3) and minor wave 3 may only subdivide as impulses.
Minor wave 3 may now be complete.
Minor wave 2 was a sharp deep pullback, so minor wave 4 may be expected to be a very shallow sideways consolidation to exhibit alternation. Minor wave 2 lasted 2 weeks. Minor wave 4 may be about the same duration, or it may be a longer lasting consolidation. Minor wave 4 may end within the price territory of the fourth wave of one lesser degree; minute wave iv has its range from 3,154.26 to 3,070.49. However, this target zone at this stage looks to be too low.
Minor wave 4 may not move into minor wave 1 price territory below 3,021.99.
When minor wave 4 may be complete, then a target will again be calculated for intermediate wave (3).
When intermediate waves (3) and (4) may be complete, then a target will again be calculated for primary wave 3.
Draw an Elliott channel now about intermediate wave (3): draw the first trend line from the end of minor wave 1 to the end of minor wave 3, then place a parallel copy on the end of minor wave 2. Minor wave 4 may find support at the lower edge of this channel if it is long lasting or deep enough.
Price has recently reached just above the upper edge of the wide teal channel copied over from monthly and weekly charts. A reaction downwards soon would be a reasonable expectation.
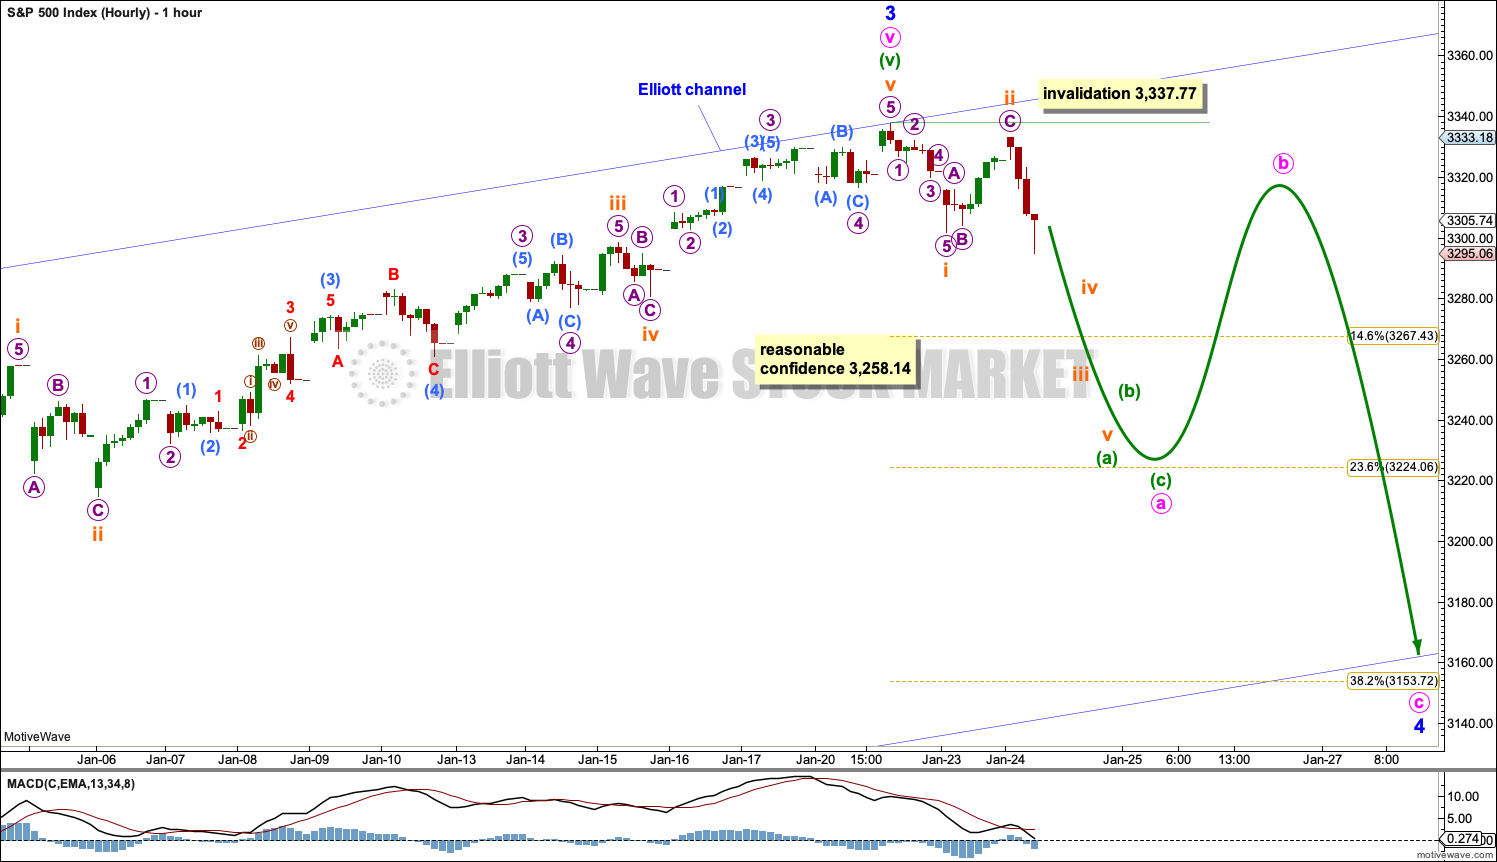
HOURLY CHART
Click chart to enlarge.
At this stage, this wave count has reasonable support from classic technical analysis. At the end of the week, this is swapped over to be the main Elliott wave count. A new low below 3,258.14 would add reasonable confidence in it. While price remains above this point, there is a risk that the wave counts may again be swapped over.
A correction to last about two weeks should begin with a five down on the hourly chart.
Subminuette wave ii may not move beyond the start of subminuette wave i above 3,337.77.
Minor wave 4 may end within the price territory of the fourth wave of one lesser degree. Minute wave iv has its range from 3,154.26 to 3,070.49. Within this range is the 0.382 Fibonacci ratio of minor wave 3 at 3,153.72. If this target range is wrong, then it may be too low.
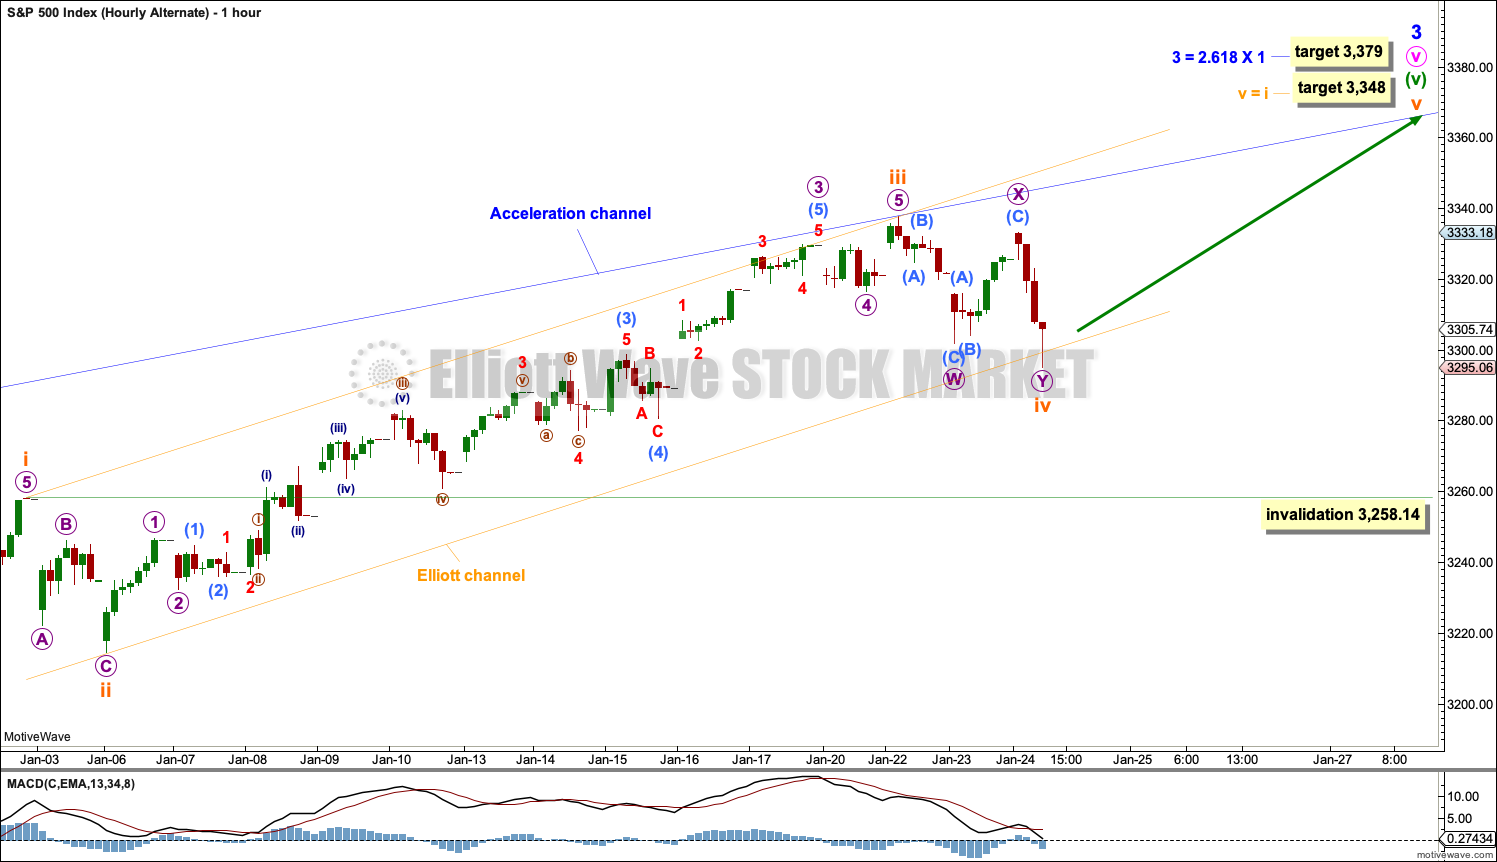
ALTERNATE HOURLY CHART
Click chart to enlarge.
It is still possible that minor wave 3 may be close to completion and may continue higher.
The strongest momentum within minuette wave (v) for this wave count corresponds with the end of subminuette wave iii within it. This wave count agrees with MACD. Subminuette wave iii is just 2.41 points longer than 2.618 the length of subminuette wave i. A new target is calculated at subminuette degree. If price reaches this first target and keeps rising, then use the next higher target.
SECOND WAVE COUNT
WEEKLY CHART

Click chart to enlarge.
This second wave count sees all subdivisions from the end of the March 2009 low in almost the same way, with the sole difference being the degree of labelling.
If the degree of labelling for the entirety of this bull market is all moved down one degree, then only a first wave at cycle degree may be nearing an end.
When cycle wave I is complete, then cycle wave II should meet the technical definition of a bear market as it should retrace more than 20% of cycle wave I, but it may end about either the 0.382 or 0.618 Fibonacci Ratios of cycle wave I. Cycle wave II may end close to the low of primary wave II within cycle wave I, which is at 1,810.10. It is also possible that cycle wave II could be fairly shallow and only barely meet the definition of a bear market.
The impulse is still viewed as nearing an end; a fifth wave is still seen as needing to complete higher. This wave count labels it primary wave 5. Primary wave 5 may still need another year to two or so to complete, depending upon how time consuming the corrections within it may be.
Primary wave 5 may be subdividing as an impulse, in the same way that cycle wave V is seen for the first weekly chart.
TECHNICAL ANALYSIS
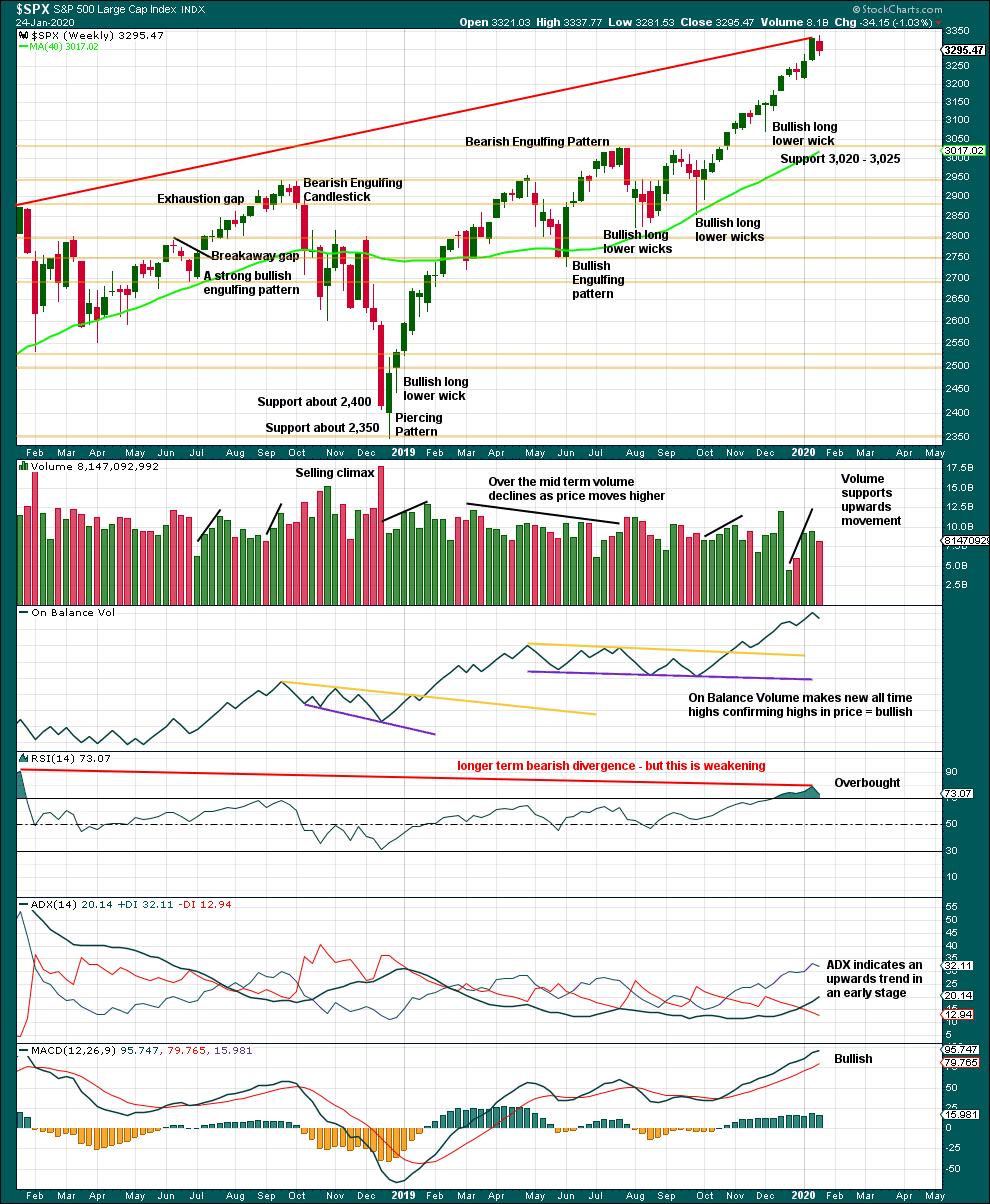
WEEKLY CHART
Click chart to enlarge. Chart courtesy of StockCharts.com.
It is very clear that the S&P is in an upwards trend and the bull market is continuing. Price does not move in straight lines; there will be pullbacks and consolidations along the way.
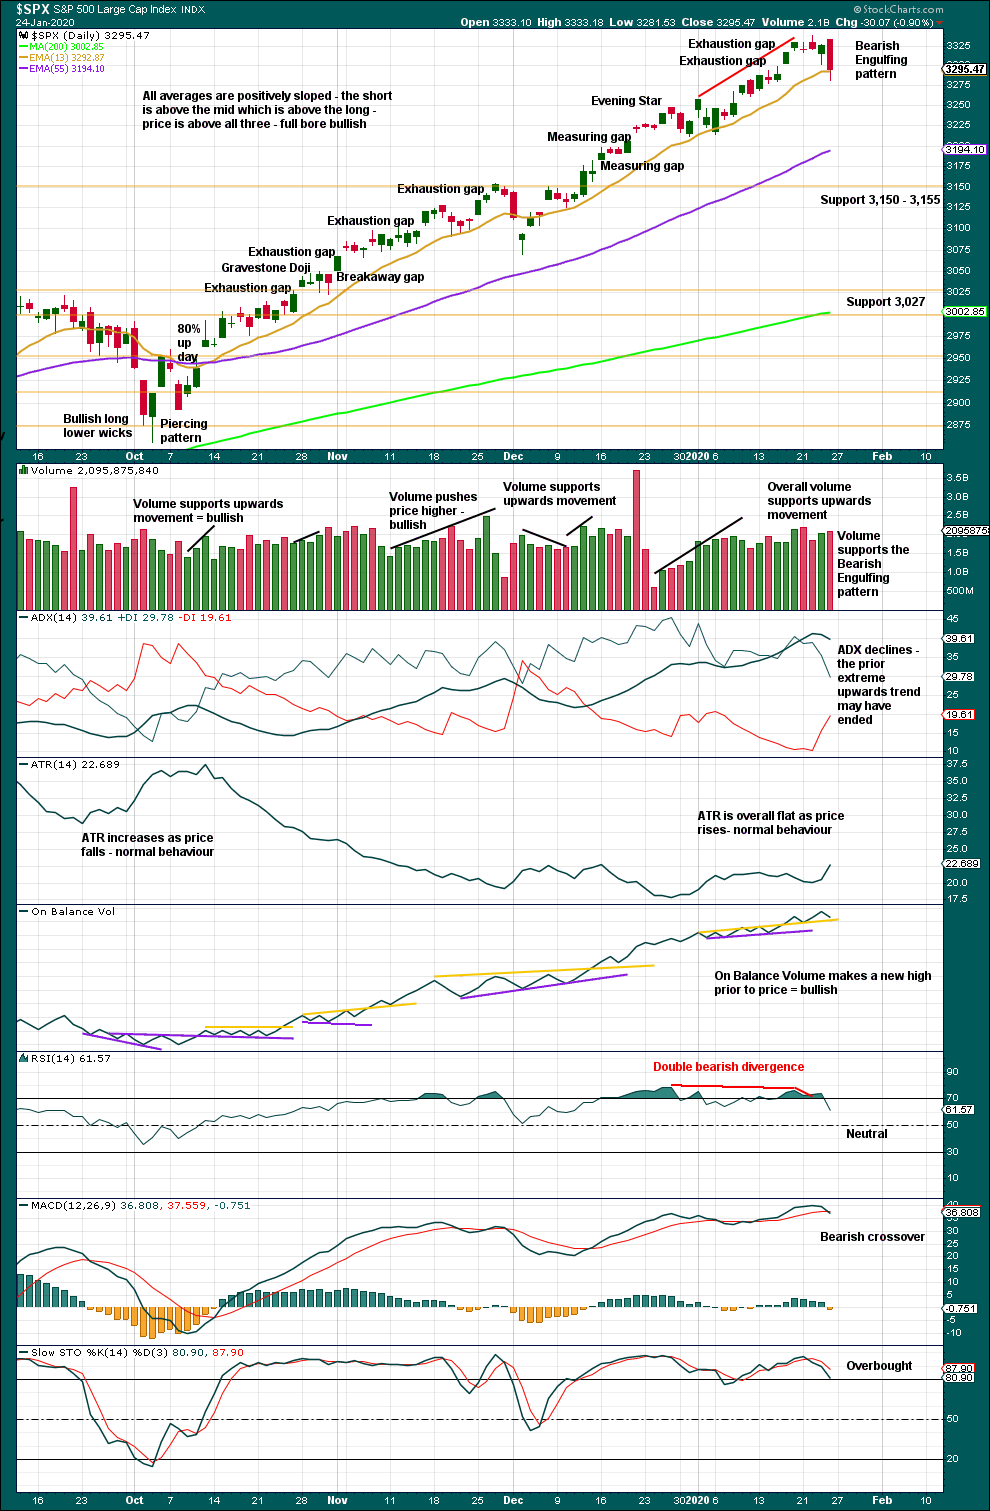
This chart is overall bullish. There are no signs of short-term weakness in upwards movement.
RSI is now overbought. That does not mean upwards movement must end here, because it can continue for several weeks while RSI reaches more extreme. RSI reaching overbought is a warning that conditions are now becoming extreme. A pullback or consolidation will follow and the longer conditions are extreme the closer this will be. However, assume the trend remains the same until proven otherwise. This warning should be heeded by careful attention to risk management.
DAILY CHART
Click chart to enlarge. Chart courtesy of StockCharts.com.
The upwards trend reached extreme while RSI reached overbought and then exhibited bearish divergence. A strong bearish candlestick reversal pattern in these conditions should be given weight. This has also happened at a multi-year resistance trend line (seen on the daily and weekly Elliott wave charts), giving more weight to the view that a pullback or more time consuming consolidation may have just begun.
Look for support at horizontal trend lines.
The larger trend, particularly at the monthly time frame, remains up. Expect pullbacks and consolidations to be more short term in nature although they can last a few weeks.
In a bull market which may continue for months or years, pullbacks and consolidations may present opportunities for buying when price is at or near support.
BREADTH – AD LINE
WEEKLY CHART
Click chart to enlarge. Chart courtesy of StockCharts.com. So that colour blind members are included, bearish signals
will be noted with blue and bullish signals with yellow.
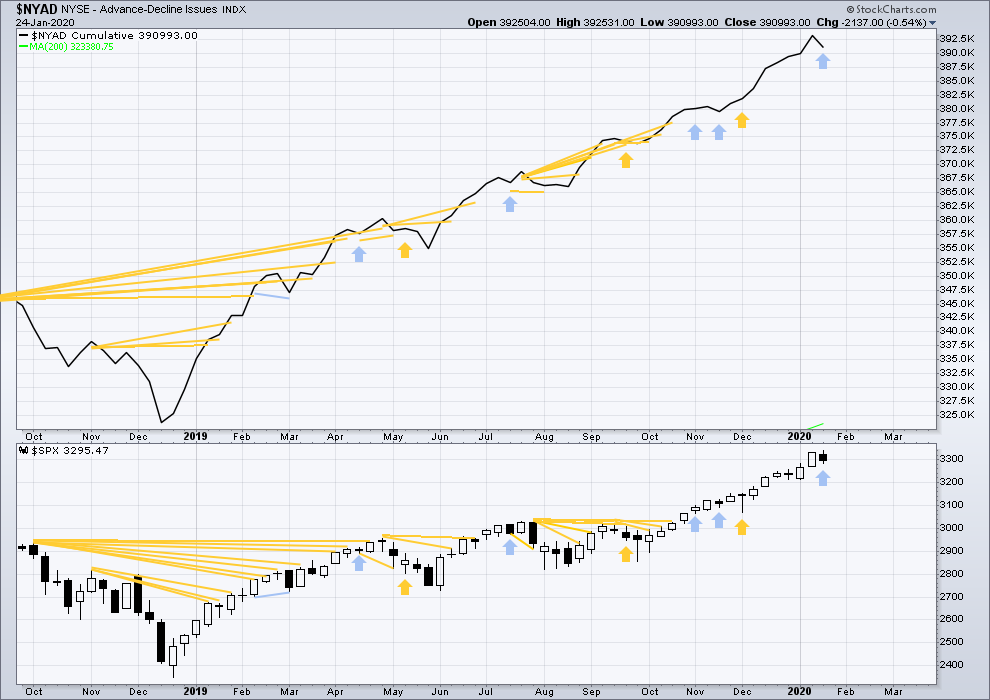
Bear markets from the Great Depression and onwards have been preceded by an average minimum of 4 months divergence between price and the AD line with only two exceptions in 1946 and 1976. With the AD line making new all time highs this week, the end of this bull market and the start of a new bear market is very likely a minimum of 4 months away, which is mid May 2020.
In all bear markets in the last 90 years there is some positive correlation (0.6022) between the length of bearish divergence and the depth of the following bear market. No to little divergence is correlated with more shallow bear markets. Longer divergence is correlated with deeper bear markets.
If a bear market does develop here, it comes after no bearish divergence. It would therefore more likely be shallow.
This week price has moved higher with a higher high and a higher low, but the AD line has moved lower. This divergence is bearish and supports the main Elliott wave count.
Large caps all time high: 3,337.77 on 22nd January 2020.
Mid caps all time high: 2,106.30 on 17th January 2020.
Small caps all time high: 1,100.58 on 27th August 2018.
For the short term, there is a little weakness now in only large caps making most recent new all time highs.
DAILY CHART
Click chart to enlarge. Chart courtesy of StockCharts.com. So that colour blind members are included, bearish signals
will be noted with blue and bullish signals with yellow.
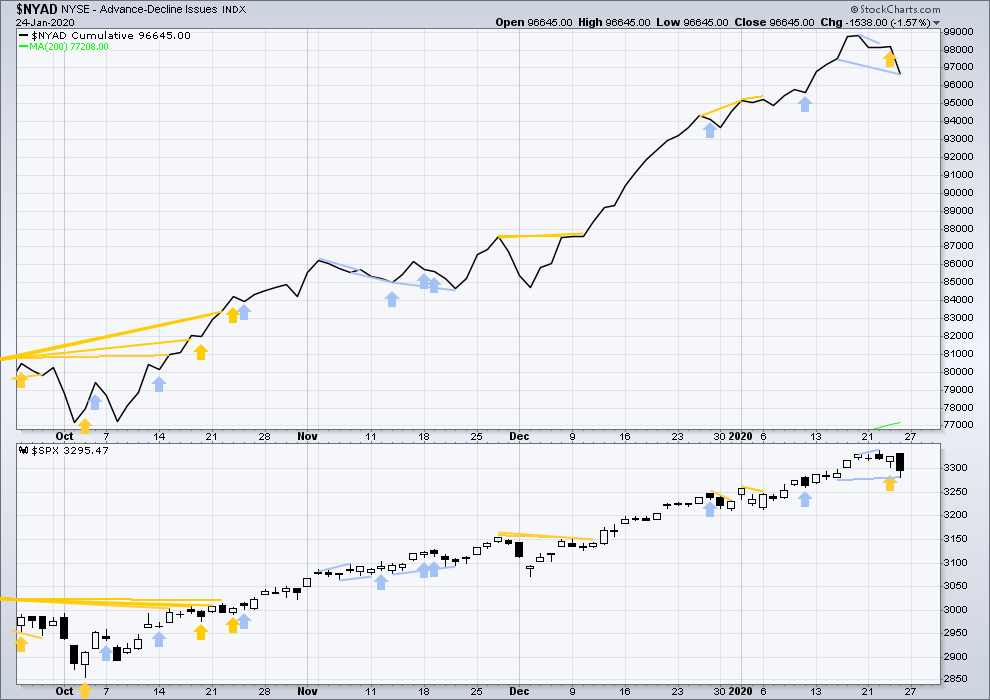
Breadth should be read as a leading indicator.
Both price and the AD line have moved lower, but the AD line has made a new low below the prior short-term low of the 15th of January where price has not. Breadth is falling a little faster than price. This divergence is bearish and supports the main Elliott wave count.
VOLATILITY – INVERTED VIX CHART
WEEKLY CHART
Click chart to enlarge. Chart courtesy of StockCharts.com. So that colour blind members are included, bearish signals
will be noted with blue and bullish signals with yellow.
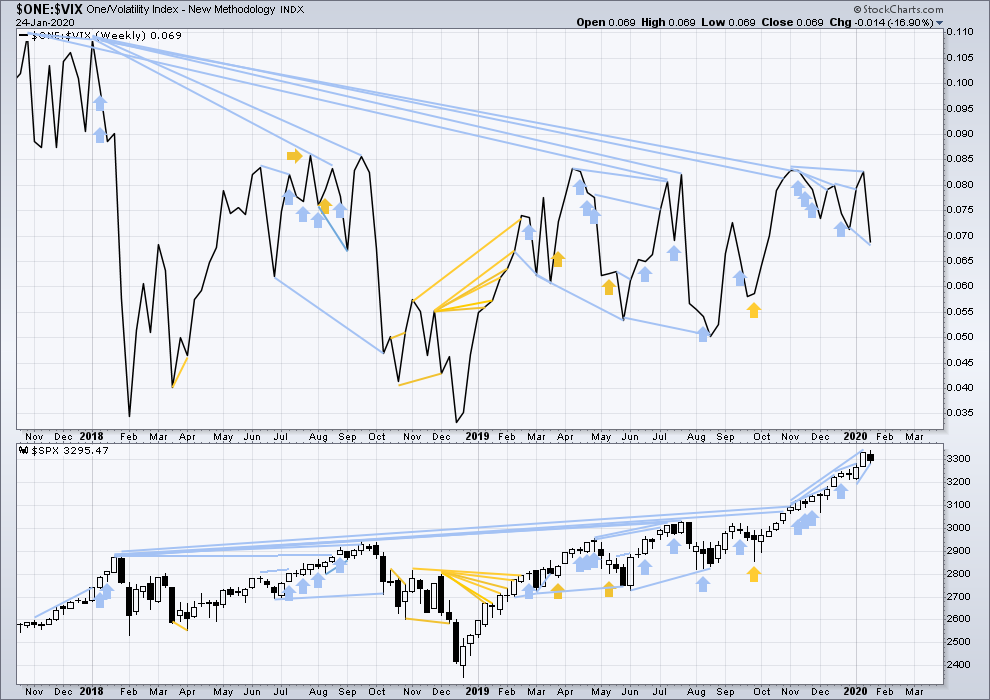
The all time high for inverted VIX was on 30th October 2017. There is now over two years of bearish divergence between price and inverted VIX.
The rise in price is not coming with a normal corresponding decline in VIX; VIX remains elevated. This long-term divergence is bearish and may yet develop further as the bull market matures.
This divergence may be an early warning, a part of the process of a top developing that may take years. It may is clearly not useful in timing a trend change from bull to a fully fledged bear market.
This week price has moved higher, but inverted VIX has moved lower to make a new low below the low 4 weeks ago. This divergence is bearish and supports the main Elliott wave count.
A cluster of bearish signals supports the main Elliott wave count.
DAILY CHART
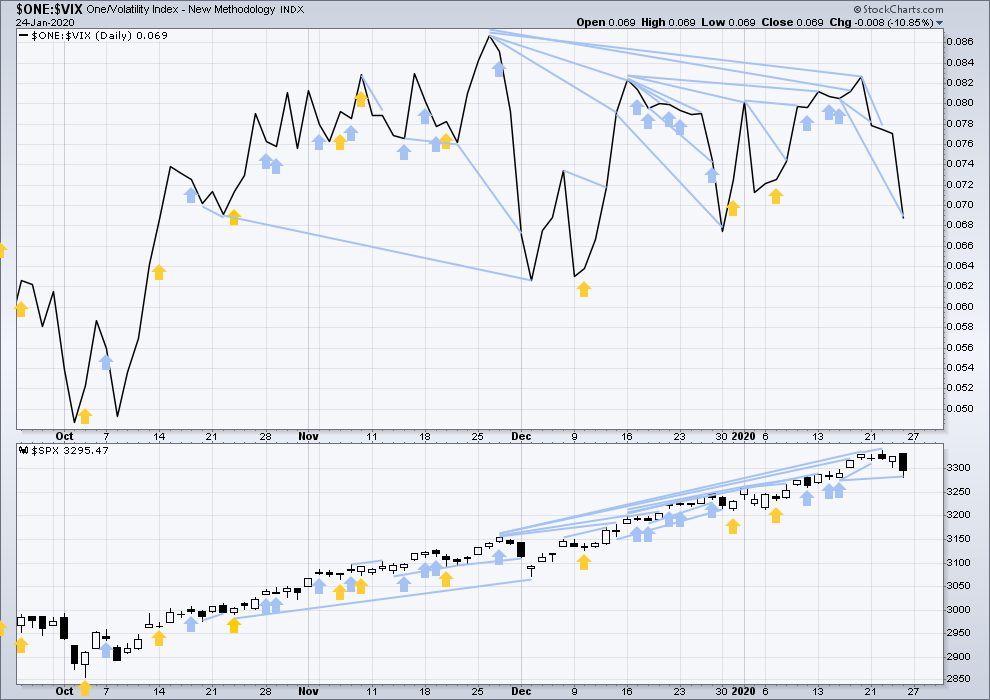
Click chart to enlarge. Chart courtesy of StockCharts.com. So that colour blind members are included, bearish signals
will be noted with blue and bullish signals with yellow.
Both price and inverted VIX have moved lower on Friday, but inverted VIX has made a new short-term low below the prior swing low of the 15th of January where price has not. This divergence is bearish and supports the main Elliott wave count.
There is now a strong cluster of bearish divergence between price and VIX, which supports the main Elliott wave count.
DOW THEORY
Dow Theory confirmed a bear market in December 2018. This does not necessarily mean a bear market at Grand Super Cycle degree though; Dow Theory makes no comment on Elliott wave counts. On the 25th of August 2015 Dow Theory also confirmed a bear market. The Elliott wave count sees that as part of cycle wave II. After Dow Theory confirmation of a bear market in August 2015, price went on to make new all time highs and the bull market continued.
DJIA: 23,344.52 – a close on the 19th of December at 23,284.97 confirms a bear market.
DJT: 9,806.79 – price has closed below this point on the 13th of December.
S&P500: 2,532.69 – a close on the 19th of December at 2,506.96 provides support to a bear market conclusion.
Nasdaq: 6,630.67 – a close on the 19th of December at 6,618.86 provides support to a bear market conclusion.
With all the indices having moved higher following a Dow Theory bear market confirmation, Dow Theory would confirm a bull market if the following highs are made:
DJIA: 26,951.81 – a close above this point has been made on the 3rd of July 2019.
DJT: 11,623.58 – to date DJT has failed to confirm an ongoing bull market.
S&P500: 2,940.91 – a close above this point was made on the 29th of April 2019.
Nasdaq: 8,133.30 – a close above this point was made on the 26th of April 2019.
Published @ 10:38 p.m. EST.
—
Careful risk management protects your trading account(s).
Follow my two Golden Rules:
1. Always trade with stops.
2. Risk only 1-5% of equity on any one trade.
—
New updates to this analysis are in bold.
Today we may have reasonable confidence that minor 4 has arrived. I can see a small five down, so that expects a three up to follow then another five down.
Yep!
That Caesar is sure one handsome fellow…! 🙂
Possible extended sub-min three…?
VIX bull flag…target around 24…UVXY closes at day’s high…..risk desks will be contacting leveraged longs for sure so things could get very interesting!
Have a great evening all!
Ha! I can here the automated email notification tones dinging now. funny insight!
The real story out of Kiev is not the millions the Bidens received, but the BILLIONS in missing IMF funds, making the former appear merely chump change. Word on the street is some of the funds were laundered through Magellan instruments. Blackrock is a big holder so money flows there worth watching…
3225 SPX is the 23.6% retracement level of Minor 3. It is fast approaching and this is just Minute A of an A-B-C pattern to develop for Minor 4. My guess is we will see at least a 38.2% retracement at 3155.
Note: There are many patterns Minor 4 may take. In fact, 4th waves can be triangles in which case the A wave of an A-B-C-D-E could achieve the lowest price.
re opened a SMALL long position
One more low before we bounce…
Nice!
Verne,
You thinking 3224-3225 or below 3200 for next drop?
I expect 3200 to hold on this
initial move down…
Looks like a 4 of 1 down tracing out some kind of triangle. If true, an E up and final impulse down should unfold into the close…eyeing Wed 326 strike calls for upside scalp…
Also possible 5 of A…
“Stink Bid” on Wed 325 strike calls for one Washington even…last wave down should be swift….
They are likely to take the last wave down right into the close….also eyeing e-mini….are we having fun yet? 😉
I’ve got multiple Fibonacci levels from intra-minor 3 swings at today’s low; there’s a lot of structural support there. Hourly certainly looks like a complete 5 wave move down (minute a as you say). I put on some fresh shorts Friday…will add when it appears a 3 up b wave is complete. In the very short term this can be traded long, but only very carefully and did I say short term? I admit I have a little long on now myself to catch a little b wave $’s.
The big channel prices has been in for over 3 months in /ES is now broken to the downside. Strong indicator to me that minor 4 is indeed here.
On the other hand, price is now in the zone expected if this is a minute 4 of an ongoing minor 3 per this alternate count. So careful to the short side. Note the overall top…right at a level I projected based on Fibonacci structure of the move to date back in mid November. Fibonacci fitting works.
RUT however looks much more decidedly like it is indeed in a minor 4, implying that SPX is likely to be as well. Remember what the SPX target range is per “the prior lower degree iv”: 3070 to 3154. And the target range for RUT is marketed here. But neither have to get there. It is notable that in both SPX and RUT the bearish symmetry (largest down move to date in the 3 wave up) has been broken (exceeded): this correction is now larger than all others in both these markets during the course of the minor 3.
Futures down to the confidence level but whom knows where it will be at open! Happy trading
The /ES futures action with overnight data, so far this even of 1/26. Through two of my three zones of support and testing the 3rd…time to start identifying deeper levels!!! Remember that per the main, the range for the low of a full minor 4 here is 3070-3154 (SPX, a few pt’s delta from /ES), a LONG WAYS DOWN to go.
Yep. Tonight I feel vindicated having sold all my long positions. New longs will come in time.
You were disciplined and did amazing!! Something we can all learn from 🙂
The chance to go long will come but for now think we are all happy for a down leg to develop 🙂
World War Z?
What about the P4 pathogen research lab in the city?
What about the patent?
Accidental release?
We have a feckless and useless MSM…
Yippie Ki A! #1 with a bullet.
Coronavirus spreading fast per Xi from China. Now 60 million people being locked down…
It’s important to keep perspective. As far as I can tell from news reports, only a small # (less than 10?) have actually died from this. People die from the flu every year. SARS killed about 450 in 2003, and this situation is far from even that to date.
If ya’ll aren’t aware of the “Spanish flu” of 1918-1920…well, that was a different matter. Killed over 50 million people. So it’s good that defensive measures are being taken. But it’s not particularly rational yet for it to dramatically effect the markets, in my opinion, based up the data to date. This correction will be a buying opportunity.
Completely agree with Kevin. We actually have to hope that correction will be as deep as it can so we can buy good quality stocks relatively cheap. It’s the market that drives the news, not the other way around. Coronovirus is just an excuse to correct this overheated market. If it wouldn’t be for that virus, it would be something else. Levels came to hot and had to be corrected. So let’s wait for it to stop the deeper the better.
Pre-symptomatic transmission is a game-changer. The current airport screening methods are ineffective and I suspect we are going to see an exponential rise in infection rates. The CCP covered up the crisis for too long to contain it…
The transmission of the virus during the 10 to 14 day incubation period is unlike anything seen before. I heard that this will dramatically increase the rate of transmission by several hundred percent. A word from China is that they expect 250,000 cases in the next week or so. One also wonders if they are releasing all the information and telling the world the truth.
While I am not one to panic and try to help people remain calm, the coronavirus has the potential to be devastating. My thoughts and prayers are with the people infected and who have already lost loved ones.
I concur, I would expect a significant hit to trade in coming weeks and months. Companies will start to hide behind this for earnings miss in coming qtrs.
As more news comes out, we shall know better but one outlet just put this out ‘Chinese Nurse Says 90,000 Already Infected In Emotional Plea For Help’. This is from Wahun area only.
The doctors are dropping from sheer exhaustion trying to care for patients…they do desperately need help….
US trying to evacuate Americans….
Yep! The patent suggests it may be a bio-warfare engineered strain…so sad…!
BTW Verne, it has been very nice to hear from you over the past week or so. I hope you continue to stay in touch from time to time by posting here.
Will do. All the newbies in the “War Room” doing quite well and I really missed you guys. Rod your timing was exquisite, as usual. Talk about picking up pennies in front of an on-coming freight train!
It will be interesting to see what the “January Effect” portends…2020 gains all given back…
As someone once said, everything is explainable with a conspiracy theory.
They do have a P4 lab in Wuhan….no kidding!
Welcome back wabbit!
I also think the impact of Coronavirus is way understated.
I concur…Rishi….thank you, Doc…!