
A small range downwards day leaves two Elliott wave counts valid.
Summary: The next target is at 3,348 and then at 3,379.
It is still possible that minor wave 3 could be over. Reasonable confidence in this view may be had with a new low below 3,258.14. The risk of a larger pullback or consolidation beginning here or very soon remains fairly high.
Three large pullbacks or consolidations (fourth waves) during the next 1-2 years are expected: for minor wave 4 (coming soon, possibly just begun), then intermediate (4), and then primary 4.
The biggest picture, Grand Super Cycle analysis, is here.
Last monthly charts analysis is here with video here.
ELLIOTT WAVE COUNTS
FIRST WAVE COUNT
WEEKLY CHART
Click chart to enlarge.
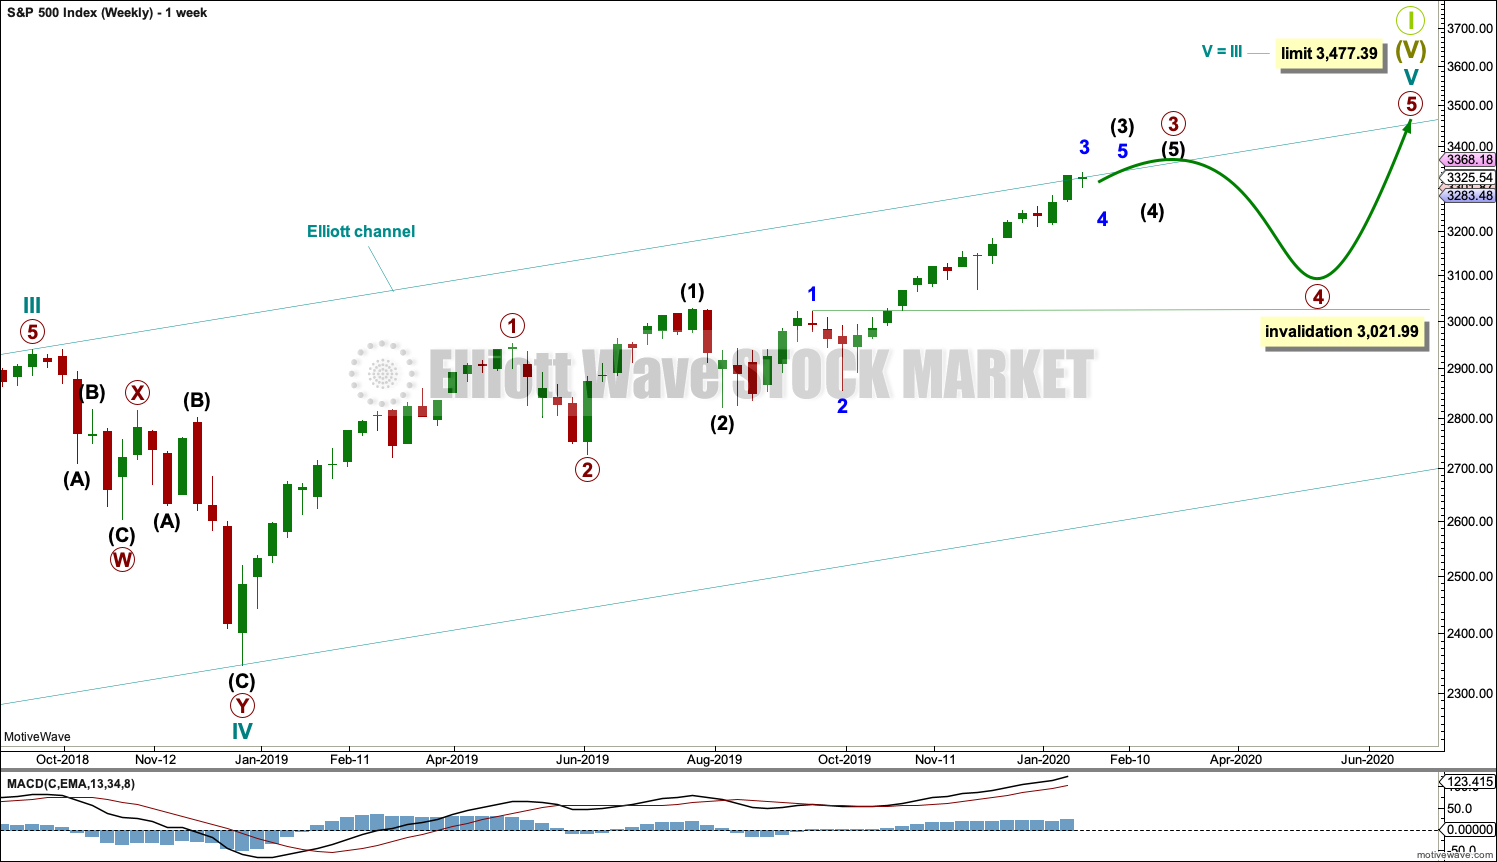
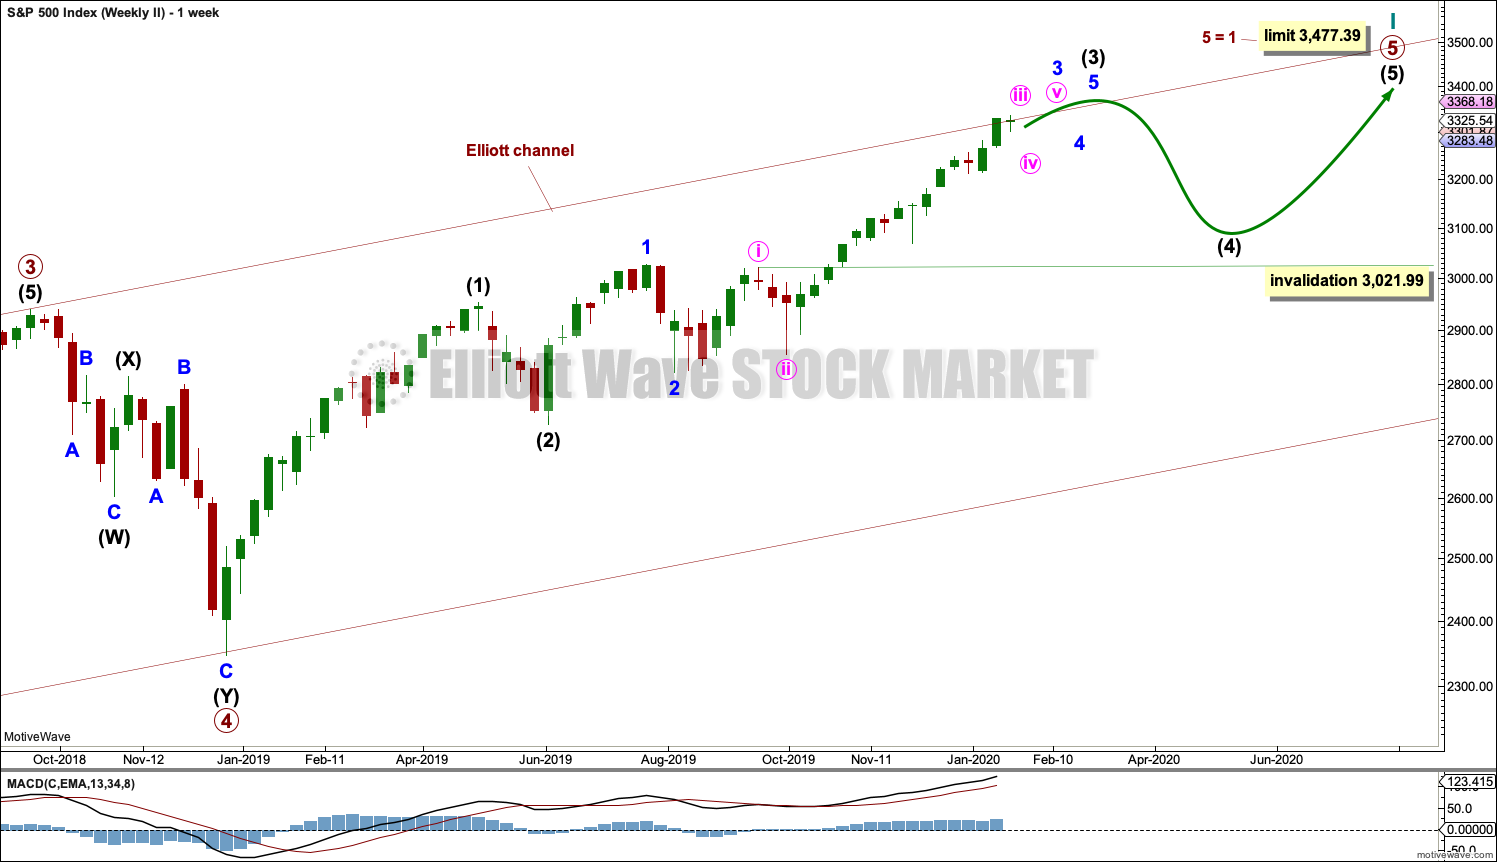
Cycle wave V may subdivide either as an impulse or an ending diagonal. Impulses are much more common, and it is clear at this stage that cycle wave V is an impulse and not a diagonal.
At this stage, cycle wave V may take another one to two or so years to complete.
A channel is drawn about the impulse of Super Cycle wave (V) using Elliott’s first technique. Draw this channel first from the high of 2,079.46 on the 5th of December 2014 to the high of 2,940.91 on the 21st of September 2018, then place a parallel copy on the low at 1,810.10 on the 11th of February 2016. Cycle wave IV found support about the lower edge.
Within Super Cycle wave (V), cycle wave III may not be the shortest actionary wave. Because cycle wave III is shorter than cycle wave I, this limits cycle wave V to no longer than equality in length with cycle wave III at 3,477.39. A new high by any amount at any time frame above this point would invalidate this main wave count in favour of one of the two alternate wave counts in the monthly chart analysis which are much more bullish.
The daily chart below will focus on movement from the end of minor wave 1 within intermediate wave (3).
Within cycle wave V, primary waves 1 and 2 may be complete. Within primary wave 3, intermediate waves (1) and (2) may be complete. Within the middle of intermediate wave (3), minor wave 4 may not move into minor wave 1 price territory below 3,021.99.
Within cycle wave V, the corrections of primary wave 2, intermediate wave (2) and minor wave 2 all show up clearly on the weekly chart. For cycle wave V to have the right look, the corresponding corrections of minor wave 4, intermediate wave (4) and primary wave 4 should also show up on the weekly chart. Three more large multi-week corrections are needed as cycle wave V continues higher, and for this wave count the whole structure must complete at or before 3,477.39.
DAILY CHART
Click chart to enlarge.
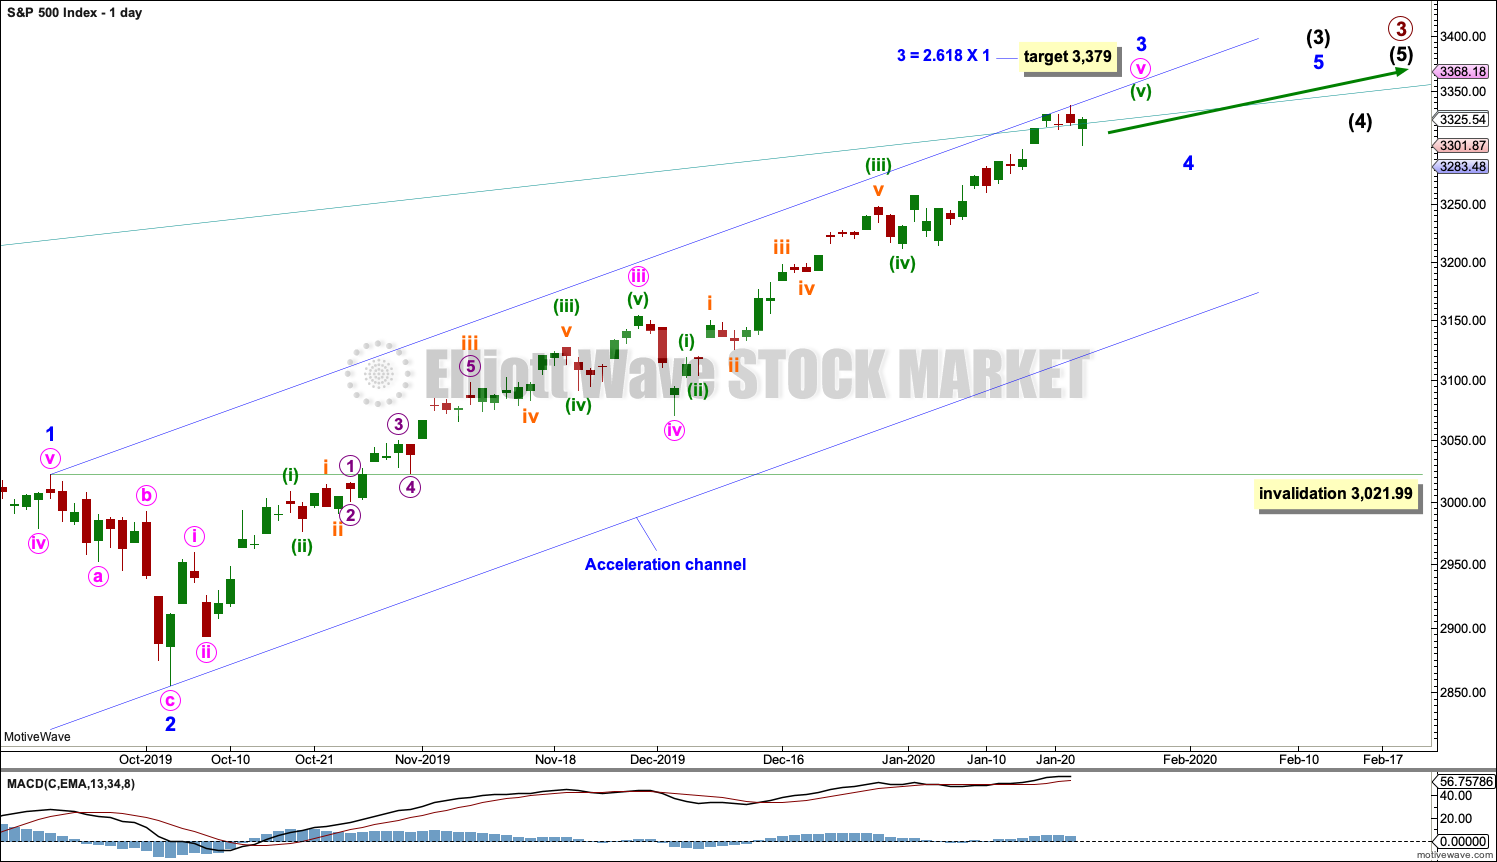
All of primary wave 3, intermediate wave (3) and minor wave 3 may only subdivide as impulses.
Minor wave 3 has passed 1.618 the length of minor wave 1, and within it minute wave v has passed equality in length with minute wave i.
The next target may be at 3,379 where minor wave 3 would reach 2.618 the length of minor wave 1.
When minor waves 3 and 4 may be complete, then a target will again be calculated for intermediate wave (3).
When intermediate waves (3) and (4) may be complete, then a target will again be calculated for primary wave 3.
Minor wave 2 was a sharp deep pullback, so minor wave 4 may be expected to be a very shallow sideways consolidation to exhibit alternation. Minor wave 2 lasted 2 weeks. Minor wave 4 may be about the same duration, or it may be a longer lasting consolidation. Minor wave 4 may end within the price territory of the fourth wave of one lesser degree; minute wave iv has its range from 3,154.26 to 3,070.49. However, this target zone at this stage looks to be too low.
Minor wave 4 may not move into minor wave 1 price territory below 3,021.99.
Intermediate wave (3) has now moved far enough above the end of intermediate wave (1) to allow intermediate wave (4) to unfold and remain above intermediate wave (1) price territory.
Draw an acceleration channel now about intermediate wave (3): draw the first trend line from the end of minor wave 1 to the last high, then place a parallel copy on the end of minor wave 2. Keep redrawing the channel as price makes new highs. Minor wave 4 may find support at the lower edge of this channel if it is long lasting or deep enough.
Price has recently reached just above the upper edge of the wide teal channel copied over from monthly and weekly charts. A reaction downwards soon would be a reasonable expectation.
HOURLY CHART
Click chart to enlarge.
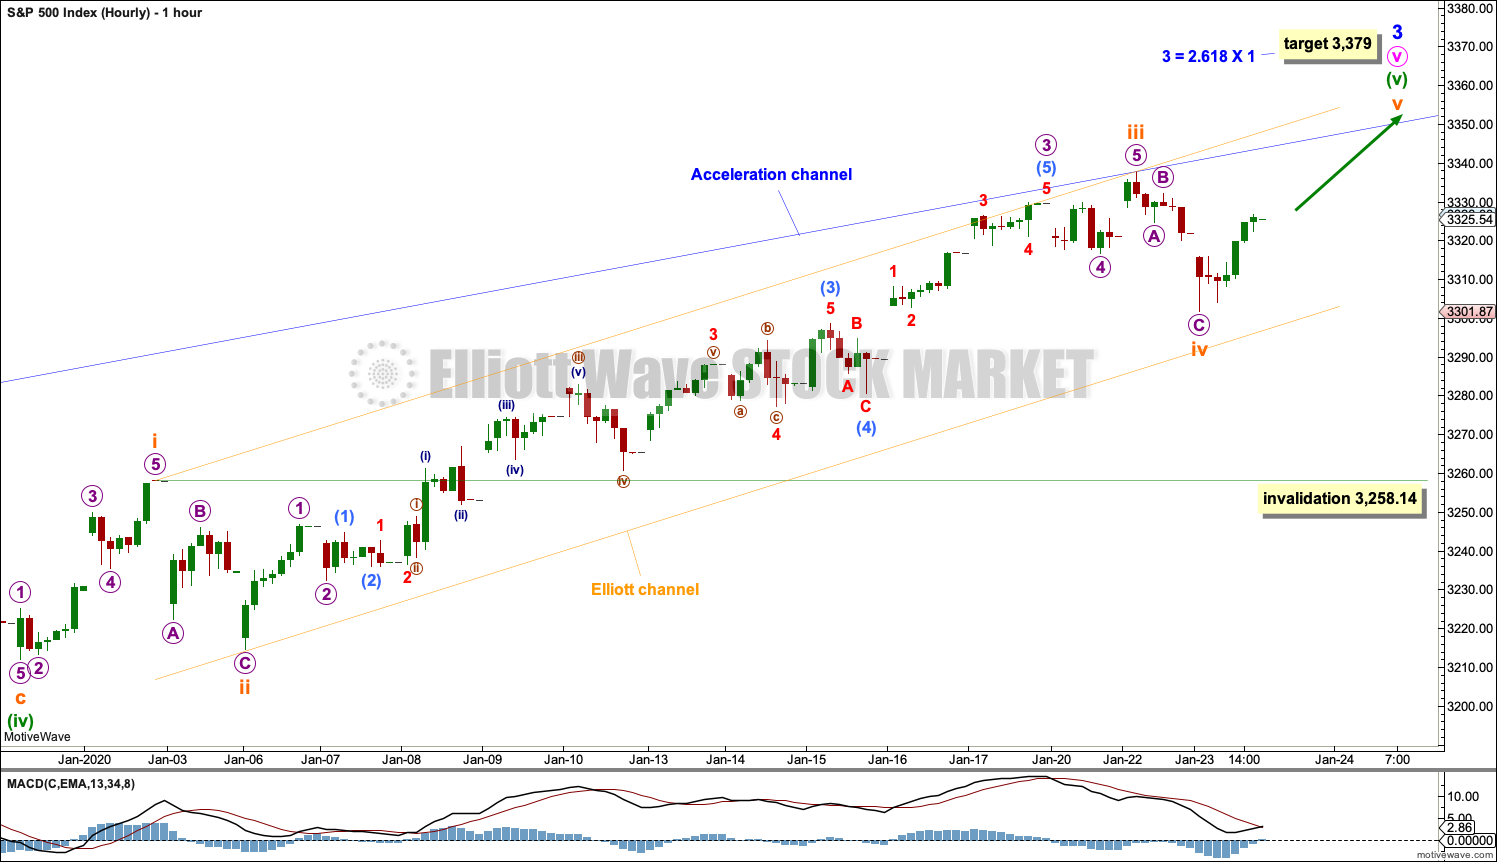
It is still possible that minor wave 3 may be close to completion and may continue higher.
Today the structure of minuette wave (v) is relabelled. The strongest momentum within minuette wave (v) now corresponds with the end of subminuette wave iii within it. This wave count agrees with MACD. Subminuette wave iii is just 2.41 points longer than 2.618 the length of subminuette wave i. A new target is calculated today at subminuette degree. If price reaches this first target and keeps rising, then use the next higher target.
ALTERNATE HOURLY CHART
Click chart to enlarge.
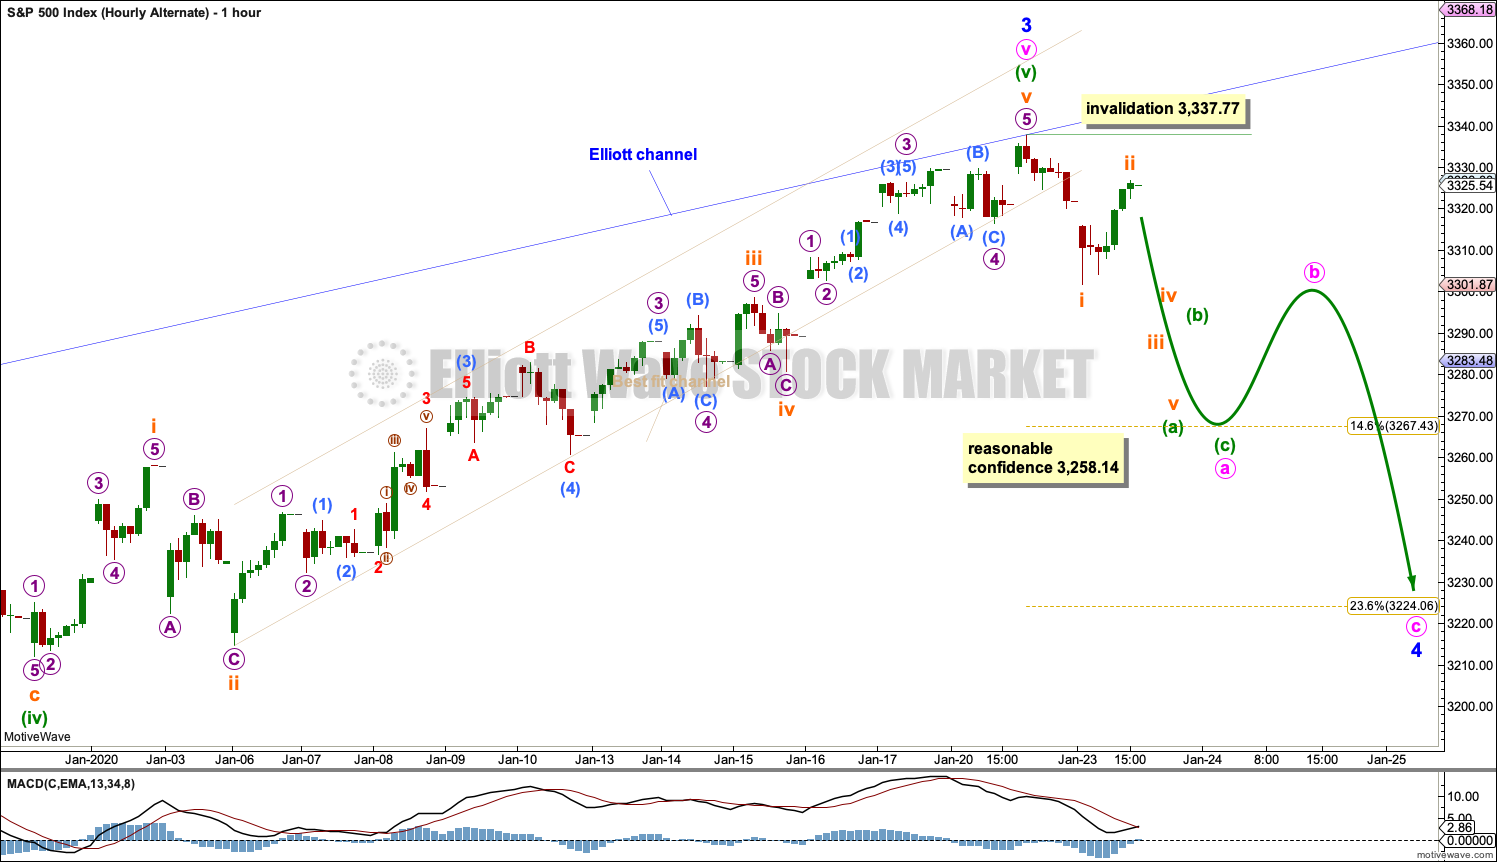
If price breaks below 3,316.61, then assume minor wave 4 has arrived. At that stage, this alternate wave count would increase in probability, but would still not be a certainty.
A breach of the narrow best fit channel, which is today redrawn, would add further confidence that minor wave 4 may have arrived.
A correction to last about two weeks should begin with a five down on the hourly chart.
Within the first five down, no second wave correction may move beyond the start of its first wave above 3,337.77.
Minor wave 4 may end within the price territory of the fourth wave of one lesser degree. Minute wave iv has its range from 3,154.26 to 3,070.49. Within this range is the 0.382 Fibonacci ratio of minor wave 3 at 3,153.72. If this target range is wrong, then it may be too low.
SECOND WAVE COUNT
WEEKLY CHART
Click chart to enlarge.
This second wave count sees all subdivisions from the end of the March 2009 low in almost the same way, with the sole difference being the degree of labelling.
If the degree of labelling for the entirety of this bull market is all moved down one degree, then only a first wave at cycle degree may be nearing an end.
When cycle wave I is complete, then cycle wave II should meet the technical definition of a bear market as it should retrace more than 20% of cycle wave I, but it may end about either the 0.382 or 0.618 Fibonacci Ratios of cycle wave I. Cycle wave II may end close to the low of primary wave II within cycle wave I, which is at 1,810.10. It is also possible that cycle wave II could be fairly shallow and only barely meet the definition of a bear market.
The impulse is still viewed as nearing an end; a fifth wave is still seen as needing to complete higher. This wave count labels it primary wave 5. Primary wave 5 may still need another year to two or so to complete, depending upon how time consuming the corrections within it may be.
Primary wave 5 may be subdividing as an impulse, in the same way that cycle wave V is seen for the first weekly chart.
TECHNICAL ANALYSIS
WEEKLY CHART
Click chart to enlarge. Chart courtesy of StockCharts.com.
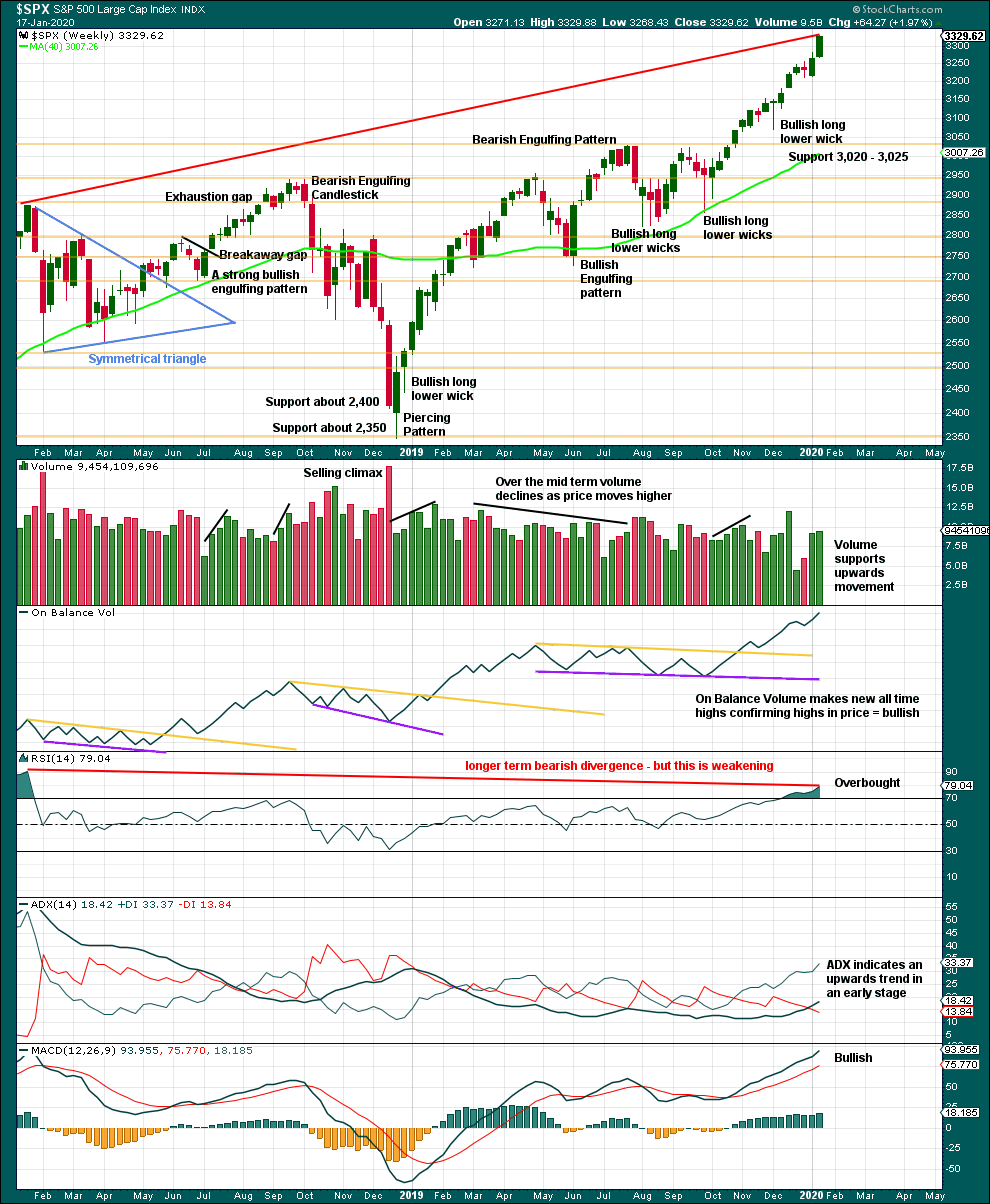
It is very clear that the S&P is in an upwards trend and the bull market is continuing. Price does not move in straight lines; there will be pullbacks and consolidations along the way.
This chart is overall bullish. There are no signs of short-term weakness in upwards movement.
RSI is now overbought. That does not mean upwards movement must end here, because it can continue for several weeks while RSI reaches more extreme. RSI reaching overbought is a warning that conditions are now becoming extreme. A pullback or consolidation will follow and the longer conditions are extreme the closer this will be. However, assume the trend remains the same until proven otherwise. This warning should be heeded by careful attention to risk management.
Last week again completes a strong bullish candlestick with some support from volume. The trend remains upwards, for now.
DAILY CHART
Click chart to enlarge. Chart courtesy of StockCharts.com.
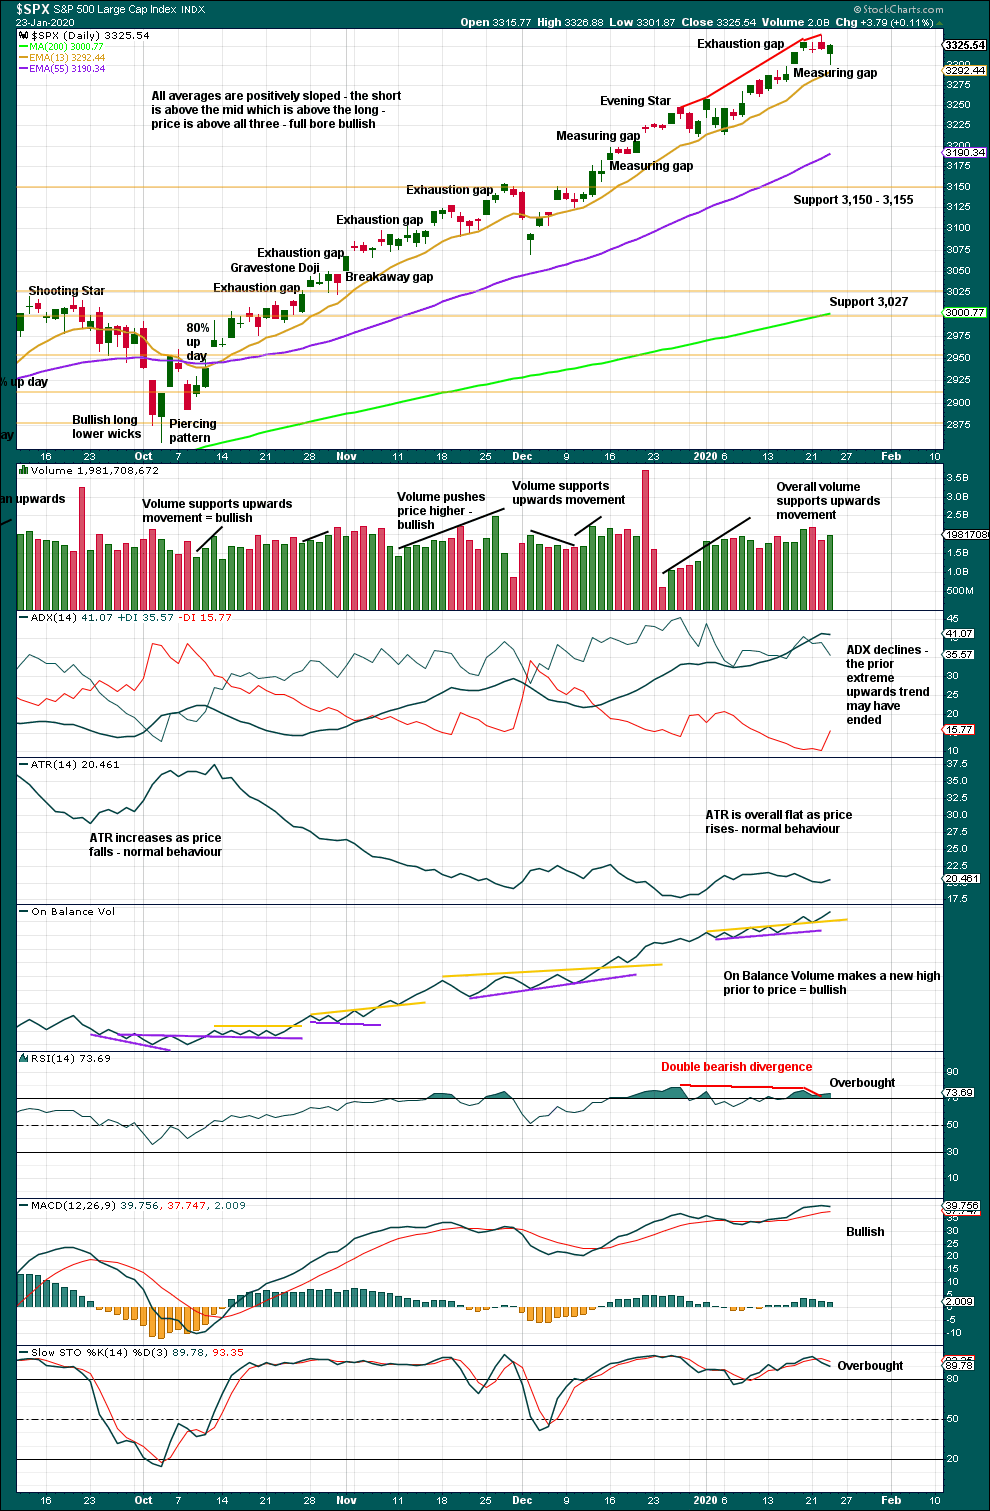
There is an upwards trend in place. There will be corrections along the way.
Like the weekly chart, this chart is bullish.
RSI now again exhibits double bearish divergence. With the data in hand today, there is further weakness exhibited by this divergence and while conditions are extreme this may be an indication that a pullback may arrive here or very soon.
Corrections for this market can sometimes arrive with very little warning. Extreme conditions warrant more careful attention to risk management. Upwards movement could continue yet for a reasonable distance and time, but the risk of a consolidation or pullback is increasing.
A target from the last measuring gap which remains open is at 3,386.85. However, the last gap is now closed, so it is renamed an exhaustion gap.
The warning of a larger pullback or consolidation is now louder with an exhaustion gap, bearish divergence from RSI while overbought, and ADX reaching extreme.
BREADTH – AD LINE
WEEKLY CHART
Click chart to enlarge. Chart courtesy of StockCharts.com. So that colour blind members are included, bearish signals
will be noted with blue and bullish signals with yellow.
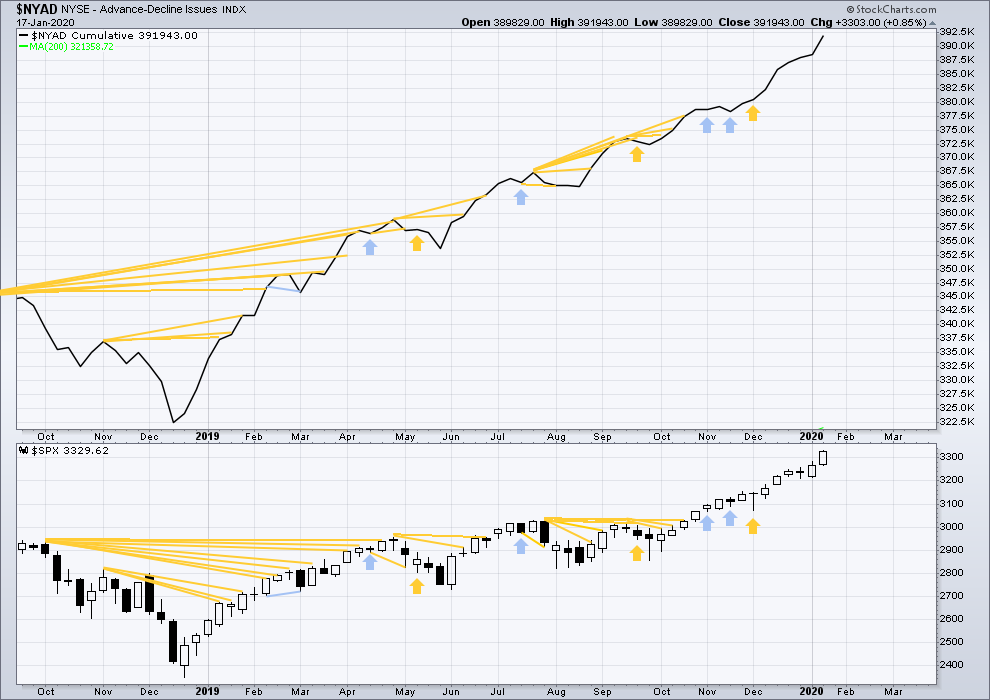
Bear markets from the Great Depression and onwards have been preceded by an average minimum of 4 months divergence between price and the AD line with only two exceptions in 1946 and 1976. With the AD line making new all time highs this week, the end of this bull market and the start of a new bear market is very likely a minimum of 4 months away, which is mid May 2020.
In all bear markets in the last 90 years there is some positive correlation (0.6022) between the length of bearish divergence and the depth of the following bear market. No to little divergence is correlated with more shallow bear markets. Longer divergence is correlated with deeper bear markets.
If a bear market does develop here, it comes after no bearish divergence. It would therefore more likely be shallow.
Again both price and the AD line have made new all time highs. There is no divergence. Upwards movement has support from rising market breadth.
Large caps all time high: 3,337.77 on 22nd January 2020.
Mid caps all time high: 2,106.30 on 17th January 2020.
Small caps all time high: 1,100.58 on 27th August 2018.
For the short term, there is a little weakness now in only large caps making new all time highs yesterday.
DAILY CHART
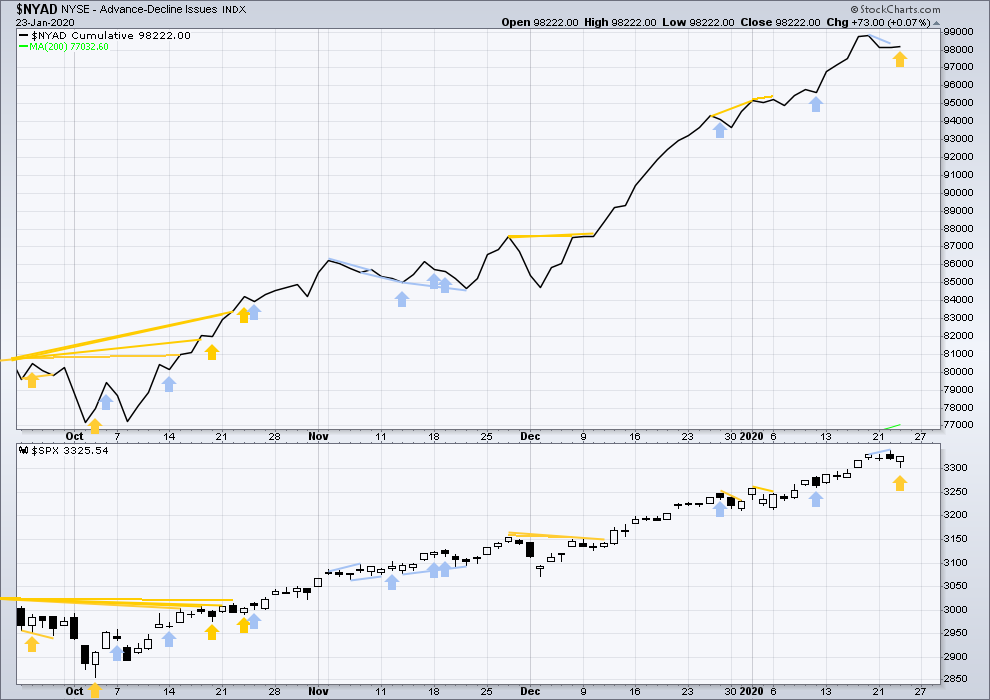
Click chart to enlarge. Chart courtesy of StockCharts.com. So that colour blind members are included, bearish signals
will be noted with blue and bullish signals with yellow.
Breadth should be read as a leading indicator.
Today price has moved lower, but the AD line has moved higher. This divergence is bullish and supports the main hourly Elliott wave count.
VOLATILITY – INVERTED VIX CHART
WEEKLY CHART
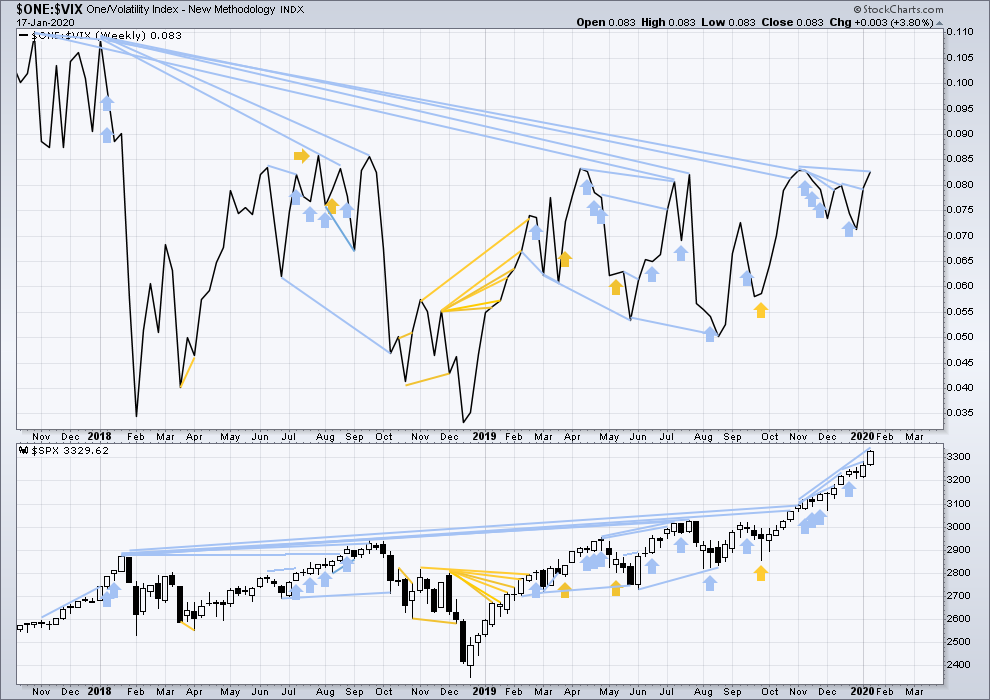
Click chart to enlarge. Chart courtesy of StockCharts.com. So that colour blind members are included, bearish signals
will be noted with blue and bullish signals with yellow.
The all time high for inverted VIX was on 30th October 2017. There is now over two years of bearish divergence between price and inverted VIX.
The rise in price is not coming with a normal corresponding decline in VIX; VIX remains elevated. This long-term divergence is bearish and may yet develop further as the bull market matures.
This divergence may be an early warning, a part of the process of a top developing that may take years. It may is clearly not useful in timing a trend change from bull to a fully fledged bear market.
Last week price and inverted VIX have both moved higher. Price is making new highs, but there remains all of short, mid and long-term bearish divergence with inverted VIX. Short-term divergence is weakened this week.
DAILY CHART
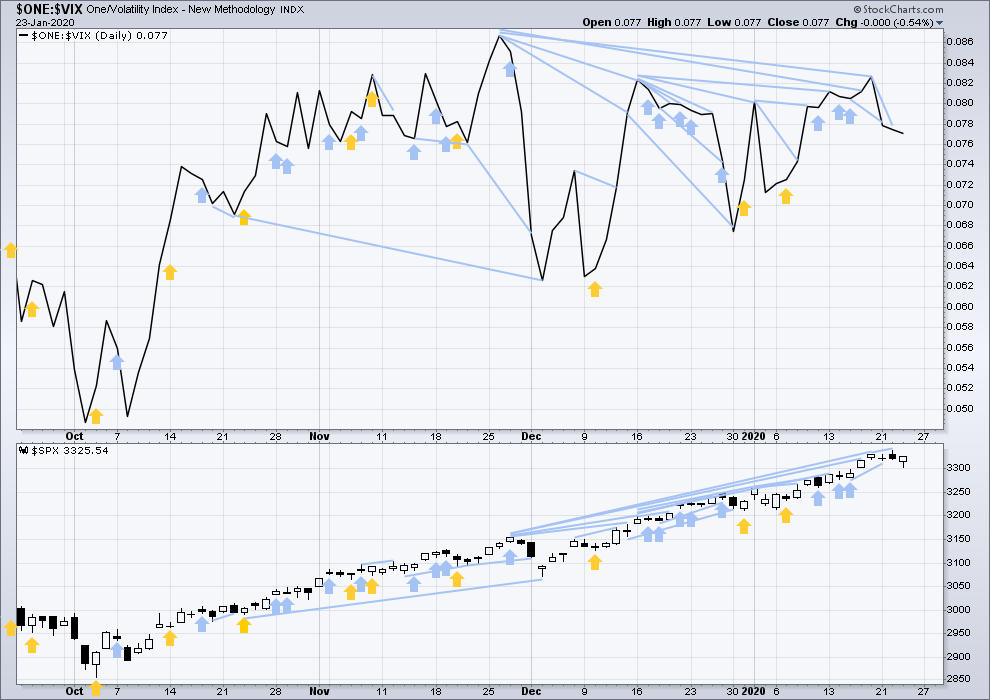
Click chart to enlarge. Chart courtesy of StockCharts.com. So that colour blind members are included, bearish signals
will be noted with blue and bullish signals with yellow.
Today both price and inverted VIX have moved lower. There is no new divergence.
There is now a strong cluster of bearish divergence between price and VIX adding to the warning that a pullback or consolidation may develop sooner rather than later.
DOW THEORY
Dow Theory confirmed a bear market in December 2018. This does not necessarily mean a bear market at Grand Super Cycle degree though; Dow Theory makes no comment on Elliott wave counts. On the 25th of August 2015 Dow Theory also confirmed a bear market. The Elliott wave count sees that as part of cycle wave II. After Dow Theory confirmation of a bear market in August 2015, price went on to make new all time highs and the bull market continued.
DJIA: 23,344.52 – a close on the 19th of December at 23,284.97 confirms a bear market.
DJT: 9,806.79 – price has closed below this point on the 13th of December.
S&P500: 2,532.69 – a close on the 19th of December at 2,506.96 provides support to a bear market conclusion.
Nasdaq: 6,630.67 – a close on the 19th of December at 6,618.86 provides support to a bear market conclusion.
With all the indices having moved higher following a Dow Theory bear market confirmation, Dow Theory would confirm a bull market if the following highs are made:
DJIA: 26,951.81 – a close above this point has been made on the 3rd of July 2019.
DJT: 11,623.58 – to date DJT has failed to confirm an ongoing bull market.
S&P500: 2,940.91 – a close above this point was made on the 29th of April 2019.
Nasdaq: 8,133.30 – a close above this point was made on the 26th of April 2019.
Published @ 08:35 p.m. EST.
—
Careful risk management protects your trading account(s).
Follow my two Golden Rules:
1. Always trade with stops.
2. Risk only 1-5% of equity on any one trade.
—
New updates to this analysis are in bold.
This morning the alternate is looking a bit more likely. I had expected minor 4 to begin with strength, but that’s not always how deeper corrections or consolidations begin.
Both counts remain valid.
Here’s the alternate updated. Minor 4 may find support about the lower edge of the blue channel.
And here’s the main hourly count updated.
Subminuette iv may be a double zigzag. The second zigzag labelled micro Y may or may not be complete. On the five minute chart it looks like it may need one final low to complete it.
Lara:
Wave i (orange) from the top yesterday is clearly in 3 waves.
Doesn’t this advocate for the bullish case: i-orange is a wave W, and the SPX is in the process of terminating a W-X-Y correction?
At the 5 minute time frame I see in SPX a flat off the ATH, 3 down, 3 up, and now a 5 down in progress (in v down of it now). If that’s correct, could be “it” re: a correction per Lara’s incomplete minor 3 model. Or could be W of a much larger in time and price combination per the complete minor 3 model.
Here’s my more bullish alternative that has SPX in minute iv here, and the target low range for that minute iv.
That depends upon what time frame you’re looking at. It can subdivide as either a three or a five, looks best as a three on the hourly chart but on the five minute chart it can be either a three or a five.
This particular market doesn’t always have good proportions so I’ve learned to be open to checking subdivisions at different time frames and considering both possibilities. I’m letting classic TA guide the wave count quite a lot for this market.
A view of RUT using IWM (that has volume data), showing the volume profile. Price current in the middle of a high volume node. Giant valley to cross below to get to the next one. My main count has this not happening…but I have alternative that has RUT starting a minor 4 now and going down to the 1600 range.
My alternative RUT count (which is aligned with Lara’s main for SPX).
And my main (though at this point I view the two as about equal probability).
Hey Kevin, did they shake you out?!! 😀
I think Kevin said he was above ATH, so I think he should be good:)
Great question Verne!!!
Truth is…if my alarm had gone off when it should have, I might have been!!! But I got to my computer 45 minutes after market open…and by then it had sold off enough that I was good!!! Sometimes ya get lucky, ya know?
Sweet! I was ready for the feint and played it beautifully…massively shorted the bounce…!
thanks verne !
Well, we certainly have some degree of correction in play here now.
My view is to assume lower degree (minuette, perhaps minute) and let the market prove to me it’s larger (minor). Consistent with that, my first play is a short term bear put spread for next Friday in SPY (335.5/332). And maybe I’ll buy some further out (mid Feb or even later) OOM puts in case we get some real selling next week.
Both main and alternative count stay intact for now until one or the other invalidation happen. But so far alternate count seems going its way. It ran close to ATH this morning, broke 76.4% to get those stops and reverted back to continue wave III (as alternate count shows) down. If not, then why would it stop short of breaking ATH today? Looks like simple market maker move to get all the stops to move down.
And note we finally have a nominal “risk off” day: equity markets broadly down, gold strongly up, bonds strongly up, oil strongly down. Been a long time since one of these.
I was going through some old charts on NDASDAQ from 2000. Interesting enough when NASDAQ was hitting 5000 fed rate was at 4.5% range. Now we have NASDAQ hitting 9,000 when rates are 1.6%ish. we all know how fast that correction happened.
Now given the current FED is unlikely to do anything to bring reality in the markets ( under pressure or intentionally) and as recently it was projected that DOW might have another 5,000 points run ahead…I am almost wondering if the real correction might not unfold sometime past next 18 months with NASDAQ well over 11,000 and S&P 4,000 plus. Unreal but nothing seems to affect this market or dampen the extreme bullishness.
Just FYI- while the number of EPS beats is consistent with previous quarters (after analysts reduced their estimated going into the quarter by -4%), this Q is the fourth in a row with negative S&P 500 earnings projections (-2.1% as of last week). So unless reporting doesn’t improve that picture, that would be the very first time since Great Recession when 4 quarters in a row we have negative earnings growth. Something has to give at one point- market thinks that it will go to positive growth, but the question – will it?
There is so much bullishness and desire to keep the markets ramping higher that it makes it hard to imagine a correction no matter what the news is. Hence, it will be not a surprise if the target threshold of 3477 is taken out and the march ahead continues…
If you noticed yet, so far the long term decade long trend line resistance was not taken out and proved to be a very strong one. Yes, it breaches through it during a day session but then immediately comes back. If it holds true, it would take a whole year for the market to reach 3477 at this pace if it doesn’t break this trend line. So correction is more than expected.
That’s exactly what they want you to think. Do you remember Dec’18 when people were saying that it should be over soon but it didn’t and kept going down. By the time majority threw out the white flag, the market reversed and started its ascend. The market cannot make big moves until majority is on the wrong side. Same happening here- just the fact that you are throwing the white flag by looking how resistant that market to the small drops, that’s when it finally starts to move. Majority doesn’t believe correction is coming. And today is a perfect example. You cannot make money if you are a follower. You have to be in front of it. That’s why I really enjoy Lara’s comments and updates. Yes, they are off sometimes, but in general, in terms of watching out for turns and changes, this service is invaluable. She does such an amazing job. Thank you, Lara.
My $0.02: Lara’s work is never “off”, by definition.
EW analysis is not about being right. It’s about probabilities for the structure of future price action. Just as in poker, the right play probabilistically may be to go all in, or to call. And you still may lose. But you were not “wrong”. An EW model calling for short term up or down price movement may not match what happens; that does not make it “wrong”.
Even the very high probability scenarios (those times there is only one main daily and one main hourly) can sometimes represent what does not actually play out. 90% chance for example means just that: 10% of the time, the “other thing” happens.
Good point, Kevin
(Bloomberg) — Fewer U.S. companies are topping earnings estimates this
quarterly reporting season with Industrials and Materials sectors among the
biggest laggards.
Of the 71 companies in Standard & Poor’s 500 that have announced results in
the fourth quarter, 69% have posted better-than-expected earnings as compared
with 78% for the whole season a year ago, according to data compiled by
Bloomberg. About 23% missed analyst EPS estimates, compared with 14% a year ago.
Companies missed revenue estimates 10% of the time, while 34% topped. That
compared with 20% and 37% respectively a year ago. The blue-chip index has
gained 5.8% since the start of the current earnings season.
Thanks!
Lara’s updated main hourly count looks most likely to my eye at the moment. Hopefully tomorrow’s price action will help confirm one or the other.
Excellent modification on the (new) hourly main count. I noticed that matching 2-4 pair late today myself.
Still suspicious we might be in minute iii not v, but that can only be decided by future correction structure. Momentum and the extending structure are iii-ish.
But for now it’s…TO INFINITY…AND BEYOND!!! Or, if you prefer “Up, up and AWAAAAY!!!”. Obviously serious $’s flowing in. Last I heard earnings were coming in with 80%+ beating expectations (which were probably driven down a bit by concerns re: slowdown/recession that has receded). If anyone has an update to that # please share it.
I suspect when FED news about how they have been quitely withdrawing from the repo becomes clear next week, market will react.
As I previously said- the only time when market reacts drastically to anything is after FED meetings. I don’t see any other catalysts- FED brought this market up and it can bring it down the same way – sell on news event, or rather no news, most probably.
No. 1 position again
Pride go-eth before a fall.