
Another new all time high today reaches the next target and slightly exceeds it.
Summary: The next target is at 3,379.
It is again possible that minor wave 3 could be over. Some confidence in this view may be had with a new low below 3,316.61 and then a breach of the narrow best fit channel on the hourly charts. The risk of a larger pullback or consolidation beginning here or very soon is now high.
Three large pullbacks or consolidations (fourth waves) during the next 1-2 years are expected: for minor wave 4 (coming soon, possibly just begun), then intermediate (4), and then primary 4.
The biggest picture, Grand Super Cycle analysis, is here.
Last monthly charts analysis is here with video here.
ELLIOTT WAVE COUNTS
FIRST WAVE COUNT
WEEKLY CHART
Click chart to enlarge.
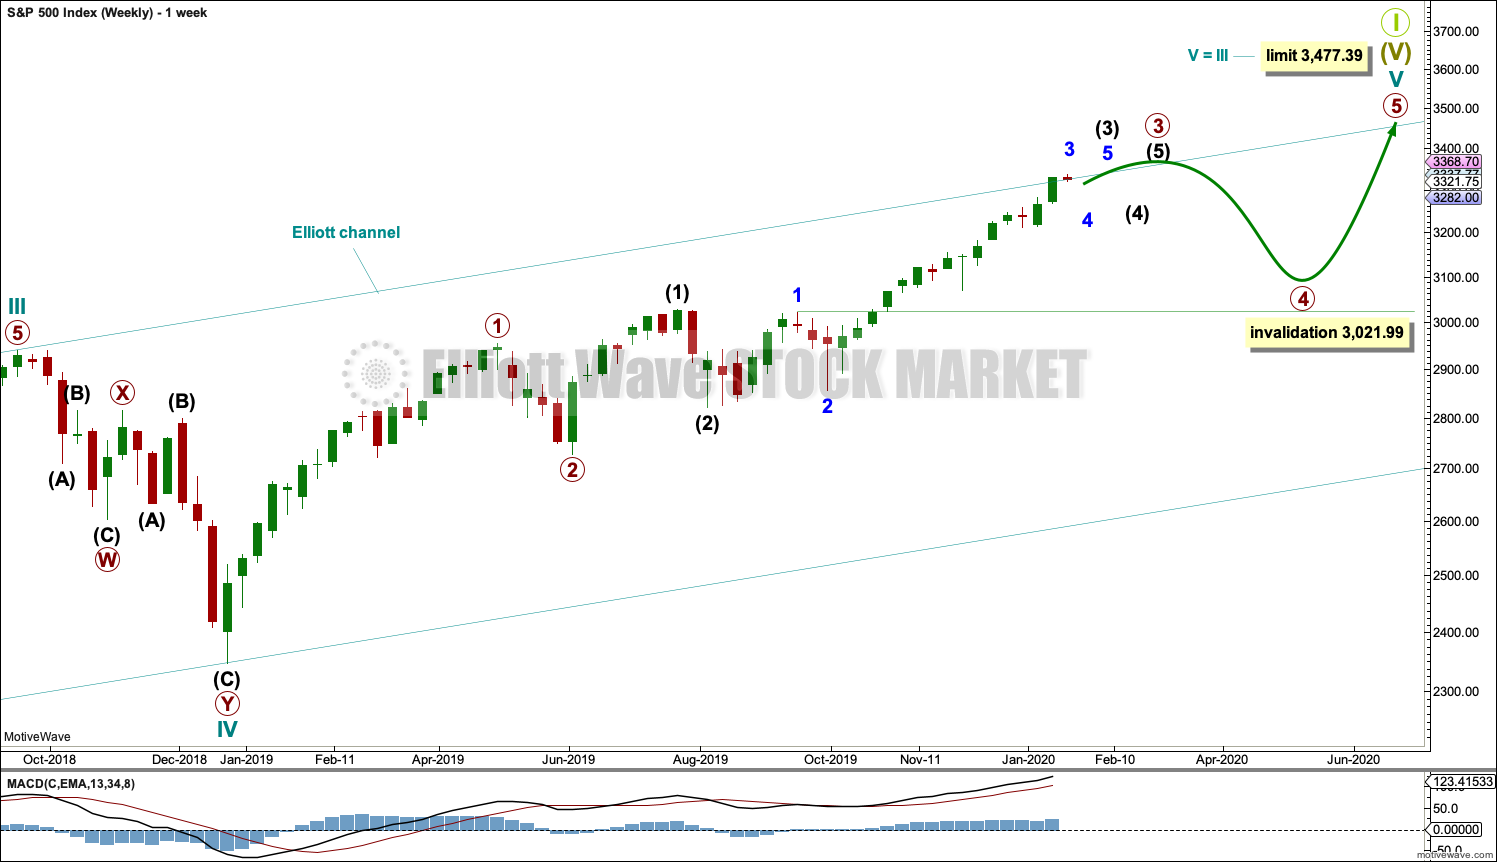
Cycle wave V may subdivide either as an impulse or an ending diagonal. Impulses are much more common, and it is clear at this stage that cycle wave V is an impulse and not a diagonal.
At this stage, cycle wave V may take another one to two or so years to complete.
A channel is drawn about the impulse of Super Cycle wave (V) using Elliott’s first technique. Draw this channel first from the high of 2,079.46 on the 5th of December 2014 to the high of 2,940.91 on the 21st of September 2018, then place a parallel copy on the low at 1,810.10 on the 11th of February 2016. Cycle wave IV found support about the lower edge.
Within Super Cycle wave (V), cycle wave III may not be the shortest actionary wave. Because cycle wave III is shorter than cycle wave I, this limits cycle wave V to no longer than equality in length with cycle wave III at 3,477.39. A new high by any amount at any time frame above this point would invalidate this main wave count in favour of one of the two alternate wave counts in the monthly chart analysis which are much more bullish.
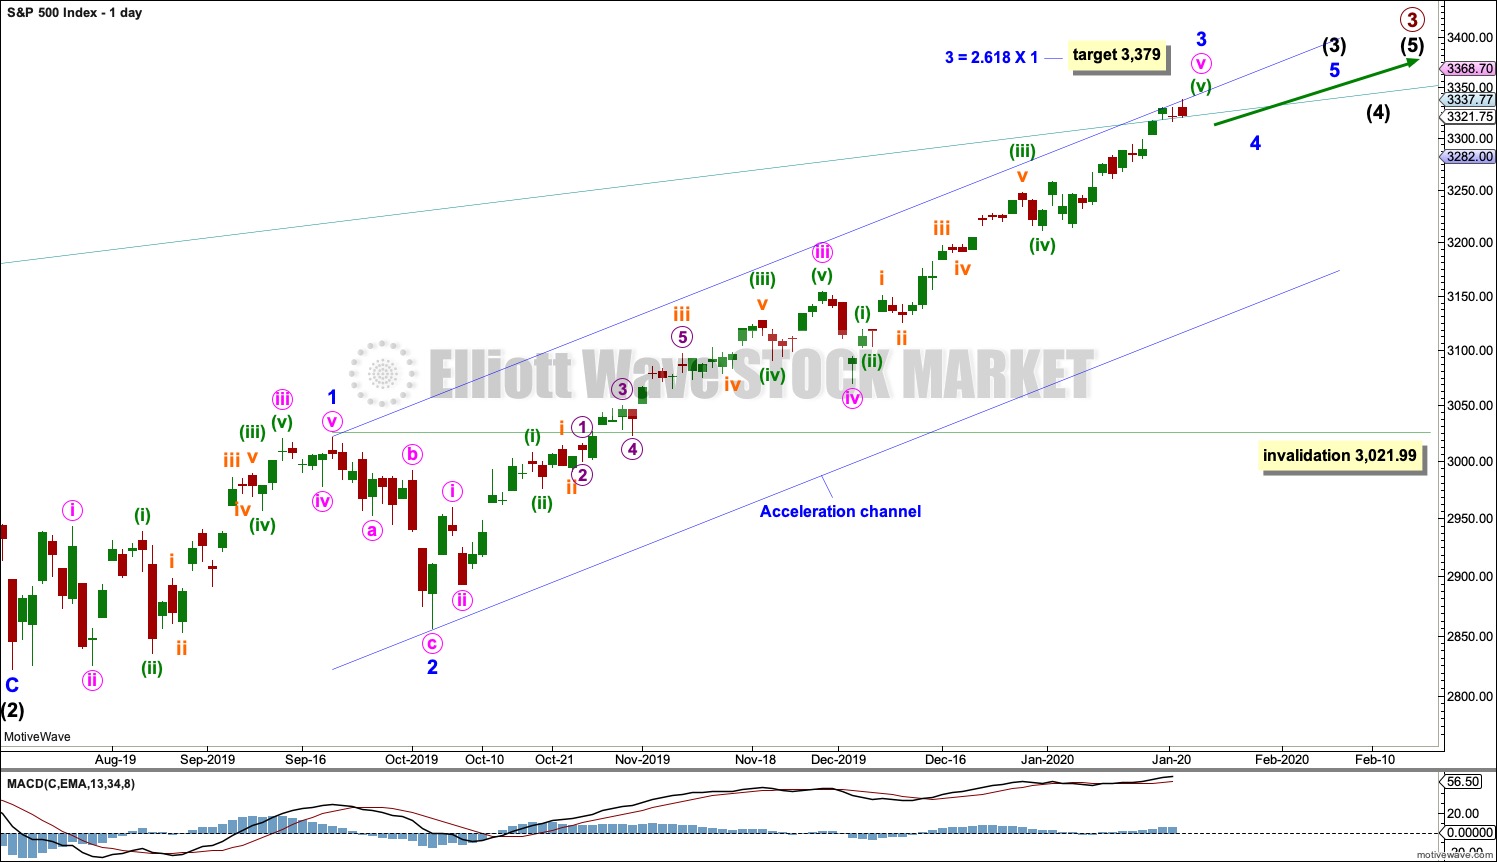
The daily chart below will focus on movement from the end of intermediate wave (2) within primary wave 3.
Within cycle wave V, primary waves 1 and 2 may be complete. Within primary wave 3, intermediate waves (1) and (2) may be complete. Within the middle of intermediate wave (3), minor wave 4 may not move into minor wave 1 price territory below 3,021.99.
Within cycle wave V, the corrections of primary wave 2, intermediate wave (2) and minor wave 2 all show up clearly on the weekly chart. For cycle wave V to have the right look, the corresponding corrections of minor wave 4, intermediate wave (4) and primary wave 4 should also show up on the weekly chart. Three more large multi-week corrections are needed as cycle wave V continues higher, and for this wave count the whole structure must complete at or before 3,477.39.
DAILY CHART
Click chart to enlarge.
All of primary wave 3, intermediate wave (3) and minor wave 3 may only subdivide as impulses.
Minor wave 3 has passed 1.618 the length of minor wave 1, and within it minute wave v has passed equality in length with minute wave i. The next possible target for minor wave 3 may be at 3,332 where minute wave v would reach equality in length with minute wave iii.
If price reaches up to this next target and either the structure is incomplete or price keeps rising, then a next higher target may be at 3,379 where minor wave 3 would reach 2.618 the length of minor wave 1. This would require the target for primary wave 3 to also be recalculated.
When minor waves 3 and 4 may be complete, then a target will again be calculated for intermediate wave (3).
Minor wave 2 was a sharp deep pullback, so minor wave 4 may be expected to be a very shallow sideways consolidation to exhibit alternation. Minor wave 2 lasted 2 weeks. Minor wave 4 may be about the same duration, or it may be a longer lasting consolidation. Minor wave 4 may end within the price territory of the fourth wave of one lesser degree; minute wave iv has its range from 3,154.26 to 3,070.49. However, this target zone at this stage looks to be too low.
Minor wave 4 may not move into minor wave 1 price territory below 3,021.99.
Intermediate wave (3) has now moved far enough above the end of intermediate wave (1) to allow intermediate wave (4) to unfold and remain above intermediate wave (1) price territory.
Draw an acceleration channel now about intermediate wave (3): draw the first trend line from the end of minor wave 1 to the last high, then place a parallel copy on the end of minor wave 2. Keep redrawing the channel as price makes new highs. Minor wave 4 may find support at the lower edge of this channel if it is long lasting or deep enough.
Price is now above the upper edge of the wide teal channel copied over from monthly and weekly charts. A reaction downwards soon would be a reasonable expectation, but now that price has moved above the channel it may still continue higher for some time as a blow off top forms.
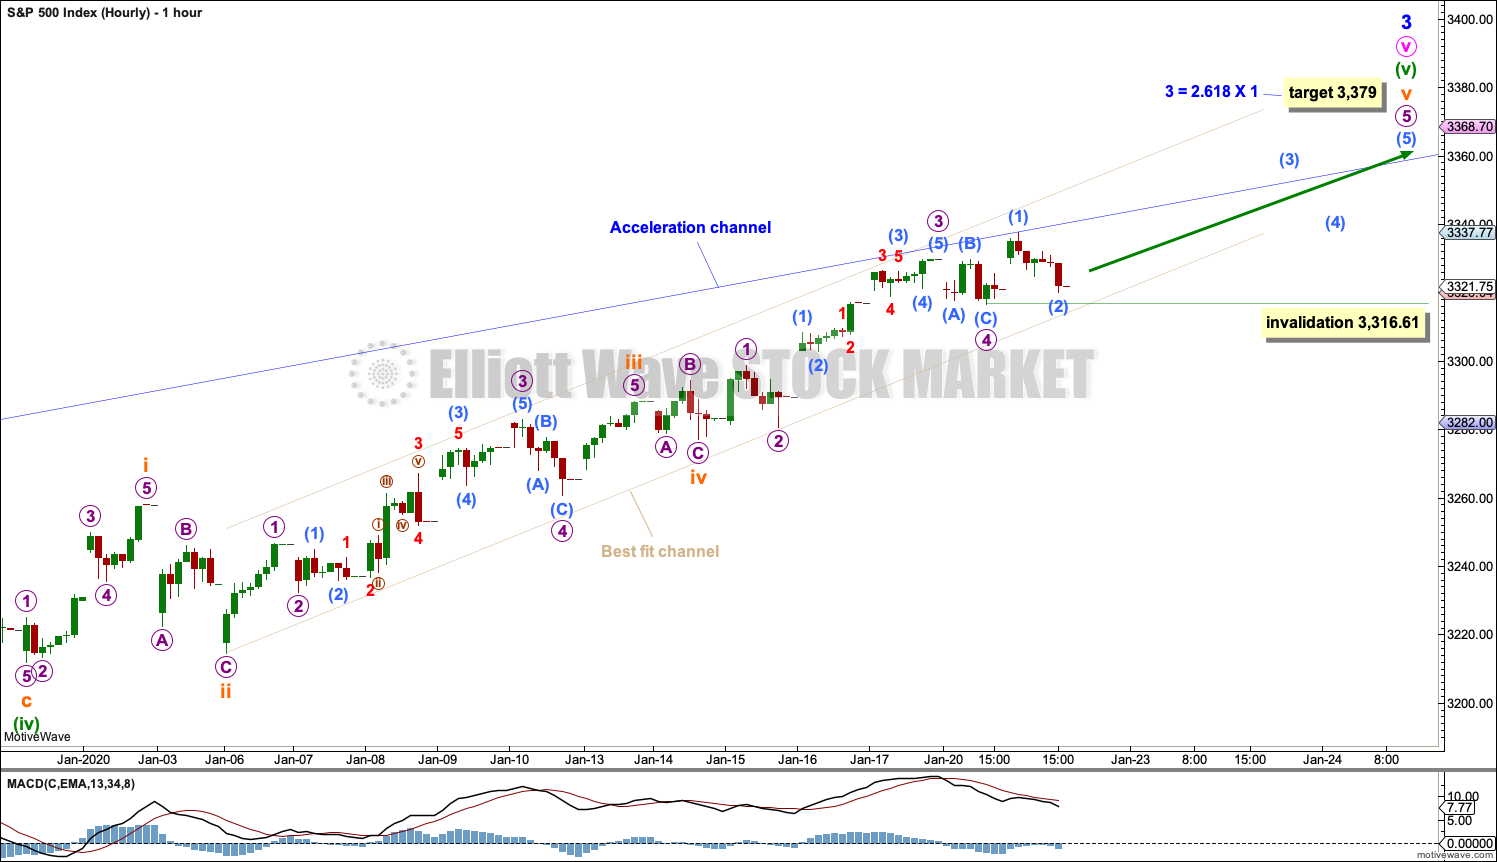
HOURLY CHART
Click chart to enlarge.
It is possible that minor wave 3 may be close to completion.
Subminuette wave v may be almost complete. Within subminuette wave v, micro wave 5 may be extending. Within micro wave 5, sub-micro wave (2) may not move beyond the start of sub-micro wave (1) below 3,316.61.
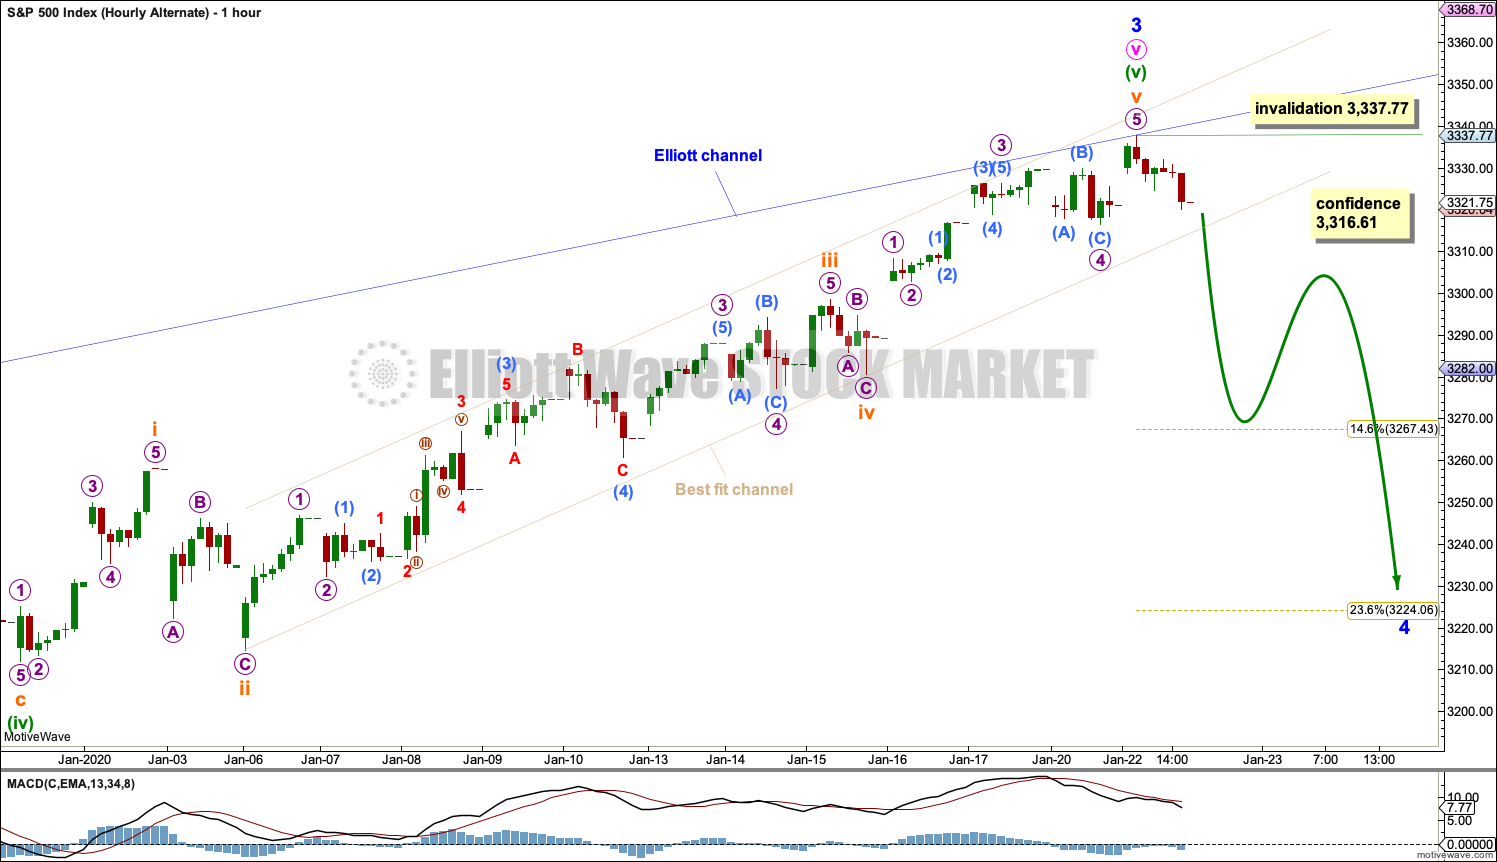
ALTERNATE HOURLY CHART
Click chart to enlarge.
If price breaks below 3,316.61, then assume minor wave 4 has arrived. At that stage, this alternate wave count would increase in probability, but would still not be a certainty.
A breach of the narrow best fit channel, which is today redrawn, would add further confidence that minor wave 4 may have arrived.
A correction to last about two weeks should begin with a five down on the hourly chart.
Within the first five down, no second wave correction may move beyond the start of its first wave above 3,337.77.
Minor wave 4 may end within the price territory of the fourth wave of one lesser degree. Minute wave iv has its range from 3,154.26 to 3,070.49. Within this range is the 0.382 Fibonacci ratio of minor wave 3 at 3,153.72. If this target range is wrong, then it may be too low.
SECOND WAVE COUNT
WEEKLY CHART

Click chart to enlarge.
This second wave count sees all subdivisions from the end of the March 2009 low in almost the same way, with the sole difference being the degree of labelling.
If the degree of labelling for the entirety of this bull market is all moved down one degree, then only a first wave at cycle degree may be nearing an end.
When cycle wave I is complete, then cycle wave II should meet the technical definition of a bear market as it should retrace more than 20% of cycle wave I, but it may end about either the 0.382 or 0.618 Fibonacci Ratios of cycle wave I. Cycle wave II may end close to the low of primary wave II within cycle wave I, which is at 1,810.10. It is also possible that cycle wave II could be fairly shallow and only barely meet the definition of a bear market.
The impulse is still viewed as nearing an end; a fifth wave is still seen as needing to complete higher. This wave count labels it primary wave 5. Primary wave 5 may still need another year to two or so to complete, depending upon how time consuming the corrections within it may be.
Primary wave 5 may be subdividing as an impulse, in the same way that cycle wave V is seen for the first weekly chart.
TECHNICAL ANALYSIS
WEEKLY CHART
Click chart to enlarge. Chart courtesy of StockCharts.com.
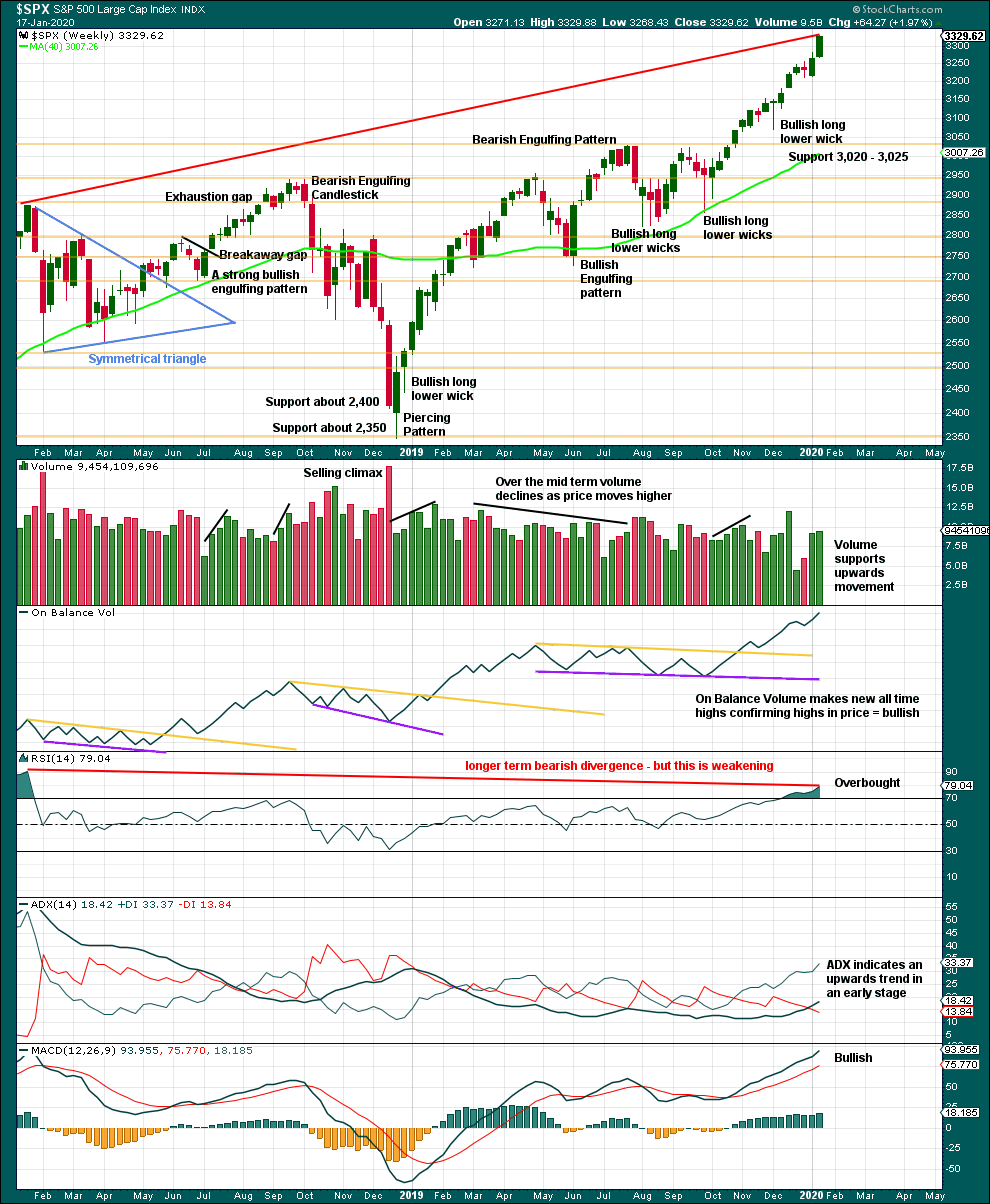
It is very clear that the S&P is in an upwards trend and the bull market is continuing. Price does not move in straight lines; there will be pullbacks and consolidations along the way.
This chart is overall bullish. There are no signs of short-term weakness in upwards movement.
RSI is now overbought. That does not mean upwards movement must end here, because it can continue for several weeks while RSI reaches more extreme. RSI reaching overbought is a warning that conditions are now becoming extreme. A pullback or consolidation will follow and the longer conditions are extreme the closer this will be. However, assume the trend remains the same until proven otherwise. This warning should be heeded by careful attention to risk management.
Last week again completes a strong bullish candlestick with some support from volume. The trend remains upwards, for now.
DAILY CHART
Click chart to enlarge. Chart courtesy of StockCharts.com.
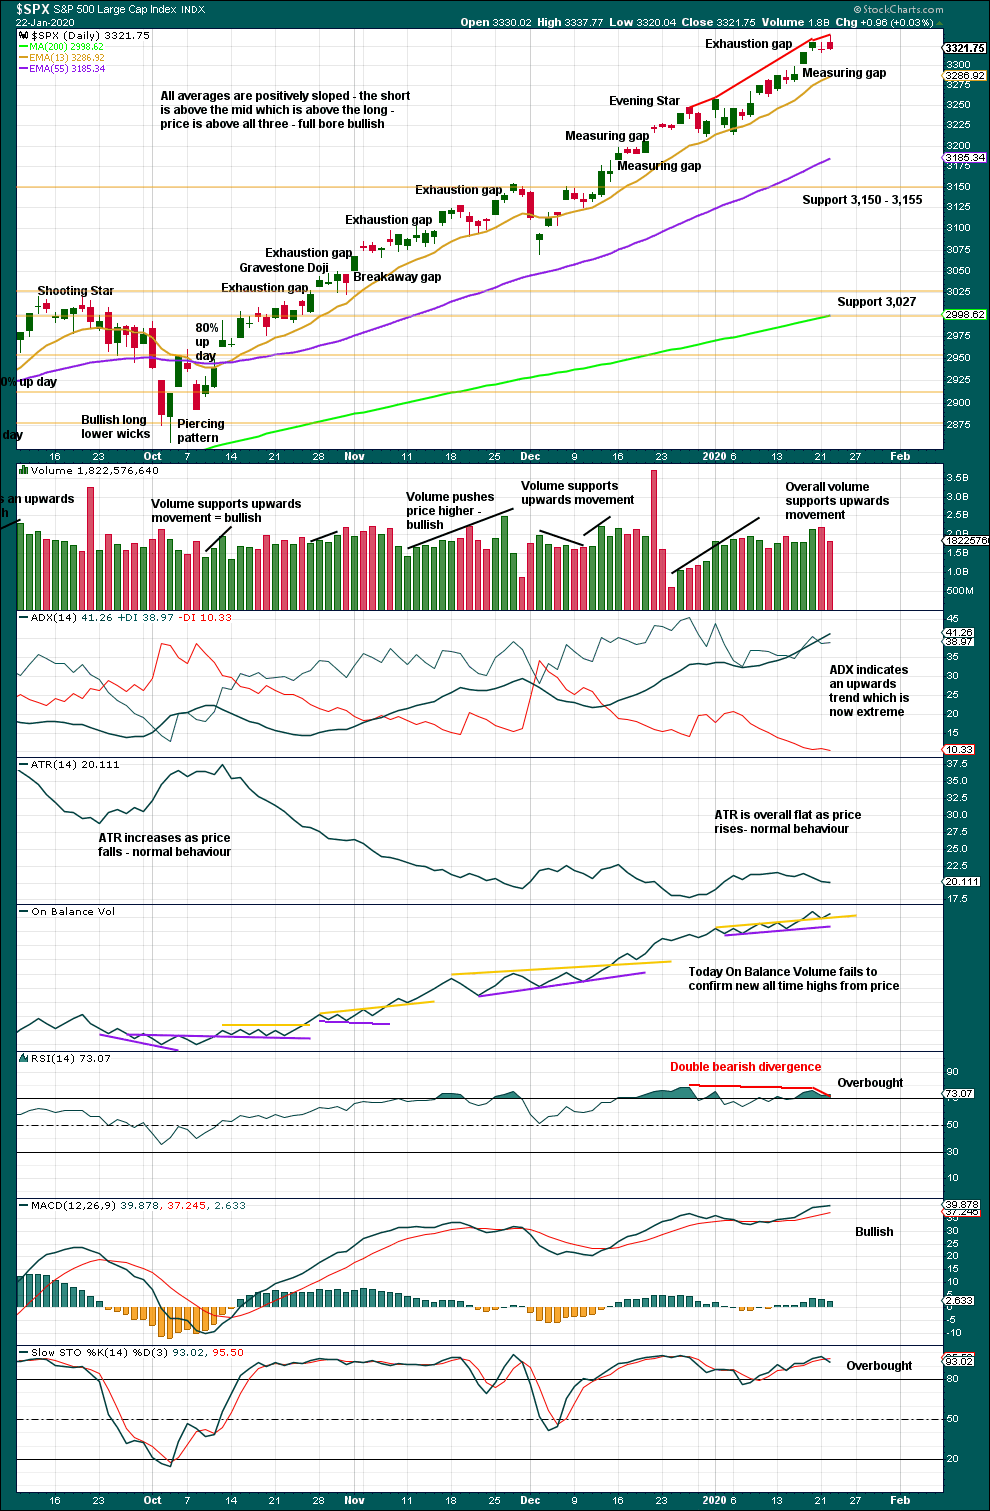
There is an upwards trend in place. There will be corrections along the way.
Like the weekly chart, this chart is bullish.
RSI now again exhibits double bearish divergence. With the data in hand today, there is further weakness exhibited by this divergence and while conditions are extreme this may be an indication that a pullback may arrive here or very soon.
Corrections for this market can sometimes arrive with very little warning. Extreme conditions warrant more careful attention to risk management. Upwards movement could continue yet for a reasonable distance and time, but the risk of a consolidation or pullback is increasing.
A target from the last measuring gap which remains open is at 3,386.85. However, the last gap is now closed, so it is renamed an exhaustion gap.
The warning of a larger pullback or consolidation is now louder with an exhaustion gap, bearish divergence from RSI while overbought, ADX reaching extreme and now bearish signals from On Balance Volume.
BREADTH – AD LINE
WEEKLY CHART
Click chart to enlarge. Chart courtesy of StockCharts.com. So that colour blind members are included, bearish signals
will be noted with blue and bullish signals with yellow.
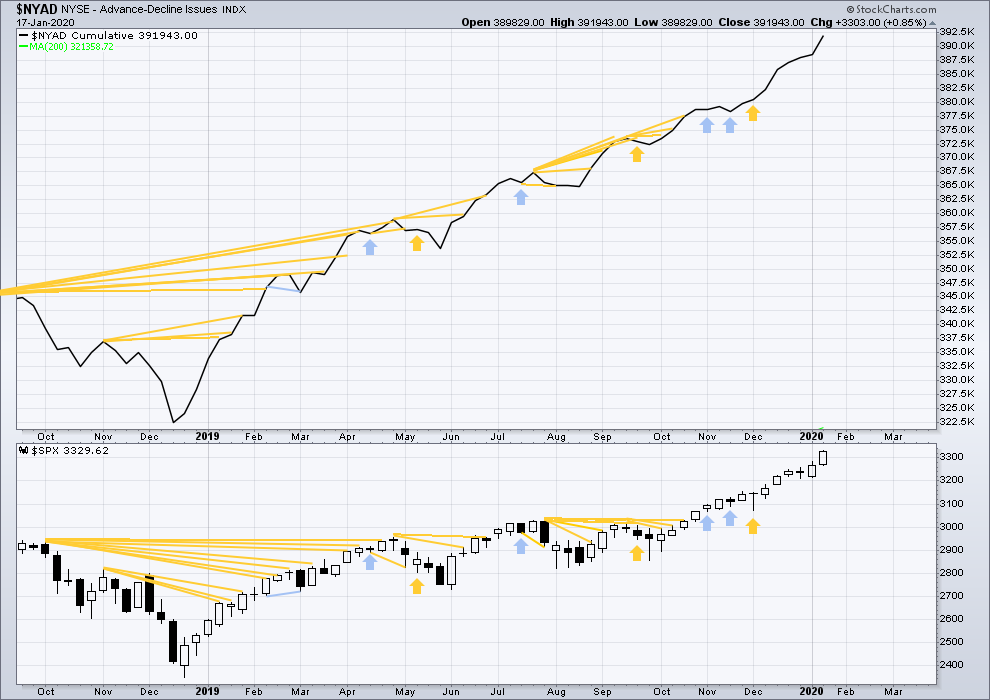
Bear markets from the Great Depression and onwards have been preceded by an average minimum of 4 months divergence between price and the AD line with only two exceptions in 1946 and 1976. With the AD line making new all time highs this week, the end of this bull market and the start of a new bear market is very likely a minimum of 4 months away, which is mid May 2020.
In all bear markets in the last 90 years there is some positive correlation (0.6022) between the length of bearish divergence and the depth of the following bear market. No to little divergence is correlated with more shallow bear markets. Longer divergence is correlated with deeper bear markets.
If a bear market does develop here, it comes after no bearish divergence. It would therefore more likely be shallow.
Again both price and the AD line have made new all time highs. There is no divergence. Upwards movement has support from rising market breadth.
Large caps all time high: 3,337.77 on 22nd January 2020.
Mid caps all time high: 2,106.30 on 17th January 2020.
Small caps all time high: 1,100.58 on 27th August 2018.
For the short term, today there is a little weakness now in only large caps making new all time highs.
DAILY CHART
Click chart to enlarge. Chart courtesy of StockCharts.com. So that colour blind members are included, bearish signals
will be noted with blue and bullish signals with yellow.
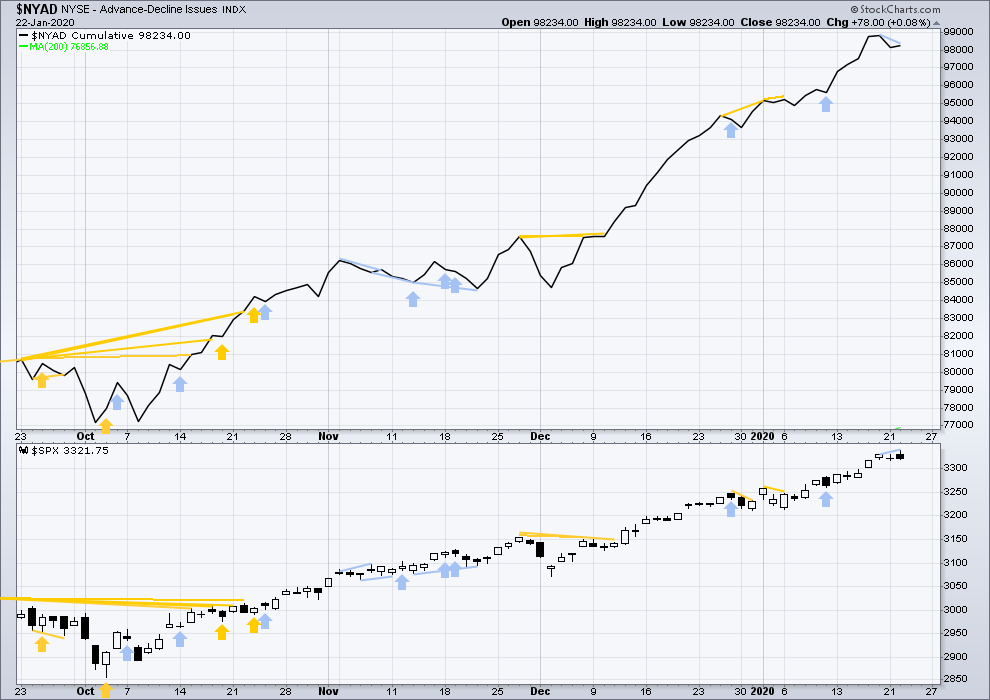
Breadth should be read as a leading indicator.
Today price has moved higher, but the AD line has not. This divergence is bearish.
VOLATILITY – INVERTED VIX CHART
WEEKLY CHART
Click chart to enlarge. Chart courtesy of StockCharts.com. So that colour blind members are included, bearish signals
will be noted with blue and bullish signals with yellow.
The all time high for inverted VIX was on 30th October 2017. There is now over two years of bearish divergence between price and inverted VIX.
The rise in price is not coming with a normal corresponding decline in VIX; VIX remains elevated. This long-term divergence is bearish and may yet develop further as the bull market matures.
This divergence may be an early warning, a part of the process of a top developing that may take years. It may is clearly not useful in timing a trend change from bull to a fully fledged bear market.
Last week price and inverted VIX have both moved higher. Price is making new highs, but there remains all of short, mid and long-term bearish divergence with inverted VIX. Short-term divergence is weakened this week.
DAILY CHART
Click chart to enlarge. Chart courtesy of StockCharts.com. So that colour blind members are included, bearish signals
will be noted with blue and bullish signals with yellow.
Today price has moved higher, but inverted VIX has not. This divergence is bearish.
There is now a strong cluster of bearish divergence between price and VIX adding to the warning that a pullback or consolidation may develop sooner rather than later.
DOW THEORY
Dow Theory confirmed a bear market in December 2018. This does not necessarily mean a bear market at Grand Super Cycle degree though; Dow Theory makes no comment on Elliott wave counts. On the 25th of August 2015 Dow Theory also confirmed a bear market. The Elliott wave count sees that as part of cycle wave II. After Dow Theory confirmation of a bear market in August 2015, price went on to make new all time highs and the bull market continued.
DJIA: 23,344.52 – a close on the 19th of December at 23,284.97 confirms a bear market.
DJT: 9,806.79 – price has closed below this point on the 13th of December.
S&P500: 2,532.69 – a close on the 19th of December at 2,506.96 provides support to a bear market conclusion.
Nasdaq: 6,630.67 – a close on the 19th of December at 6,618.86 provides support to a bear market conclusion.
With all the indices having moved higher following a Dow Theory bear market confirmation, Dow Theory would confirm a bull market if the following highs are made:
DJIA: 26,951.81 – a close above this point has been made on the 3rd of July 2019.
DJT: 11,623.58 – to date DJT has failed to confirm an ongoing bull market.
S&P500: 2,940.91 – a close above this point was made on the 29th of April 2019.
Nasdaq: 8,133.30 – a close above this point was made on the 26th of April 2019.
Published @ 06:30 p.m. EST.
—
Careful risk management protects your trading account(s).
Follow my two Golden Rules:
1. Always trade with stops.
2. Risk only 1-5% of equity on any one trade.
—
New updates to this analysis are in bold.
Kevin,
You short Apple?
Nope. I am short TSLA…but I bail for a very small loss if it goes a single penny over it’s current ATH.
AAPL from my perspective is still mid-set up for a short. Maybe (maybe) forming pivot high structure on the hourly. I might get short at < 315.65, today's low.
Ok Thanks Kevin.
It seems by the action today that minor 3 may not be complete and continue higher.
Yes, it looks like that is quite possible. I’m even mildly concerned about my SPY short via sold call spread expiring tomorrow. I could use another day of sideways/down!
Just roll it. They will try to shake you out tomorrow…
Hourly chart updated:
This may be the main wave count today.
Within the first five down subminuette ii may not move beyond the start of subminuette i.
Do we have confidence?
Not I, not yet. See my chart just below. Price has tagged the middle channel line and gotten very close to the highest support zone in yellow. And turned up a little for the moment. I need to see breakage of that first zone at an absolute minimum, myself. Also, there’s potential for a correction here to be at minute degree, not minor.
I am a bit more confident than Kevin. I think this is the start of Minor 4 to last to the end of January. I will be looking for a low around 3225 for a long position entry.
Then that would mean that Fed meeting on 01/29/20 would start minor 5?
Also pay attention to check coronavirus threat originating from China. Now second city being locked down…this will be a major disruption to all sectors of economies across the globe
Yep. Exactly.
There are only 3 waves down from the top.
You cannot be confident the trend is down until you see 5 waves down.
When you see 5 waves down, patiently wait for a rebound that will retrace the 5 waves…
Good point. I am not confident enough to take a short position.
The time period of the minor 2 was 10 trading days. 4 waves tend to be longer in time and shallower in price.
As for 5 waves down…often. But if a minor 4 plays out as a flat, it would be a 3-3-5 structure, and as a combination, a 3-3-3 structure. So not necessarily.
We’ll see! Waiting for more critical support levels to be broken myself…or alternatively some nice pivot low structure on which to take a long position. The high degree trends are UP and STRONG!
I have enough confidence to take a long position in RUT. I like the bottom structure I see on what appears to be a completion of this little correction. Could be wrong!! Meanwhile, I took a short in BA and TSLA, and holding a sold bear call spread in SPY for tomorrow (should be good unless a very surprising bull run happens in the next 24 hours).
Key structural (not Elliott wave) support levels in /ES that may come into play Thurs/Fri.
I put on a short late in the day Wed via a sold call spread around the highs in /ES, for this Friday. Any downward motion tomorrow (thursday) and I’ll be piling on. As long as someone is going to collect OOM call premium, might as well be me!
The strongest (daily) RSI in the main is in the minute v.
This more bullish alternative has the strongest RSI in the minute iii.
Number Uno…:)
Dos y doh!