All week this analysis has expected more upwards movement as most likely, which is what has happened. The target remains the same.
Summary: The next target is at 3,289.
It is possible that minor wave 3 could be over. Some confidence in this view may be had with a new low below 3,258.14. There is now some weakness developing. The risk of a larger pullback or consolidation beginning here or very soon is now high.
Three large pullbacks or consolidations (fourth waves) during the next 1-2 years are expected: for minor wave 4 (coming soon, possibly just begun), then intermediate (4), and then primary 4.
The biggest picture, Grand Super Cycle analysis, is here.
Monthly charts were last published here, with video here. There are two further alternate monthly charts here, with video here.
ELLIOTT WAVE COUNTS
The two weekly Elliott wave counts below will be labelled First and Second. They may be about of even probability. When the fifth wave currently unfolding on weekly charts may be complete, then these two wave counts will diverge on the severity of the expected following bear market. To see an illustration of this future divergence monthly charts should be viewed.
FIRST WAVE COUNT
WEEKLY CHART
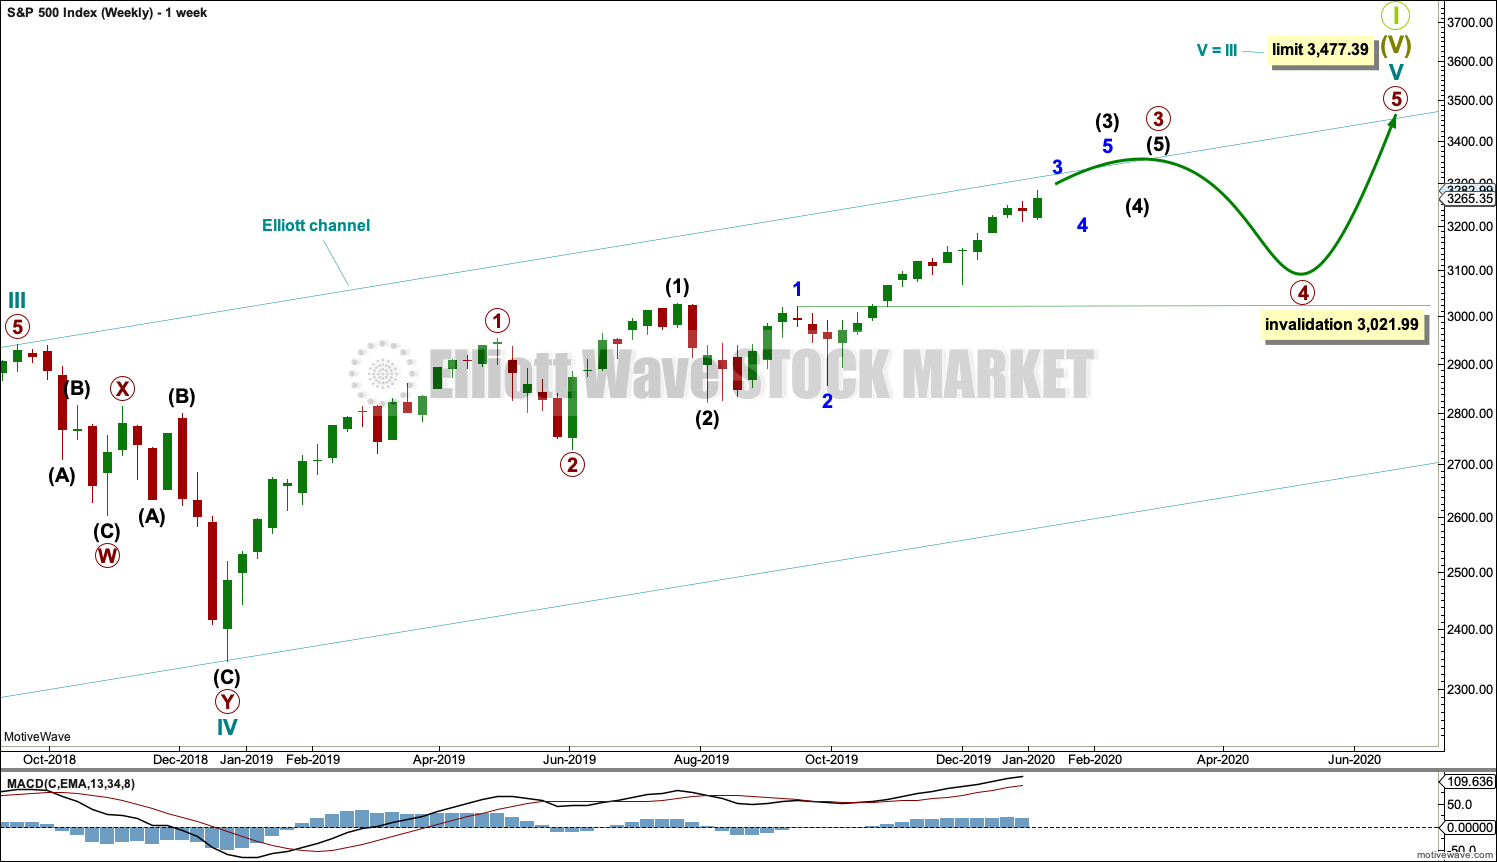
The basic Elliott wave structure consists of a five wave structure up followed by a three wave structure down (for a bull market). This wave count sees the bull market beginning in March 2009 as an incomplete five wave impulse and now within the last fifth wave, which is labelled cycle wave V. This impulse is best viewed on monthly charts. The weekly chart focusses on the end of it.
Elliott wave is fractal. This fifth wave labelled cycle wave V may end a larger fifth wave labelled Super Cycle wave (V), which may end a larger first wave labelled Grand Super Cycle wave I.
The teal Elliott channel is drawn using Elliott’s first technique about the impulse of Super Cycle wave (V). Draw the first trend line from the end of cycle wave I (off to the left of the chart, the weekly candlestick beginning 30th November 2014) to the end of cycle wave III, then place a parallel copy on the end of cycle wave II (off to the left of the chart, the weekly candlestick beginning 14th February 2016). This channel perfectly shows where cycle wave IV ended at support. The strongest portion of cycle wave III, the end of primary wave 3, overshoots the upper edge of the channel. This is a typical look for a third wave and suggests the channel is drawn correctly and the way the impulse is counted is correct.
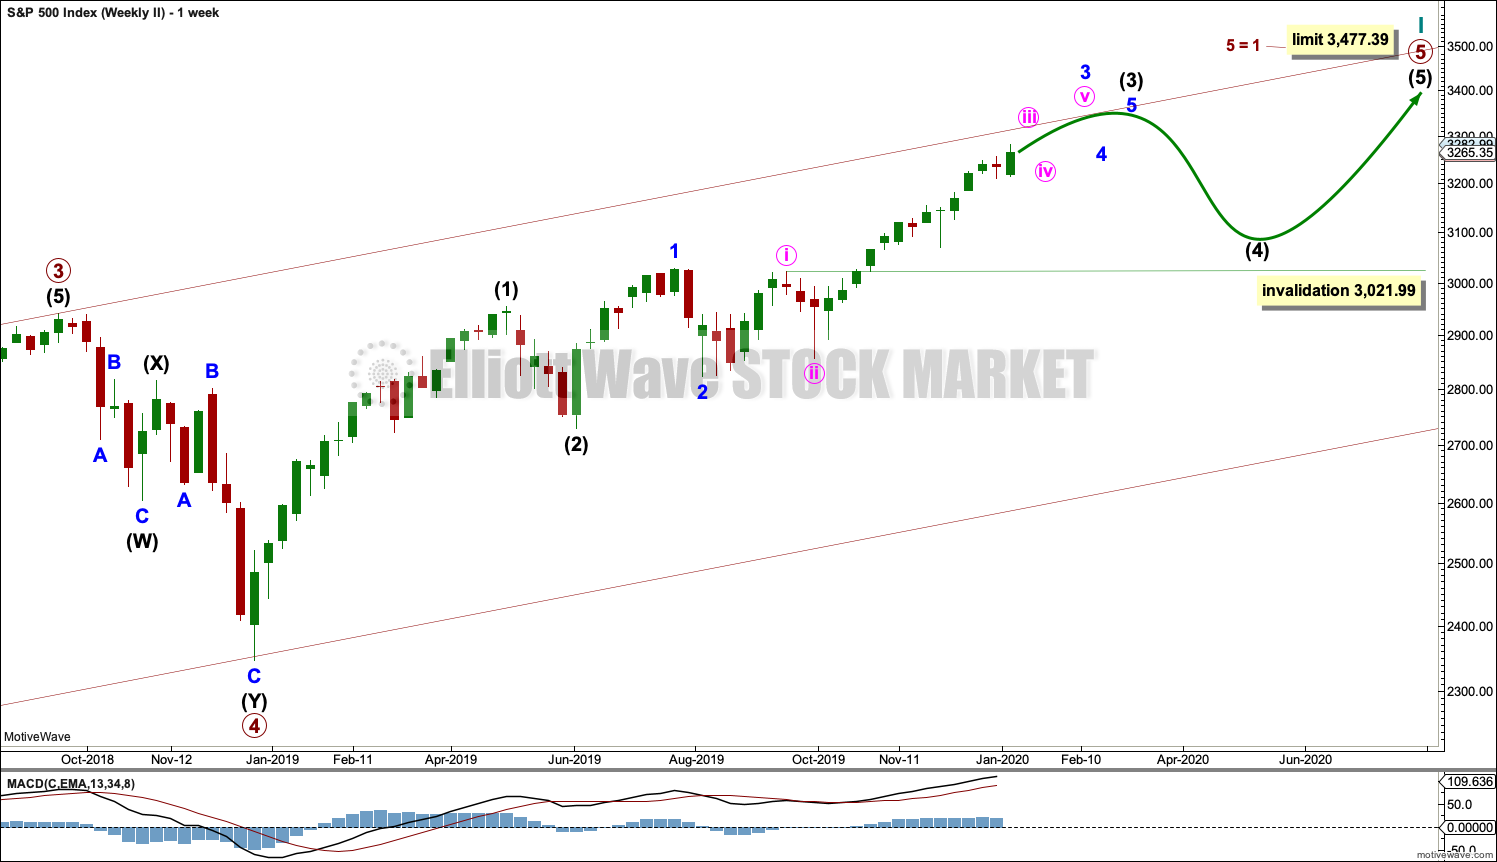
Within Super Cycle wave (V), cycle wave III is shorter than cycle wave I. A core Elliott wave rule states that a third wave may never be the shortest. For this rule to be met in this instance, cycle wave V may not be longer in length than cycle wave III. This limit is at 3,477.39.
Cycle wave V may subdivide either as an impulse or an ending diagonal. Impulses are much more common, and it is clear at this stage that cycle wave V is an impulse and not a diagonal.
At this stage, cycle wave V may take another one to two or so years to complete.
The daily chart below will focus on movement from the end of intermediate wave (2) within primary wave 3.
In historic analysis, two further monthly charts have been published that do not have a limit to upwards movement and are more bullish than this wave count. Members are encouraged to consider those possibilities (links below summary) alongside the wave counts presented on a daily and weekly basis. It is my judgement that the two weekly wave counts published in this analysis have the highest probability, so they shall be the only wave counts published on a daily basis.
Within cycle wave V, primary waves 1 and 2 may be complete. Within primary wave 3, intermediate waves (1) and (2) may be complete. Within the middle of intermediate wave (3), minor wave 4 may not move into minor wave 1 price territory below 3,021.99.
DAILY CHART
All of primary wave 3, intermediate wave (3) and minor wave 3 may only subdivide as impulses.
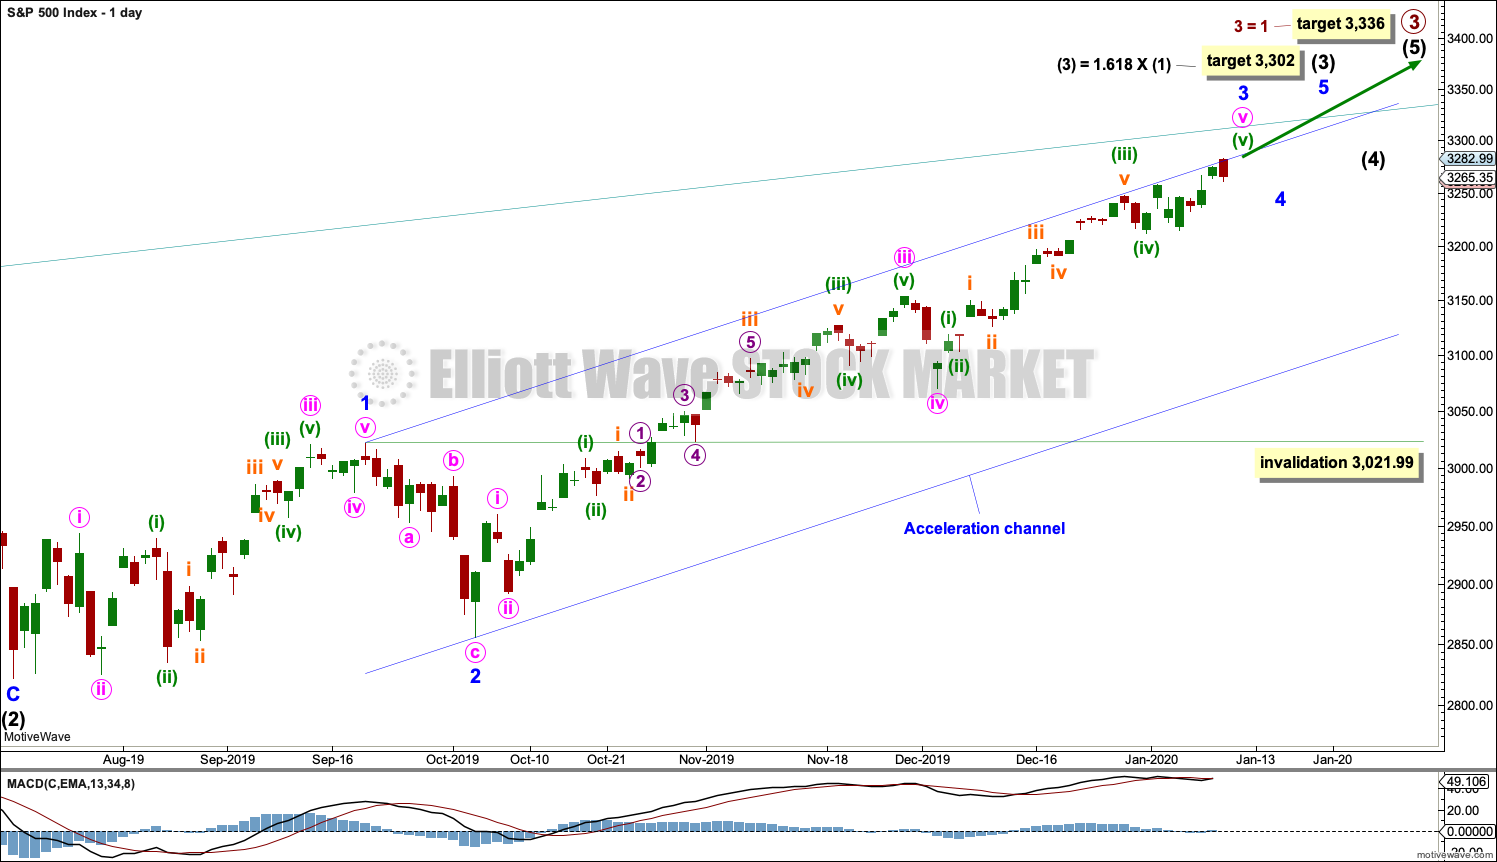
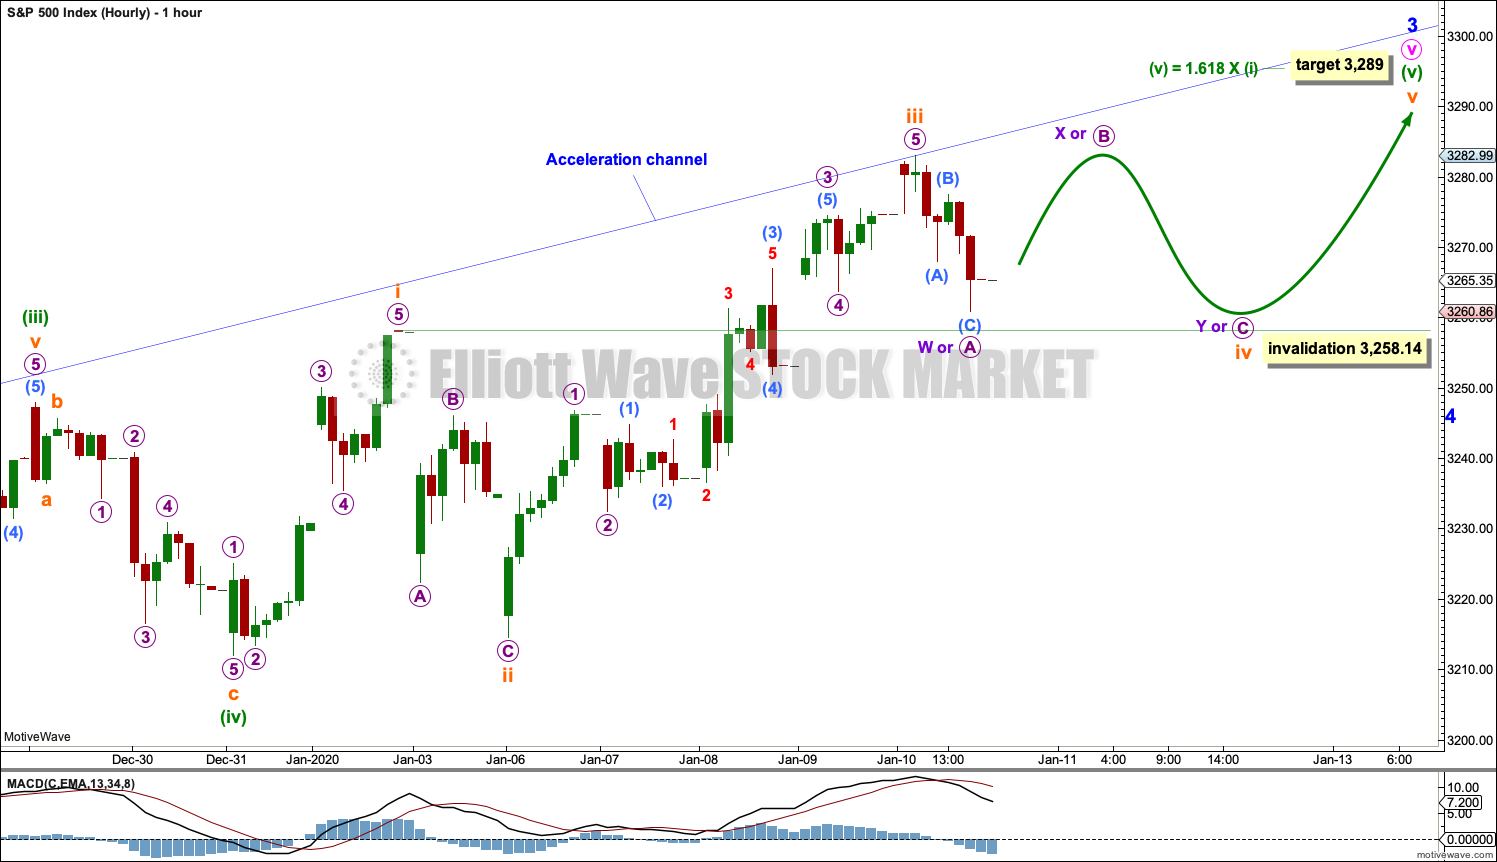
Minor wave 3 has passed 1.618 the length of minor wave 1, and within it minute wave v has passed equality in length with minute wave i. The next target may be now about 3,289 where minuette wave (v) within minute wave v would reach 1.618 the length of minuette wave (i).
Minor wave 2 was a sharp deep pullback, so minor wave 4 may be expected to be a very shallow sideways consolidation to exhibit alternation. Minor wave 2 lasted 2 weeks. Minor wave 4 may be about the same duration, or it may be a longer lasting consolidation. Minor wave 4 may end within the price territory of the fourth wave of one lesser degree; minute wave iv has its range from 3,154.26 to 3,070.49.
Minor wave 4 may not move into minor wave 1 price territory below 3,021.99.
Intermediate wave (3) has now moved far enough above the end of intermediate wave (1) to allow intermediate wave (4) to unfold and remain above intermediate wave (1) price territory.
Draw an acceleration channel now about intermediate wave (3): draw the first trend line from the end of minor wave 1 to the last high, then place a parallel copy on the end of minor wave 2. Keep redrawing the channel as price makes new highs. Minor wave 4 may find support at the lower edge of this channel if it is long lasting or deep enough.
Price is approaching the upper edge of the wide teal channel copied over from monthly and weekly charts. If price gets up to this trend line, then a reaction downwards there would be highly likely.
HOURLY CHART
It is possible that minor wave 3 may be close to completion.
Within minuette wave (v), subminuette waves i through to iii may be complete.
Subminuette wave iv may not move into subminuette wave i price territory below 3,258.14.
Subminuette wave ii lasted 10 hours and shows up on the daily chart. It is possible that subminuette wave iv may also show on the daily chart; it may last a session or slightly longer.
If subminuette wave iv subdivides as any one of a flat, triangle or combination, then the first movement within it should subdivide as a three. This may be complete and is labelled micro wave W or A.
When the first movement of a correction subdivides as a three, then the next movement may make a new price extreme beyond the start of the first. If subminuette wave iv subdivides as either one of an expanded flat, running triangle or combination, then micro wave B or X may make a new price extreme beyond the start of micro wave W or A above 3,282.99.
ALTERNATE HOURLY CHART
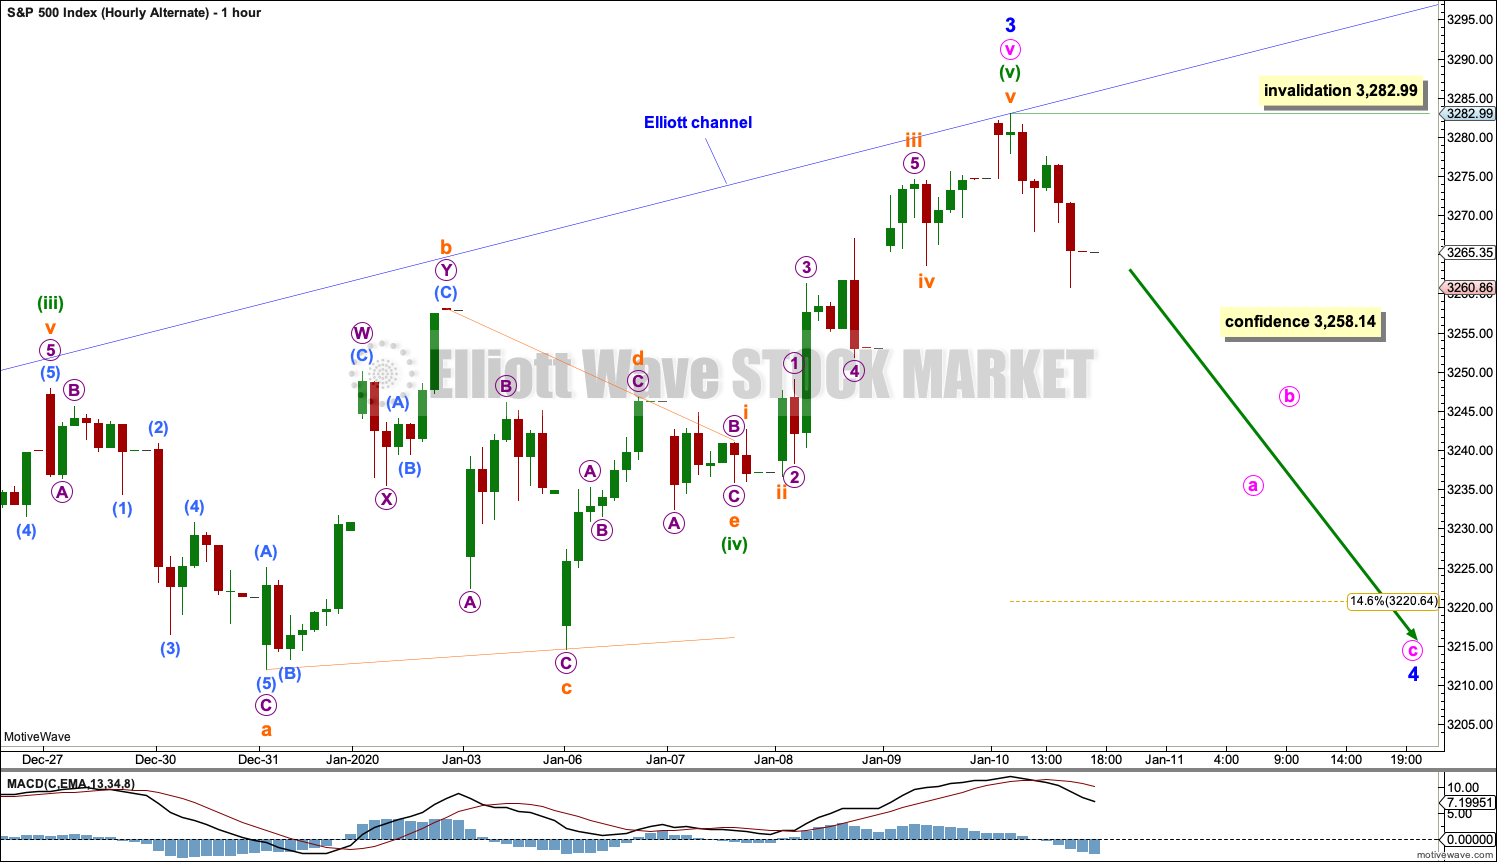
If price breaks below 3,258.14, then assume minor wave 4 has arrived. At that stage, this alternate wave count would increase in probability, but would still not be a certainty.
A correction to last about two weeks should begin with a five down on the hourly chart. Within the start of minor wave 4, no second wave correction may move beyond the start of its first wave above 3,282.99.
Minor wave 4 may end within the price territory of the fourth wave of one lesser degree. Minute wave iv has its range from 3,154.26 to 3,070.49. If this target range is wrong, then it may be too low.
SECOND WAVE COUNT
WEEKLY CHART
This weekly chart is almost identical to the first weekly chart, with the sole exception being the degree of labelling.
This weekly chart moves the degree of labelling for the impulse beginning in March 2009 all down one degree. This difference is best viewed on monthly charts.
The impulse is still viewed as nearing an end; a fifth wave is still seen as needing to complete higher. This wave count labels it primary wave 5. Primary wave 5 may still need another year to two or so to complete, depending upon how time consuming the corrections within it may be.
Primary wave 5 may be subdividing as an impulse, in the same way that cycle wave V is seen for the first weekly chart.
TECHNICAL ANALYSIS
WEEKLY CHART
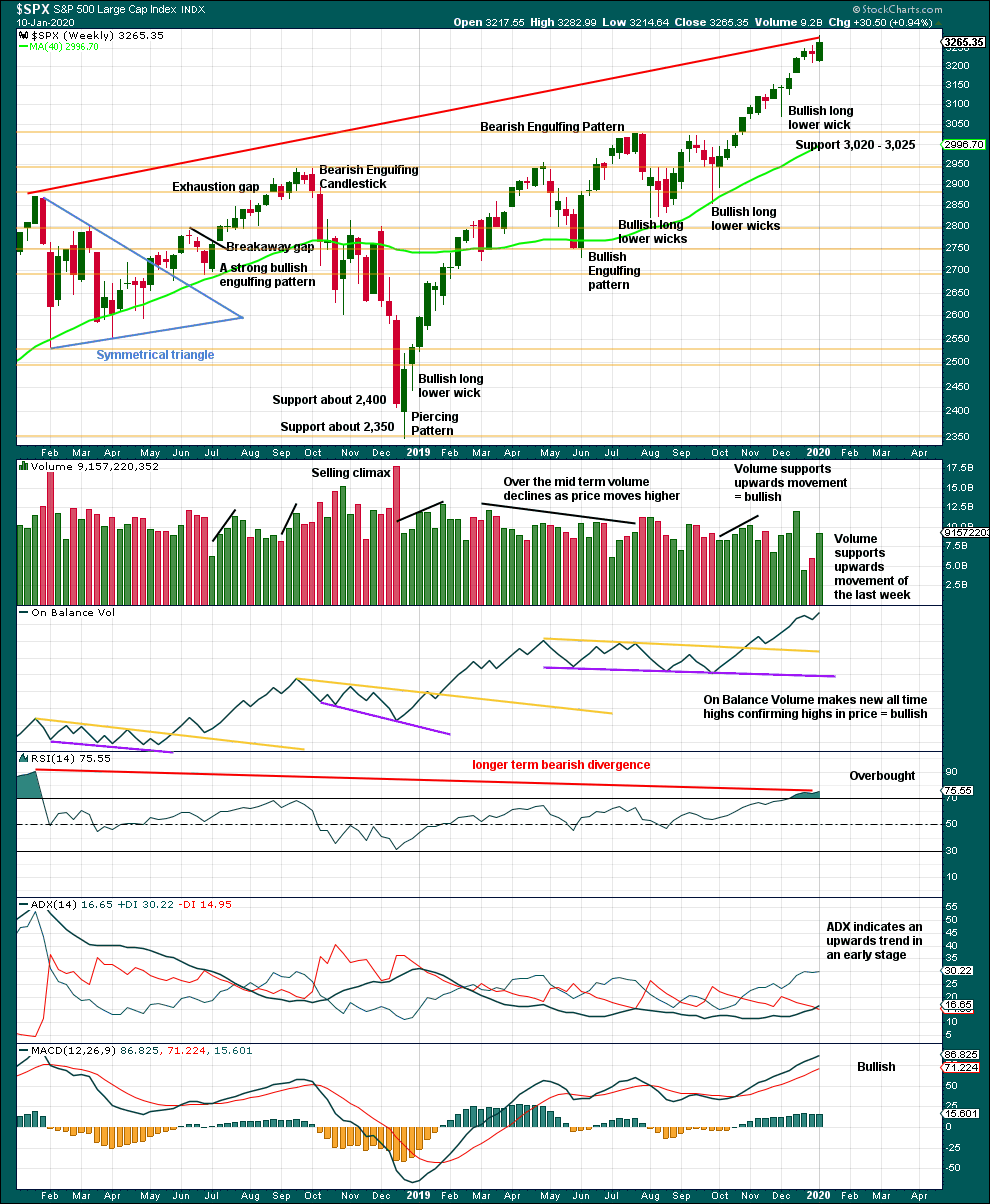
Click chart to enlarge. Chart courtesy of StockCharts.com.
It is very clear that the S&P is in an upwards trend and the bull market is continuing. Price does not move in straight lines; there will be pullbacks and consolidations along the way.
This chart is overall bullish. There are no signs of short-term weakness in upwards movement.
RSI is now overbought. That does not mean upwards movement must end here, because it can continue for several weeks while RSI reaches more extreme. RSI reaching overbought is a warning that conditions are now becoming extreme. A pullback or consolidation will follow and the longer conditions are extreme the closer this will be. However, assume the trend remains the same until proven otherwise. This warning should be heeded by careful attention to risk management.
This week completes a strong bullish candlestick with some support from volume. The trend remains upwards, for now.
DAILY CHART
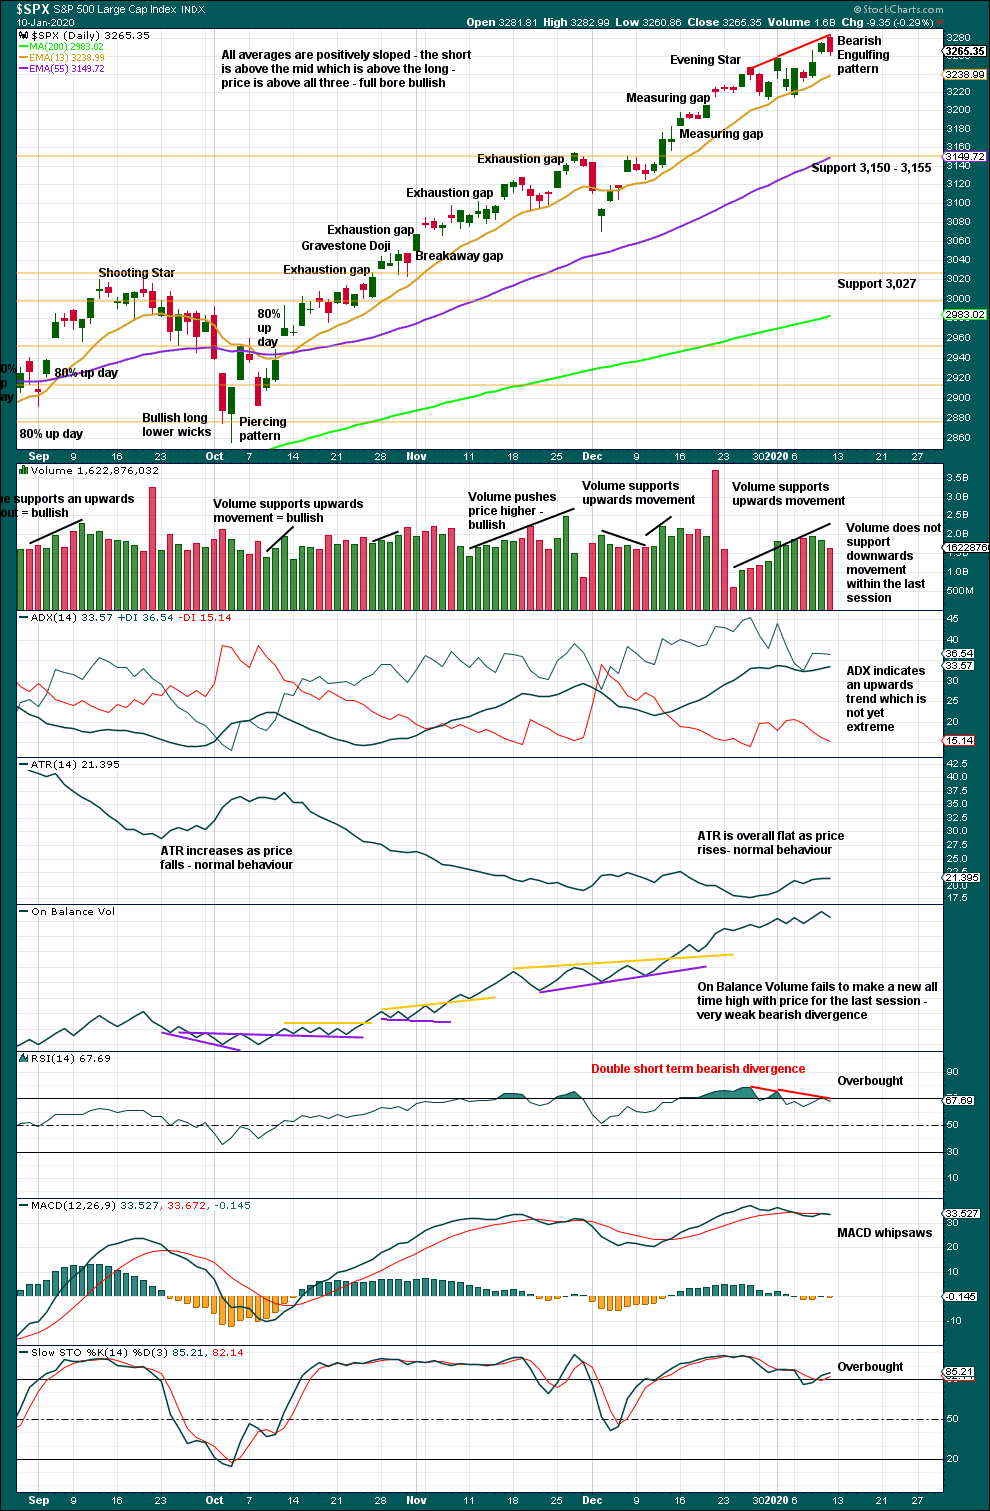
Click chart to enlarge. Chart courtesy of StockCharts.com.
There is an upwards trend in place. There will be corrections along the way.
Like the weekly chart, this chart is bullish.
RSI now exhibits double bearish divergence while overbought. This is often (not always) a warning of a pullback or consolidation to develop. The warning is slightly weakened but still evident.
Lowry’s data shows evidence of weakness in a rise of Selling Pressure by 4 points over the last few sessions. The risk here of a larger pullback or consolidation is increasing.
Corrections for this market can sometimes arrive with very little warning. Extreme conditions warrant more careful attention to risk management. Upwards movement could continue yet for a reasonable distance and time, but the risk of a consolidation or pullback is increasing.
BREADTH – AD LINE
WEEKLY CHART
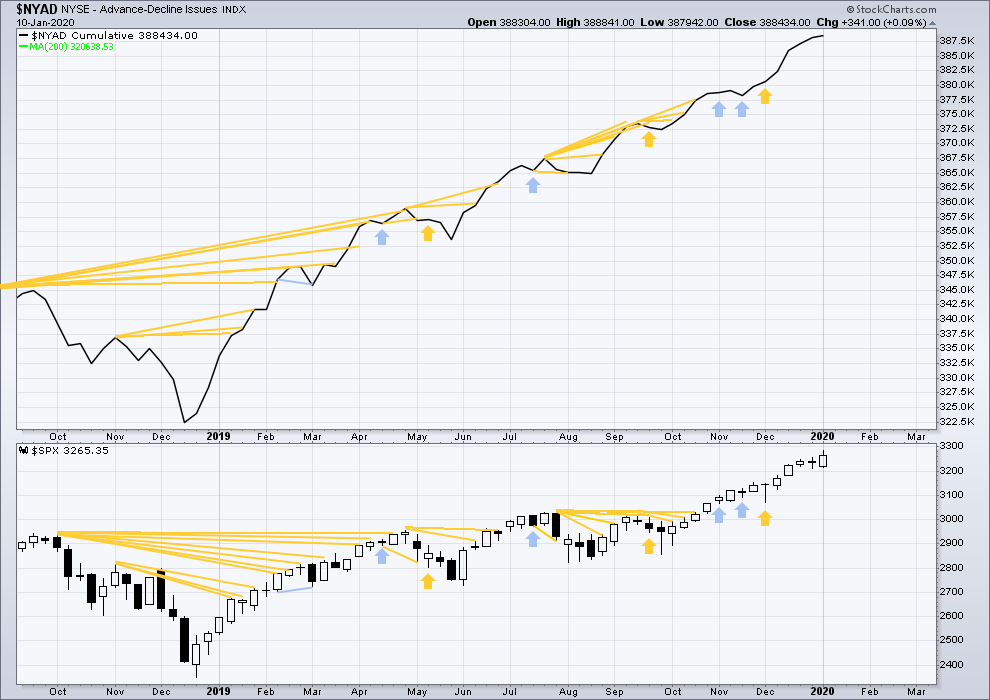
Click chart to enlarge. Chart courtesy of StockCharts.com. So that colour blind members are included, bearish signals
will be noted with blue and bullish signals with yellow.
Bear markets from the Great Depression and onwards have been preceded by an average minimum of 4 months divergence between price and the AD line with only two exceptions in 1946 and 1976. With the AD line making new all time highs this week, the end of this bull market and the start of a new bear market is very likely a minimum of 4 months away, which is mid May 2020.
In all bear markets in the last 90 years there is some positive correlation (0.6022) between the length of bearish divergence and the depth of the following bear market. No to little divergence is correlated with more shallow bear markets. Longer divergence is correlated with deeper bear markets.
If a bear market does develop here, it comes after no bearish divergence. It would therefore more likely be shallow.
Again both price and the AD line have made new all time highs. There is no divergence. Upwards movement has support from rising market breadth.
Large caps all time high: 3,282.99 on 10th January 2020.
Mid caps all time high: 2,073.72 on 2nd January 2020.
Small caps all time high: 1,100.58 on 27th August 2018.
Current upwards movement is driven by large caps, which is a feature of an aged bull market.
DAILY CHART
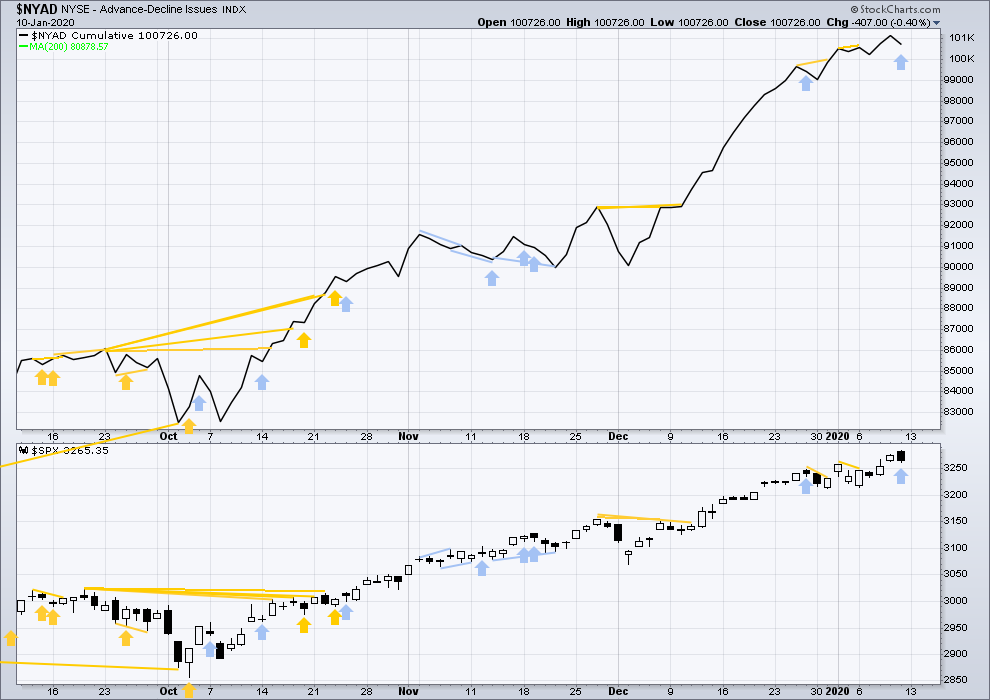
Click chart to enlarge. Chart courtesy of StockCharts.com. So that colour blind members are included, bearish signals
will be noted with blue and bullish signals with yellow.
Breadth should be read as a leading indicator.
On Friday price has made a new all time high, but the AD line has not. This divergence is bearish but short term and weak.
Large caps have for the short term made new highs, but mid and small caps have not made new swing highs above prior highs of the 2nd of January. There is now short-term weakness developing.
VOLATILITY – INVERTED VIX CHART
WEEKLY CHART
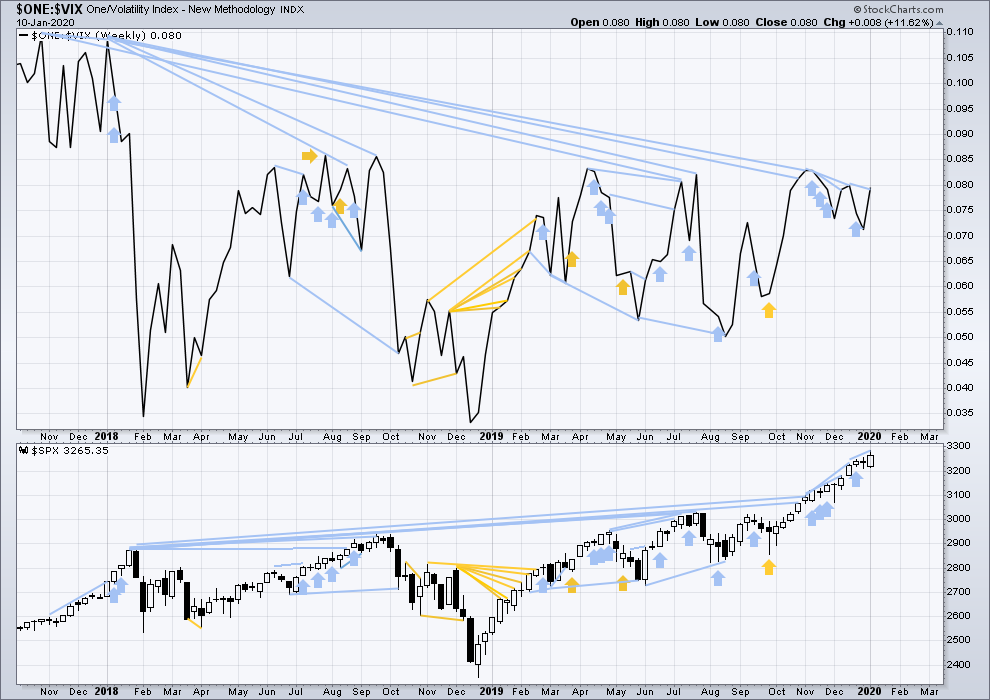
Click chart to enlarge. Chart courtesy of StockCharts.com. So that colour blind members are included, bearish signals
will be noted with blue and bullish signals with yellow.
The all time high for inverted VIX was on 30th October 2017. There is now over two years of bearish divergence between price and inverted VIX.
The rise in price is not coming with a normal corresponding decline in VIX; VIX remains elevated. This long-term divergence is bearish and may yet develop further as the bull market matures.
This divergence may be an early warning, a part of the process of a top developing that may take years. It may is clearly not useful in timing a trend change from bull to a fully fledged bear market.
This week price and inverted VIX have both moved higher. Price is making new highs, but there remains all of short, mid and long-term bearish divergence with inverted VIX.
DAILY CHART
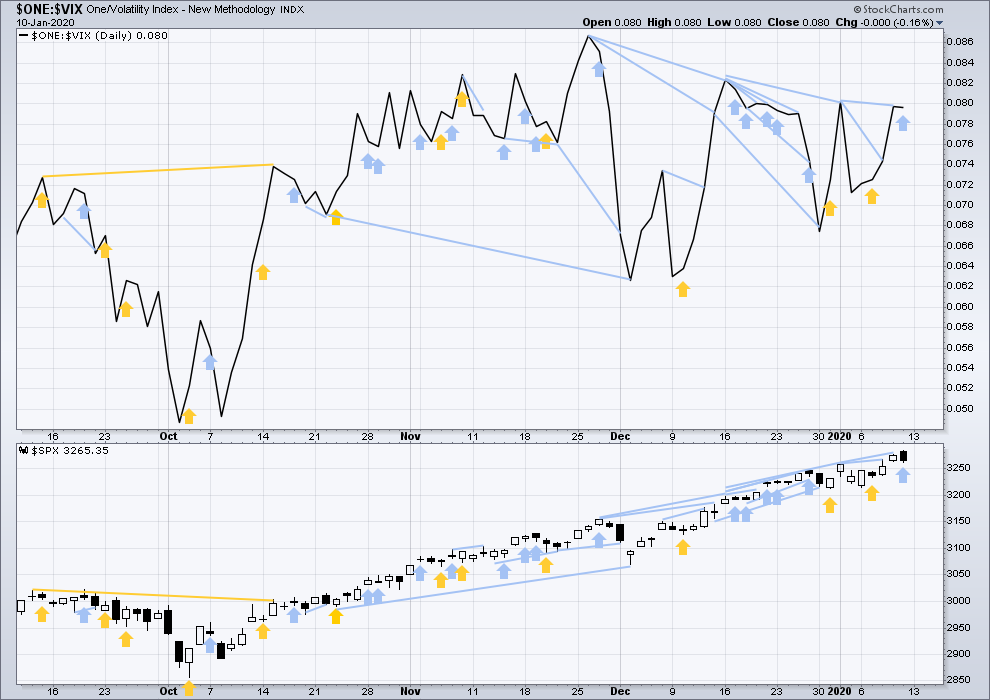
Click chart to enlarge. Chart courtesy of StockCharts.com. So that colour blind members are included, bearish signals
will be noted with blue and bullish signals with yellow.
On Friday price has made a new high, but inverted VIX has moved lower. This divergence is bearish, but it is short term and weak.
DOW THEORY
Dow Theory confirmed a bear market in December 2018. This does not necessarily mean a bear market at Grand Super Cycle degree though; Dow Theory makes no comment on Elliott wave counts. On the 25th of August 2015 Dow Theory also confirmed a bear market. The Elliott wave count sees that as part of cycle wave II. After Dow Theory confirmation of a bear market in August 2015, price went on to make new all time highs and the bull market continued.
DJIA: 23,344.52 – a close on the 19th of December at 23,284.97 confirms a bear market.
DJT: 9,806.79 – price has closed below this point on the 13th of December.
S&P500: 2,532.69 – a close on the 19th of December at 2,506.96 provides support to a bear market conclusion.
Nasdaq: 6,630.67 – a close on the 19th of December at 6,618.86 provides support to a bear market conclusion.
With all the indices having moved higher following a Dow Theory bear market confirmation, Dow Theory would confirm a bull market if the following highs are made:
DJIA: 26,951.81 – a close above this point has been made on the 3rd of July 2019.
DJT: 11,623.58 – to date DJT has failed to confirm an ongoing bull market.
S&P500: 2,940.91 – a close above this point was made on the 29th of April 2019.
Nasdaq: 8,133.30 – a close above this point was made on the 26th of April 2019.
Published @ 10:02 p.m. EST.
—
Careful risk management protects your trading account(s).
Follow my two Golden Rules:
1. Always trade with stops.
2. Risk only 1-5% of equity on any one trade.
—
New updates to this analysis are in bold.

On a 20 minute time frame this looks like an five to me. Does anyone else have that feeling?
Just because you can count 5 waves up doesn’t mean the market has to go down… (although in this case, I think it will)
it’s difficult to pair wave counts on smaller time frames out side of the 60 min bars… it seems to take you in and out of positions to early.
Yes, it does look like a five. But the last fifth wave looks incomplete.
The last wave up to todays high has a steeper slope, it could be a third wave. I’m going to have to consider the possibility that subminuette iv is over.
Hourly chart updated:
Subminuette iv may be a regular flat, running triangle or combination.
It may continue sideways for another one to two sessions.
If I’m wrong in this then it is possible that it was over at the last swing low. That would be a very brief and shallow fourth wave for the S&P, but that’s possible.
Yep!
Wabbit welcome back!
Looks like 3289 was hit, Now let’s wait patiently for next move.
With this sequence of turns at 76-78% retracement levels, it’s really starting to smell like a low degree (minuette) triangle in RUT. Which would float my boat as I’ve now effectively a sold iron condor (sold call spread above, sold put spread below) for expiry this Friday morning. I “need” (full profits) Friday morning to be in the range of 1638-1677…so now it’s just kneel to the market gods time, lol!! Which I like because the fact is I have no decision to make UNLESS my end points get closely approached; reducing decision making via trade structure is valuable to me and my monkey mind.
so we are abandoning the main corrective wave count ?
is there a percentage limit B can overtake A or percentage estimate for lenth of B compared to A?
Why so? Lara stated above: “If subminuette wave iv subdivides as either one of an expanded flat, running triangle or combination, then micro wave B or X may make a new price extreme beyond the start of micro wave W or A above 3,282.99.” and that’s exactly what is happening so far. We have reached ATH at 3283.81 (might go even higher today) for wave B or X to complete.
No. Micro B would now be a 1.04 length of micro A. The common range for micro B within a flat is 1 to 1.38 X micro A, so this is well within normal.
Not yet, lower volume … I am starting a TSLA short …. hope I don’t end up like the Titans ….
Peter S. – I wanted to short TSLA on Friday, but it doesn’t let me. Shorts are rejected by the brokers on this stock. Are you doing synthetic short or you somehow can short TSLA directly?
buying puts
Got ya:)
What I see:
– market appears to in wave v of an impulse starting 1/6.
– that should finish SOMETHING, and initiate a correction. I suspect a minute degree, but it could start the minor 4 too.
– I’ve been citing the 3296 area as a very high potential pivot high for a long time, and I’m holding to it. Watch for a turn +/- five pts from there (3291-3301), then some serious backing/filling underneath and then falling.
Lara:
Can you speak to the feasibility/probability of an alternate count that places the minute i at the pivot where you have the minute iii completing, and the move up since is a minute iii instead of a minute v? (And in which case next up or just starting is a minute iv, rather than a minor 4.) The chart here demonstrates. Thank you!
Kevin,
Quick question on VIX options, which ones are you looking at I.e. UVXY or SVXY?
I never trade (anymore) with those leveraged instruments; the price decay is far too much for me. I trade VIX options. I am using the mid Feb calls at 13, if I’m remembering rightly, for about $3.
That looks entirely valid.
My only concern right now for any count that is more bullish, is the limit at 3,477.39. The whole structure has to complete before that price point.
Has to?
If my wave count at cycle degree with where I’ve placed I, II, III and IV is correct, then the structure has to complete before the limit.
If the limit is exceeded, that count is invalidated, and one of the more bullish alternates on the monthly analysis is then used.
Lara,
So how firm is the limit 3477 for the market, will this level be the final target for market top?
If cycle I, II, III and IV are correctly placed then that limit is absolute.
Not even a tick on a one minute chart can exceed it.
If it’s invalidated then there are two more bullish counts on the monthly chart which may be used. But they don’t have that textbook perfect Elliott channel, so they have a lower probability.
Thank you Lara. So some potential for this correction in progress to only be of minute price and time proportion (vs. minor 3 proportion). And some potential for fresh bullish action here (new ATH’s) to lead to a fair amount more upside movement before a minor 4 initiates.
I think it’s critical to be alert to the “most bullish possible scenario” here and let me explain why.
Ciovacco Capital has data that statistically implies tremendously high odds of strongly bullish price action for the next several years. By statistically I mean historical analogues that result in such kind of price action to the tune of “15 out of 16 times” and “14 out of 14 times”. Now usually all results associated with trivially small data sets have extremely wide confidence intervals, and the underlying probabilities are unknowable when they are in the range of say 33% to 66% (and you get “results” like “9 out of 14 times”). To get accuracy via data sets with moderate variation and that kind of fundamental probability requires thousands, even tens of more of thousands of samples. However, the only way to get 14/14 or 15/16 type of results? The underlying probability “must be” (is extremely likely to be) very high (92-99%), because the odds of something at say just 80% happening 14/14 times? Only 4.4%. To achieve a 50% chance of 14/14 happening, the underlying odds need to be over 95% of the underlying. And note that Ciovacco has shown many (well over 10) different studies/set analogues that demonstrate these kinds of “almost always” very positive results. Ergo, it is extremely likely that “the future will be like the past” as demonstrated in the chart and historical results table I’m posting here. I’m expressing an opinion here: I’m trying to convey that this is mathematical (statistical) fact.
So bottom line, Ciovacco’s view of the likely price action here for the next few years (VERY BULLISH) is extremely likely; hard data tells us probabilities are 90%+.
FRIENDS ON THIS FORUM: That is EDGE. And edge is everything in trading. And it’s not just a little edge: knowing this market is vastly likely to very significantly rise over the next few years is huge edge.
Conclusion: use the long edge aggressively in 2020. Use the high probability that the market is strongly “leaning up” here to execute very high probability profit generating trades, consistently, and reinvest profits to grow accounts exponentially over time, taking advantage of our evidence based outlook and edge. My $0.02 (for entertainment and education only!).
Gonna be a GOOD year to the long side!
And then this set of historical results.
oops, I wrote “I’m expressing an opinion here” when I meant to write “I’m not expressing an opinion here”. just statistics (which are not lies, just often misunderstood and misrepresented).
Kevin,
This is why I asked the question. With a strong likelihood of incumbent president returning for a second term, market looks ready for brief break then ramp ahead (I think).
But in this case all this EW analysis Lara did would go out of the window. Count would be wrong.
Hence the earlier query on what if the market continues to ramp higher towards 3477 level. I wonder how that affects the analysis. This market is being a tough one to predict.
That’s a very fundamental POV. From an EW POV it will be our social mood that drives the markets. Our social mood will decide which president you guys want.
In bullish moods populations tend to stay with the status quo and not opt for change.
Lara,
You correct about social mood but population also cares about 401Ks and hence will be baised. Sad but that is how this economy is being sold to American voters ( at least appears to me).
Kevin, while this theory definitely has its ground, it will only work if the secular trend they talk about continues. The only way analysts can project future is by looking at the past. In the past the trend from beginning of 1900s was up and so it’s easy to project the same trend going forward with the same proportions. But how do we really know that it won’t end here? No one knows. Economy used to depend on manufacturing, not it’s all services, which are not as sustainable in longer run. I’m not sure if there is and EDGE, but just someone’s opinion. But it’s a good video and analysis.
I “believe in” data and probabilities, over opinions. The data and probabilities tell the story (to me). And if that bullish future doesn’t come to pass, I will simply view it as the very low probability case coming to pass. It is ultimately a kind of dice roll, every time all the time.
Sorry ’bout this, Kevin!
Lightening fast! I’m only just now beginning the video!
Wowza!!!
Oh, all’s fair in love, war, and being firstest!