Today’s signals from the AD line and inverted VIX indicate a likely direction for price tomorrow.
Summary: Upwards movement may continue here to new all time highs soon. The next target is at 3,120.
For the very short term, a new low below 2,976.31 would indicate a short-term pull back. Targets would be at 2,969 or 2,947.
A new low below 2,822.12 would add confidence to an alternate. Expect price at that stage to keep falling to 2,578 – 2,476 to find support at the lower edge of the large teal channel on weekly and daily charts. This alternate has a very low probability.
The biggest picture, Grand Super Cycle analysis, is here.
Monthly charts were last published here, with video here. There are two further alternate monthly charts here, with video here.
ELLIOTT WAVE COUNTS
The two weekly Elliott wave counts below will be labelled First and Second. They may be about of even probability. When the fifth wave currently unfolding on weekly charts may be complete, then these two wave counts will diverge on the severity of the expected following bear market. To see an illustration of this future divergence monthly charts should be viewed.
FIRST WAVE COUNT
MAIN WEEKLY CHART
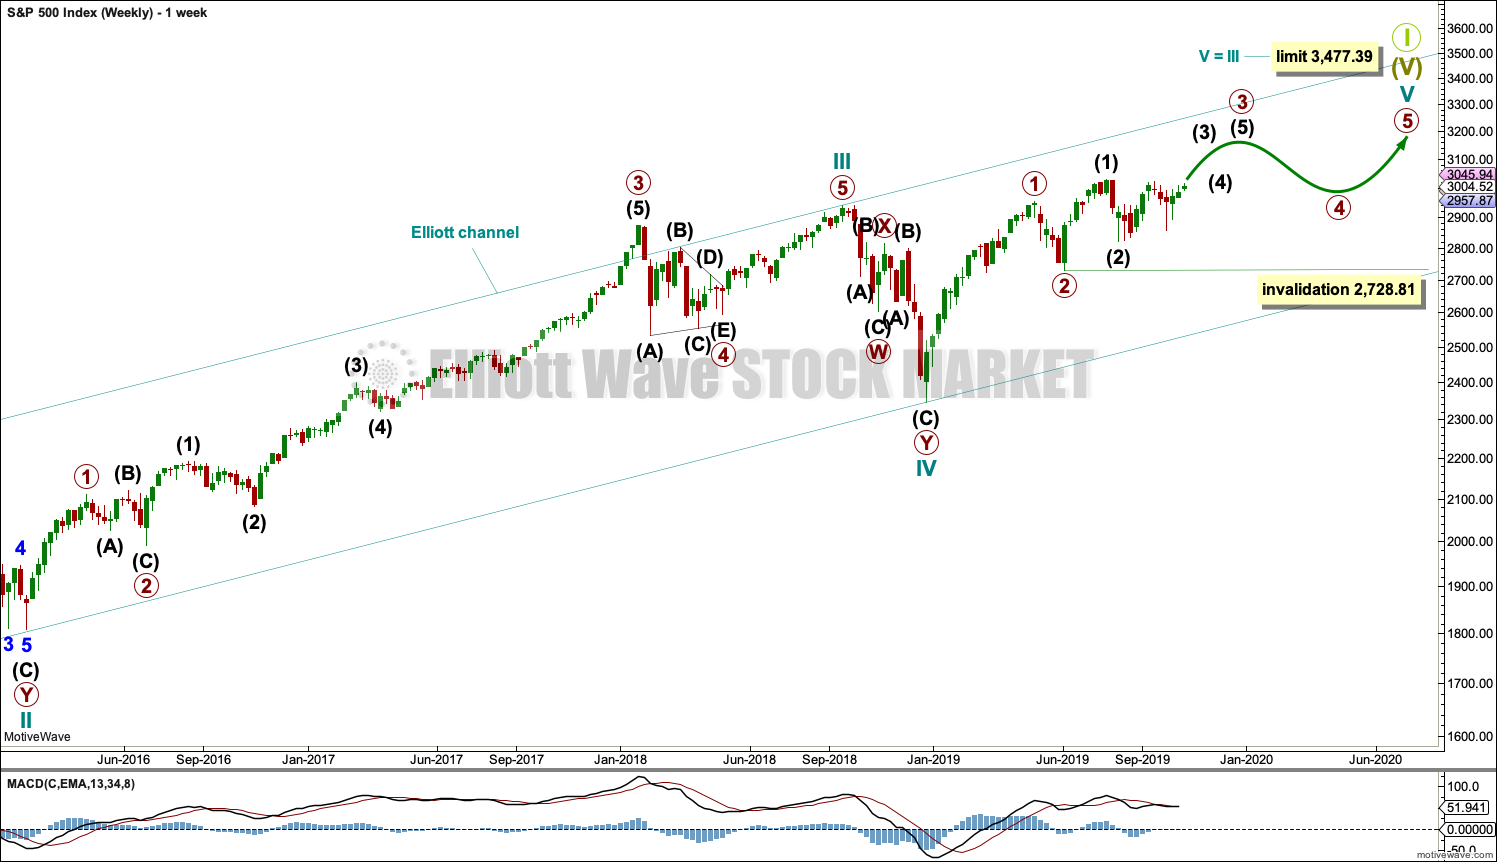
The basic Elliott wave structure consists of a five wave structure up followed by a three wave structure down (for a bull market). This wave count sees the bull market beginning in March 2009 as an incomplete five wave impulse and now within the last fifth wave, which is labelled cycle wave V. This impulse is best viewed on monthly charts. The weekly chart focusses on the end of it.
Elliott wave is fractal. This fifth wave labelled cycle wave V may end a larger fifth wave labelled Super Cycle wave (V), which may end a larger first wave labelled Grand Super Cycle wave I.
The teal Elliott channel is drawn using Elliott’s first technique about the impulse of Super Cycle wave (V). Draw the first trend line from the end of cycle wave I (off to the left of the chart, the weekly candlestick beginning 30th November 2014) to the end of cycle wave III, then place a parallel copy on the end of cycle wave II. This channel perfectly shows where cycle wave IV ended at support. The strongest portion of cycle wave III, the end of primary wave 3, overshoots the upper edge of the channel. This is a typical look for a third wave and suggests the channel is drawn correctly and the way the impulse is counted is correct.
Within Super Cycle wave (V), cycle wave III is shorter than cycle wave I. A core Elliott wave rule states that a third wave may never be the shortest. For this rule to be met in this instance, cycle wave V may not be longer in length than cycle wave III. This limit is at 3,477.39.
Cycle wave V may subdivide either as an impulse or an ending diagonal. Impulses are much more common. This main wave count expects that cycle wave V may be unfolding as an impulse.
The daily chart below will focus on movement from the end of intermediate wave (1) within primary wave 3.
In historic analysis, two further monthly charts have been published that do not have a limit to upwards movement and are more bullish than this wave count. Members are encouraged to consider those possibilities (links below summary) alongside the wave counts presented on a daily and weekly basis.
Within cycle wave V, primary waves 1 and 2 may be complete. Within primary wave 3, intermediate wave (2) may not move beyond the start of intermediate wave (1) below 2,728.81.
MAIN DAILY CHART
Primary wave 3 may have begun.
All of primary wave 3, intermediate wave (3) and minor wave 3 may only subdivide as impulses. Within each impulse, its second wave correction may not move beyond the start of its first wave.
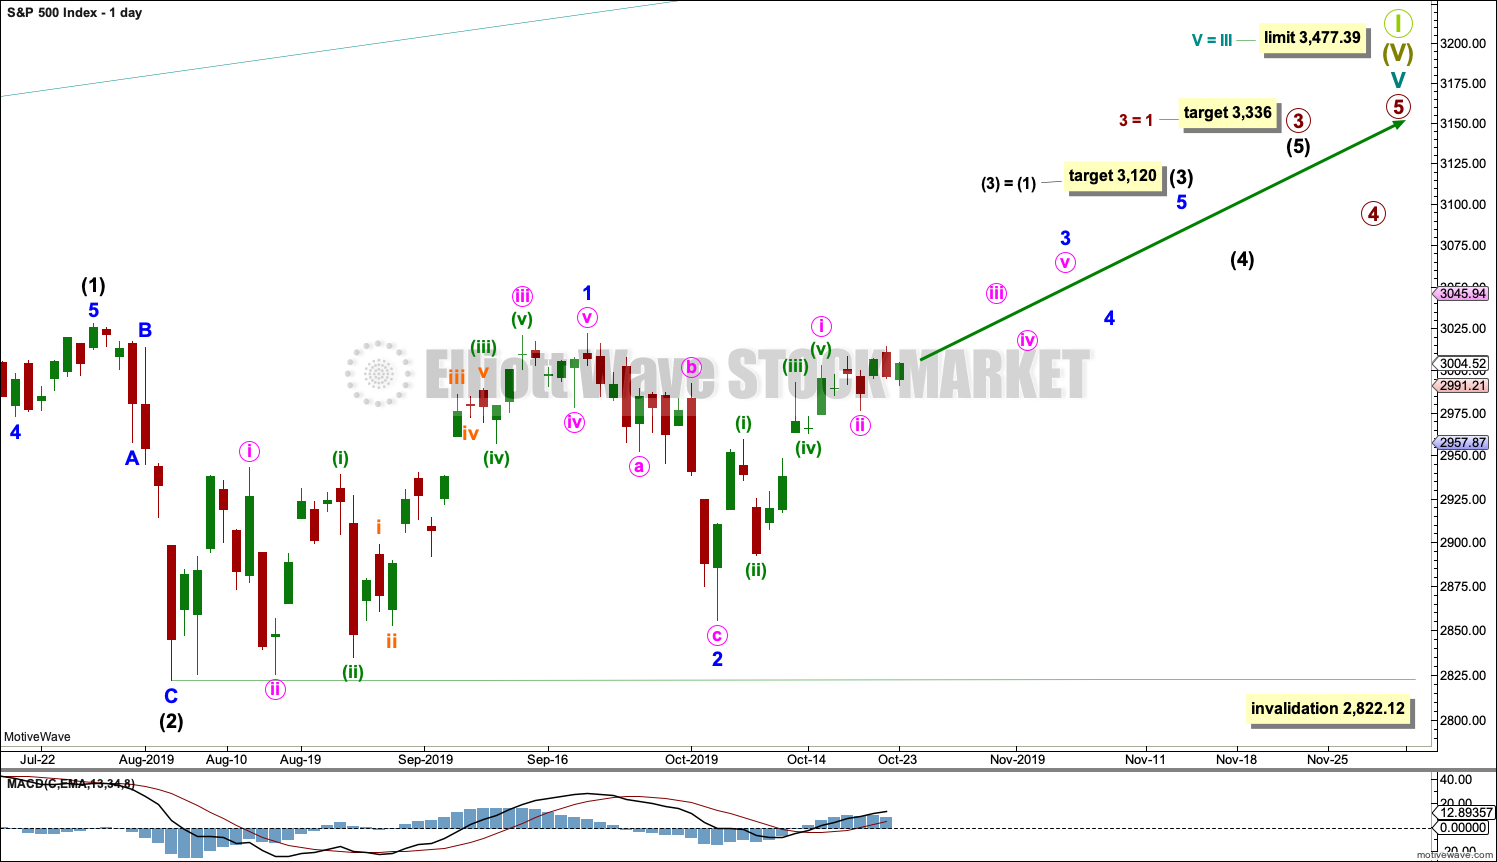
Minor wave 2 may not move beyond the start of minor wave 1 below 2,822.12. It is still possible that minor wave 2 may continue lower as a double zigzag. The invalidation point is left the same to allow for this possibility. If price makes a new all time high in coming days, then the invalidation point will be moved upwards to the end of minor wave 2 at 2,855.96.
Minute wave i looks like a completed five wave impulse at the daily chart level.
Intermediate wave (3) must move far enough above the end of intermediate wave (1) to then allow intermediate wave (4) to unfold and remain above intermediate wave (1) price territory.
HOURLY CHART
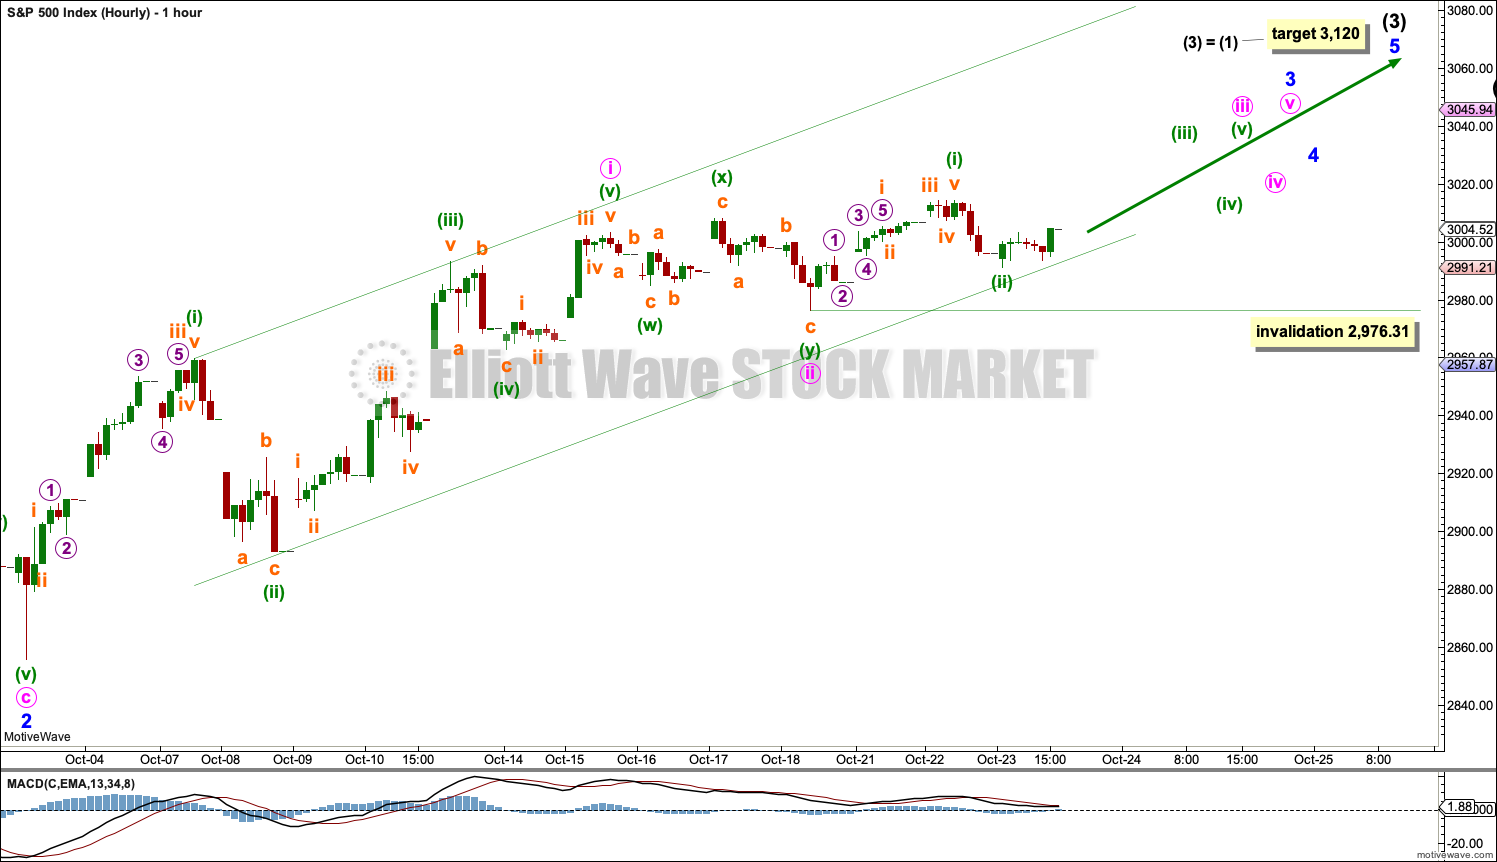
Minor wave 2 should be over.
Minor wave 3 may only subdivide as an impulse. Within the impulse, minute waves i and ii may be over. Minute wave ii may have completed as a relatively brief and shallow double zigzag.
Minute wave iii may have begun. Within minute wave iii, minuette wave (ii) may not move beyond the start of minuette wave (i) below 2,976.31. Minuette wave (ii) remains contained within the Elliott channel. The lower edge of this channel may continue to provide support.
If price makes a new low below 2,976.31 in the next day or so, then the alternate hourly chart below may be used.
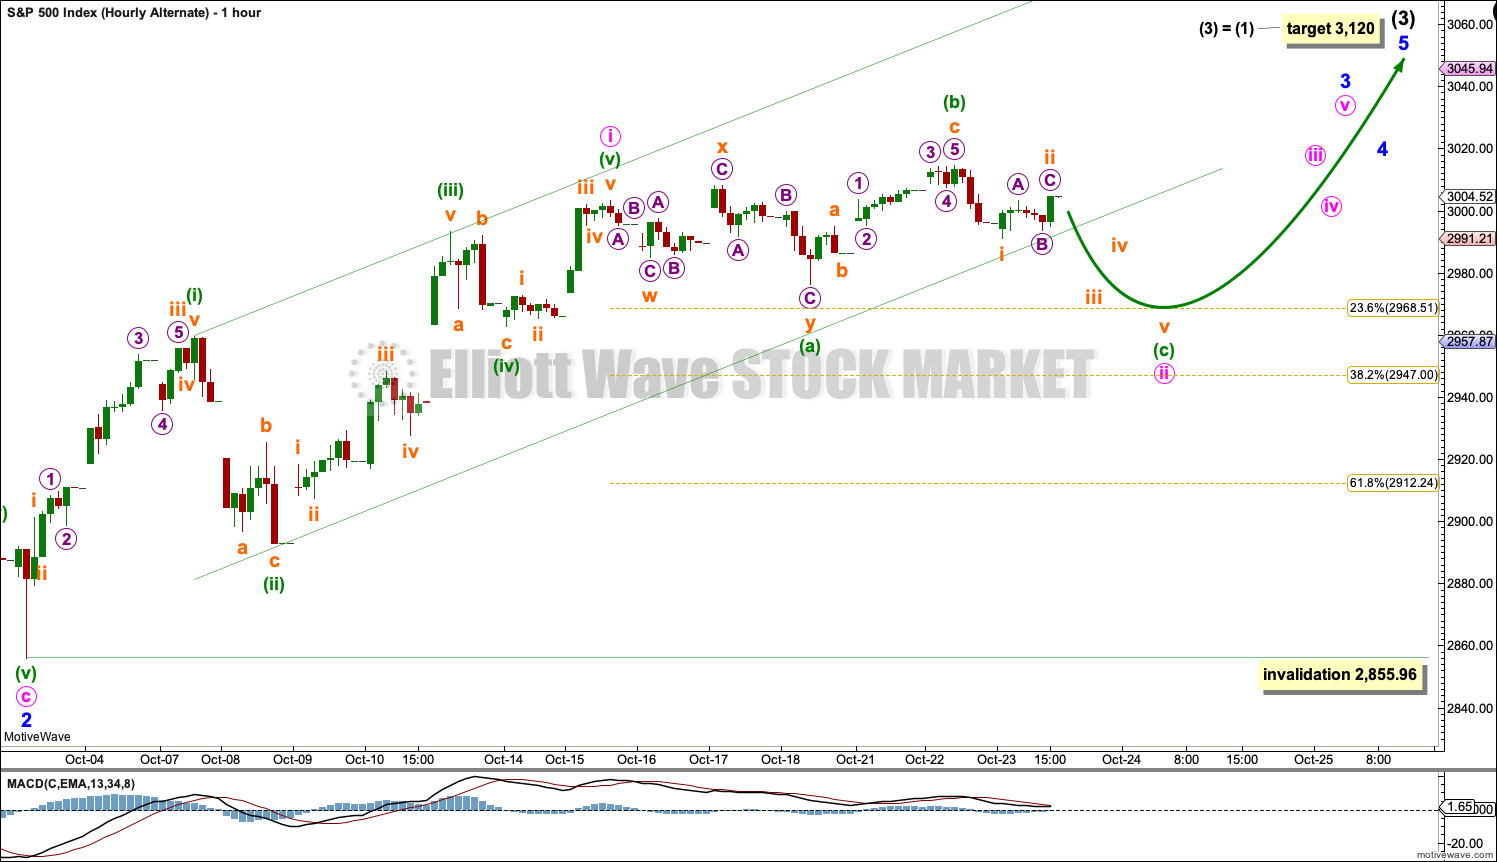
ALTERNATE HOURLY CHART
If the degree of labelling within minute wave ii is moved down one degree, it is possible that it may be an incomplete expanded flat correction.
Minuette wave (a) may be a completed three wave structure, subdividing as a double zigzag. Minuette wave (b) may have continued higher. It is now a 1.42 length of minuette wave (a), longer than the common range of up to 1.38, so the probability of this alternate wave count is further reduced but still remains valid.
There is no Elliott wave rule stating a limit for B waves within flat corrections. If minuette wave (b) reaches twice the length of minuette wave (a) at 3,030.25, then the idea of a flat correction unfolding should be discarded. However, if upwards movement shows strength, this wave count may be discarded prior to that price point being met. B waves should exhibit weakness.
Minuette wave (c) should unfold as a five wave structure and may bring minute wave ii down to either the 0.236 or 0.382 Fibonacci ratios of minute wave i.
This wave count today does not have support from classic technical analysis. The AD line has made yet another new all time high today, and both the AD line and inverted VIX exhibit bullish divergence today.
ALTERNATE WEEKLY CHART
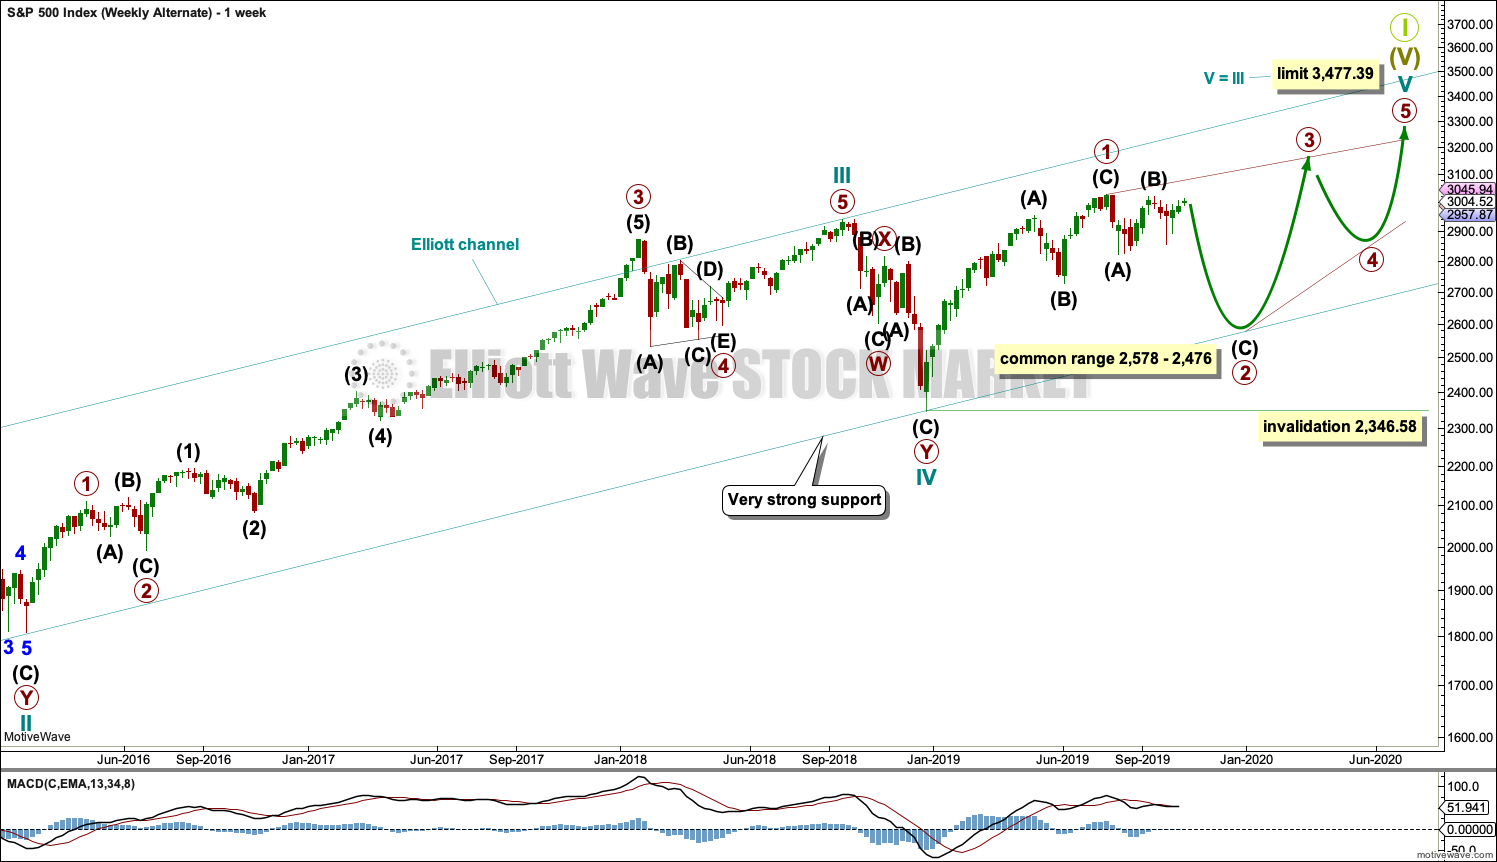
Cycle wave V may be subdividing as an ending diagonal. Within ending diagonals, all sub-waves must subdivide as zigzags. Primary wave 1 may be over at the last all time high as a zigzag.
Primary wave 2 must complete lower as a zigzag.
The second and fourth waves within diagonals are usually very deep, commonly between 0.81 to 0.66 the depth of the prior wave. This gives a target zone for primary wave 2.
Primary wave 2 may end if it comes down to find support at the lower edge of the teal channel, which is copied over from monthly and weekly charts. This trend line should provide final support for a deeper pullback.
Primary wave 2 may not move beyond the start of primary wave 1 below 2,346.58.
Within primary wave 2, intermediate wave (B) may not move beyond the start of intermediate wave (A) above 3.027.98. A new all time high would invalidate this wave count.
This alternate wave count is provided only for those members who wish to follow a more bearish wave count due to their own personal analysis. It is my judgement that this wave count has a very low probability.
SECOND WAVE COUNT
WEEKLY CHART
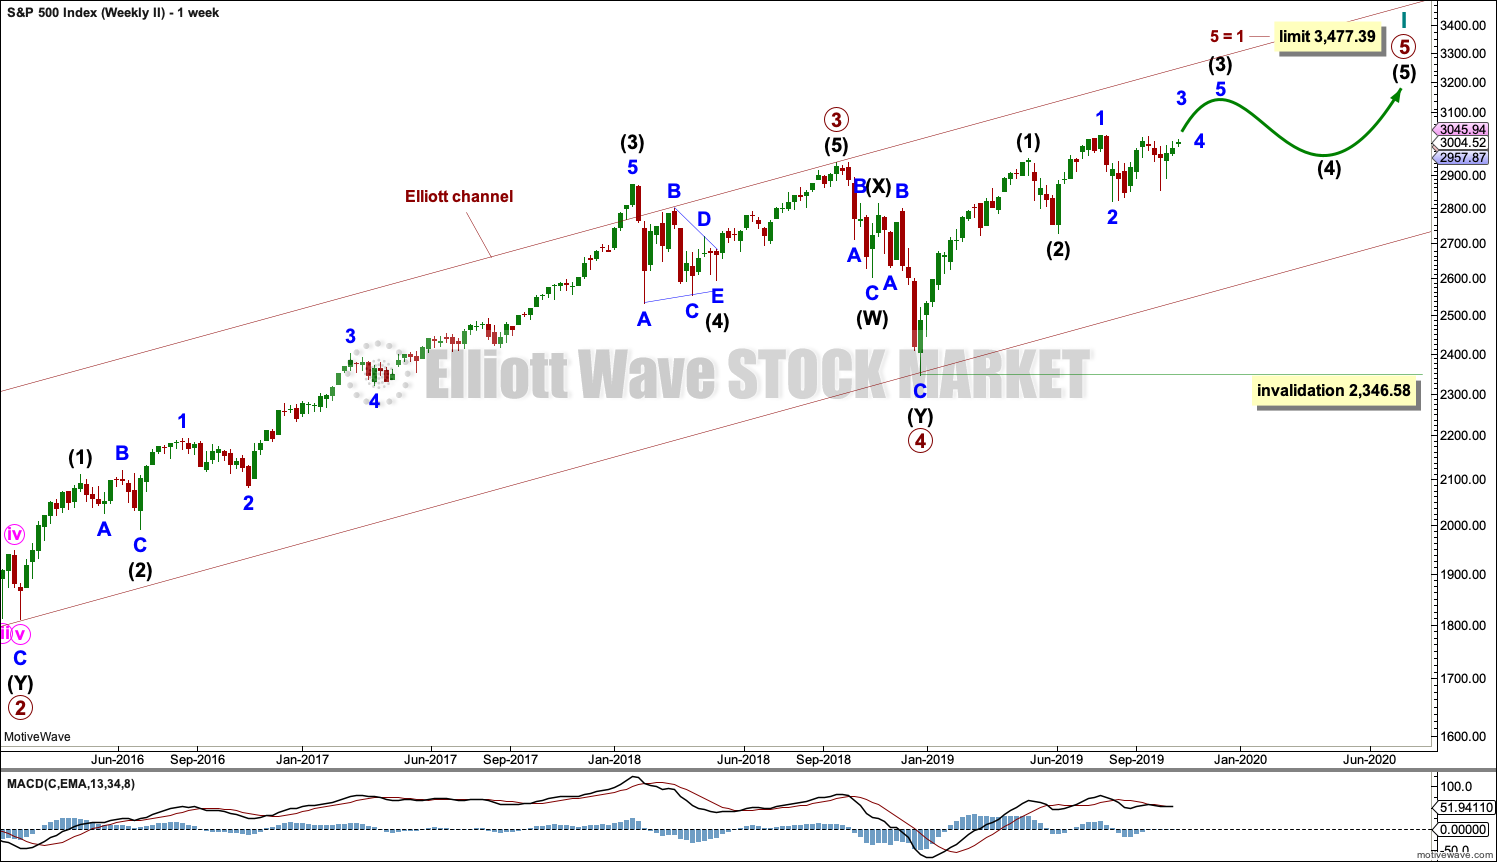
This weekly chart is almost identical to the first weekly chart, with the sole exception being the degree of labelling.
This weekly chart moves the degree of labelling for the impulse beginning in March 2009 all down one degree. This difference is best viewed on monthly charts.
The impulse is still viewed as nearing an end; a fifth wave is still seen as needing to complete higher. This wave count labels it primary wave 5.
Primary wave 5 may be subdividing as either an impulse or ending diagonal, in the same way that cycle wave V is seen for the first weekly chart.
TECHNICAL ANALYSIS
WEEKLY CHART
Click chart to enlarge. Chart courtesy of StockCharts.com.
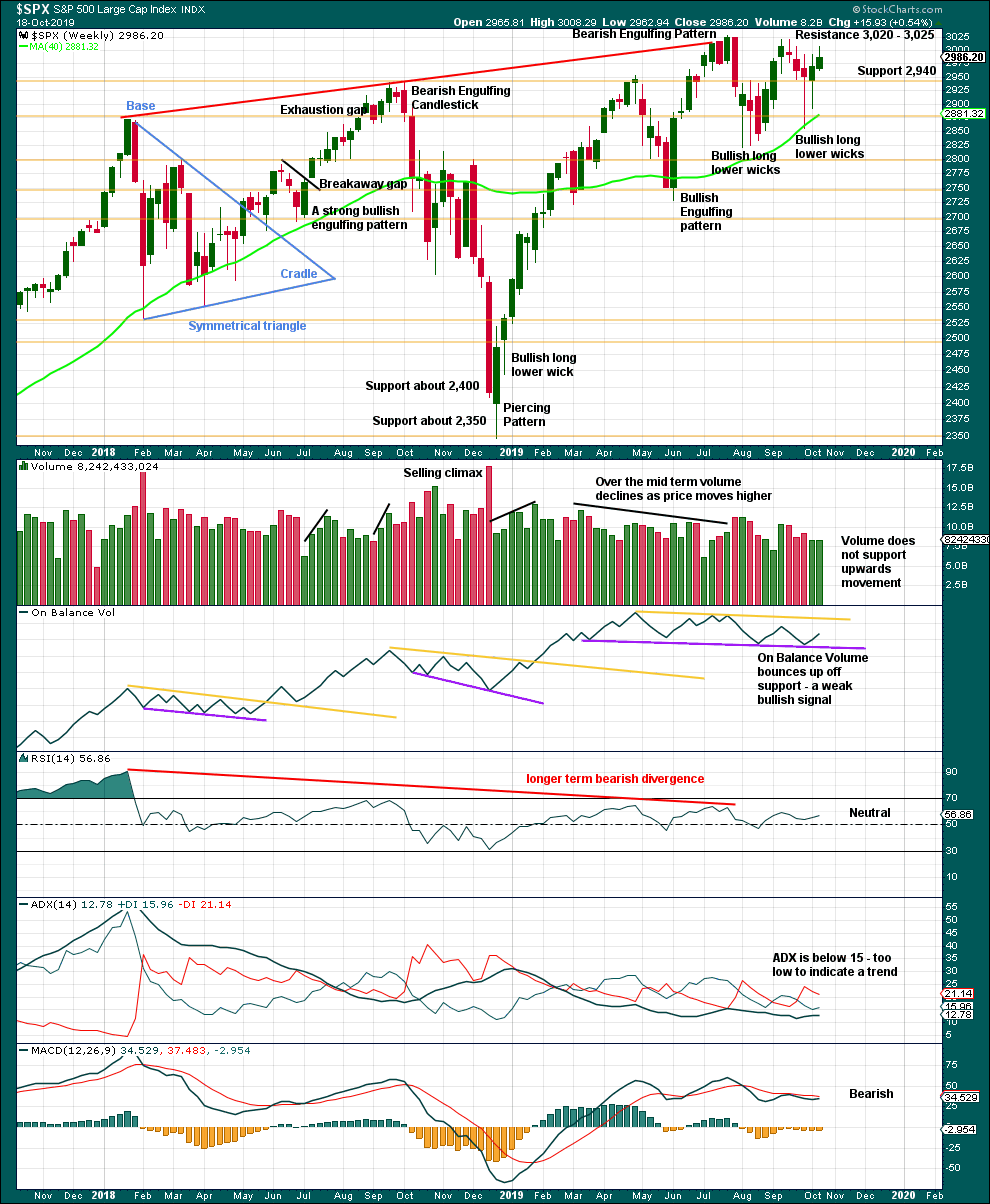
A decline in volume with upwards movement is not of a concern in current market conditions.
A slightly longer upper wick last week suggests a pullback may continue this week. Look for support about 2,940.
There is still a series of higher highs (with the exception of the last high) and higher lows from the low in December 2018. This is the basic definition of an upwards trend. For that view to shift then a lower low below 2,822.12 would need to be seen.
DAILY CHART
Click chart to enlarge. Chart courtesy of StockCharts.com.
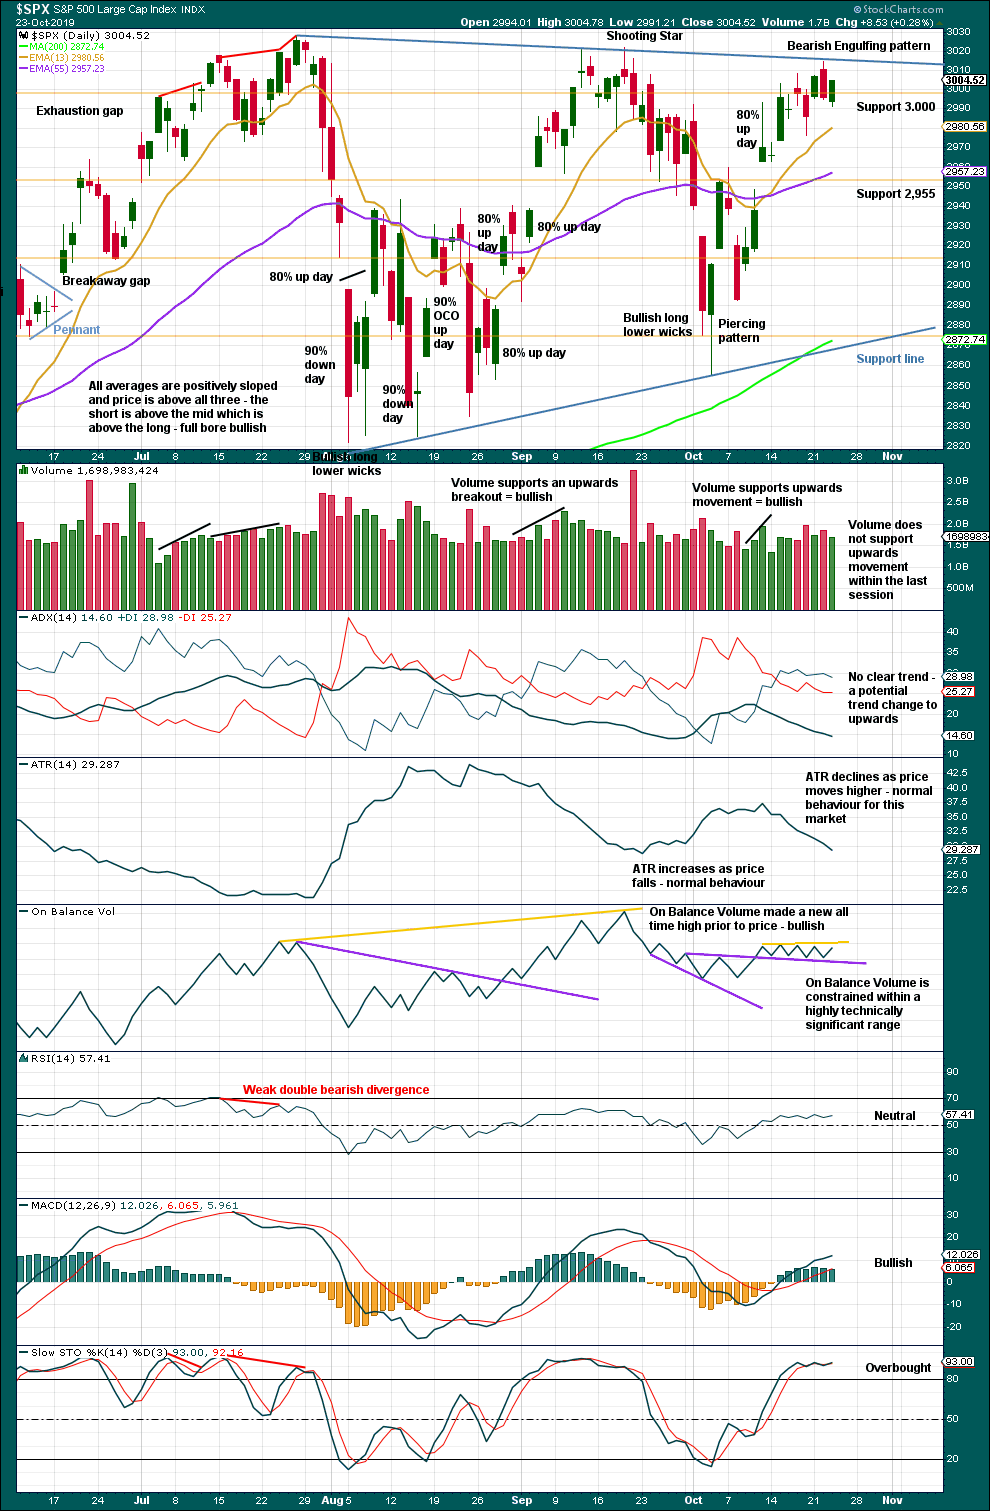
There is now a series of higher highs and higher lows since the 5th of August. Strength in 90% up days and back to back 80% up days off lows indicate the lows may still be sustainable.
Up volume dominated today at 67% of total up/down volume.
The range for On Balance Volume is now highly technically significant. A breakout should be given weight, in either direction.
BREADTH – AD LINE
WEEKLY CHART
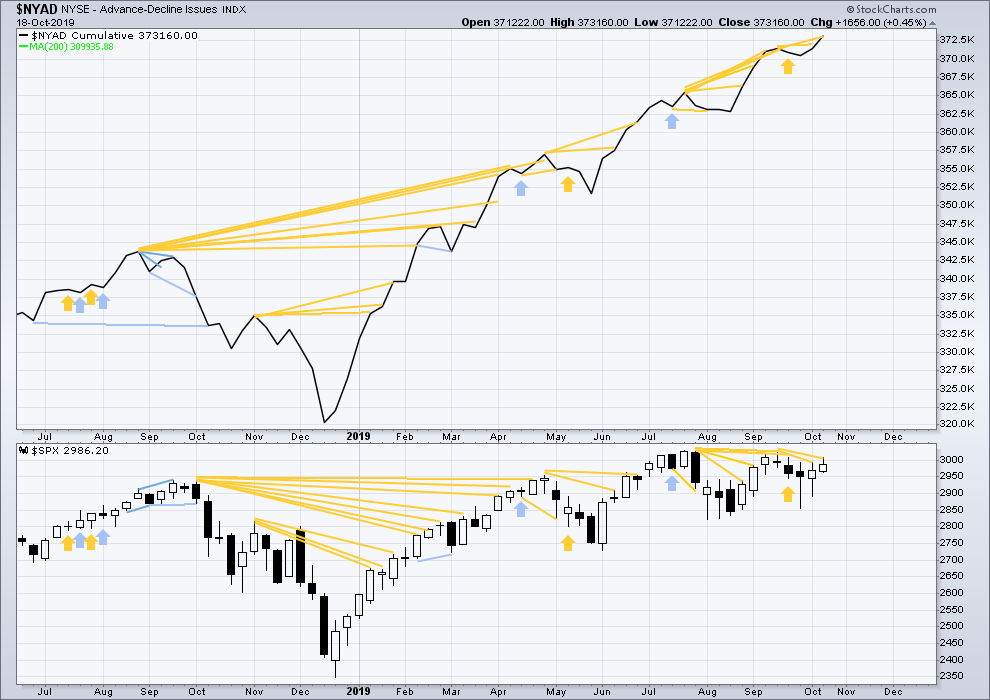
Click chart to enlarge. Chart courtesy of StockCharts.com. So that colour blind members are included, bearish signals
will be noted with blue and bullish signals with yellow.
Bear markets from the Great Depression and onwards have been preceded by an average minimum of 4 months divergence between price and the AD line with only two exceptions in 1946 and 1976. With the AD line making new all time highs again this week, the end of this bull market and the start of a new bear market is very likely a minimum of 4 months away, which is mid February 2020.
In all bear markets in the last 90 years there is some positive correlation (0.6022) between the length of bearish divergence and the depth of the following bear market. No to little divergence is correlated with more shallow bear markets. Longer divergence is correlated with deeper bear markets.
If a bear market does develop here, it comes after no bearish divergence. It would therefore more likely be shallow.
Small caps have made a new swing high above the prior high of the end of July, but mid and large caps have not yet done so. The last upwards movement appears to be led by small caps. Because small caps are usually the first to exhibit deterioration in the later stages of a bull market, some strength in small caps at this stage indicates a healthy bull market with further to run.
Last week the AD line makes another new all time high. This divergence is bullish and strongly supports the main Elliott wave count.
DAILY CHART
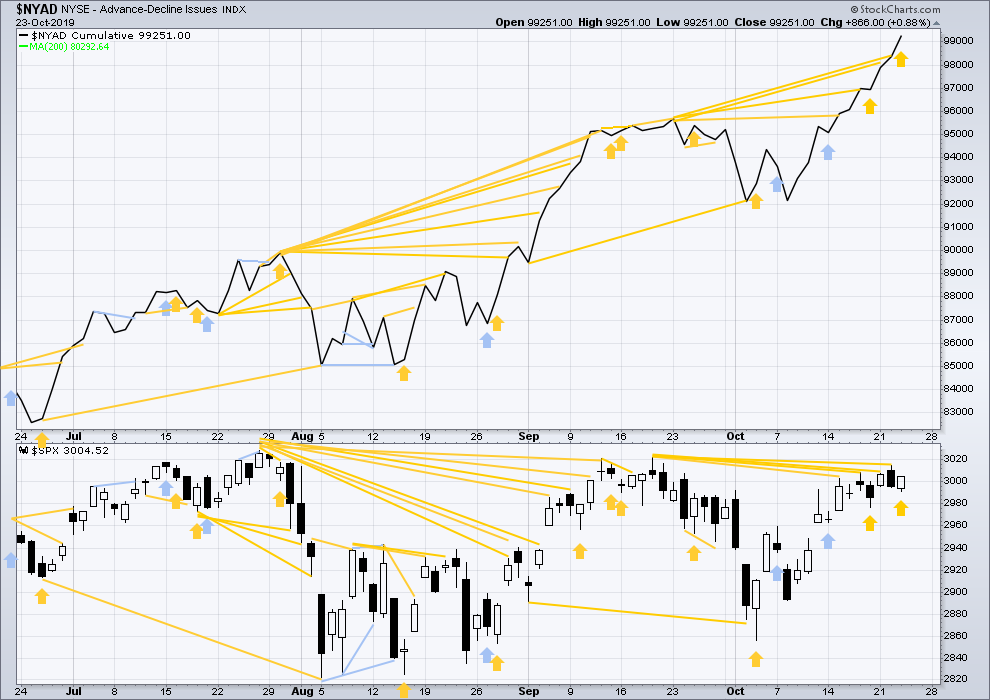
Click chart to enlarge. Chart courtesy of StockCharts.com. So that colour blind members are included, bearish signals
will be noted with blue and bullish signals with yellow.
Breadth should be read as a leading indicator.
The AD line makes yet another new all time high today. This divergence is bullish and strong. It is given reasonable weight in this analysis.
Today price moved lower with a lower low and a lower high, but the AD line has moved higher. This divergence is bullish and supports the main hourly Elliott wave count.
VOLATILITY – INVERTED VIX CHART
WEEKLY CHART
Click chart to enlarge. Chart courtesy of StockCharts.com. So that colour blind members are included, bearish signals
will be noted with blue and bullish signals with yellow.
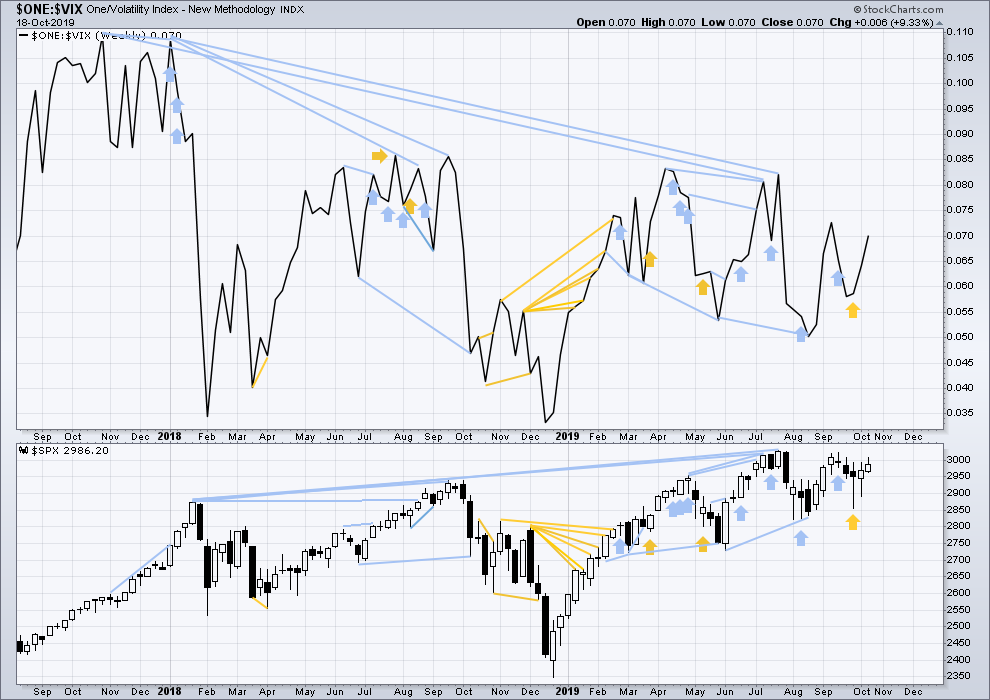
The all time high for inverted VIX (which is the same as the low for VIX) was on 30th October 2017. There is now almost two years of bearish divergence between price and inverted VIX.
The rise in price is not coming with a normal corresponding decline in VIX; VIX remains elevated. This long-term divergence is bearish and may yet develop further as the bull market matures.
This divergence may be an early warning, a part of the process of a top developing that may take years. It may not be useful in timing a trend change.
Last week both price and inverted VIX have moved higher. Neither have made new short-term swing highs. There is no new divergence.
DAILY CHART
Click chart to enlarge. Chart courtesy of StockCharts.com. So that colour blind members are included, bearish signals
will be noted with blue and bullish signals with yellow.
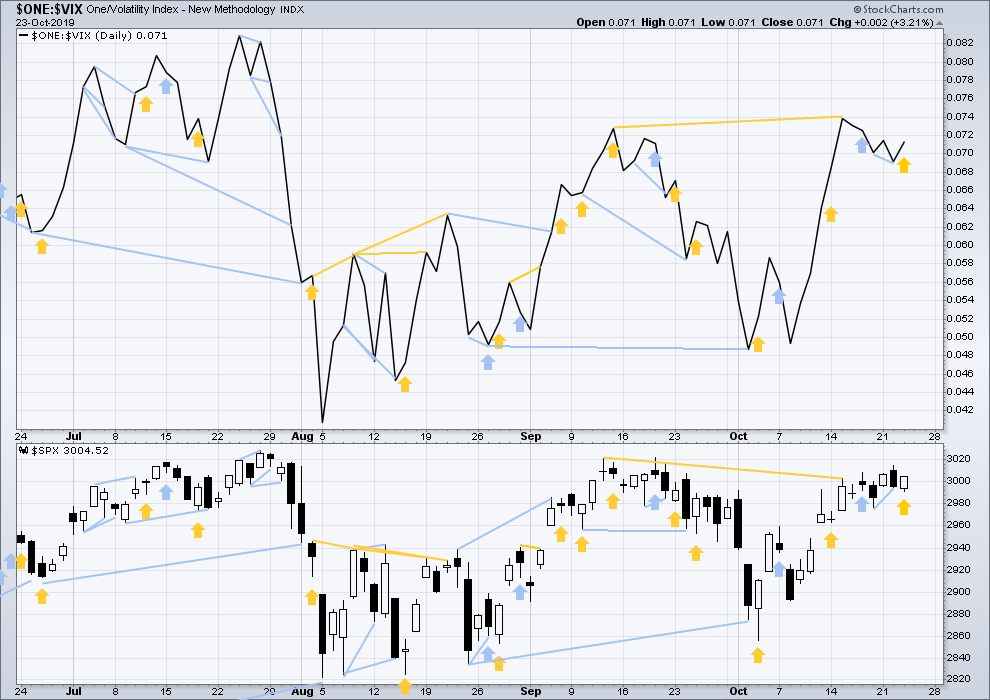
Today price moved lower with a lower low and a lower high, but inverted VIX has moved higher. This divergence is bullish and supports the main hourly Elliott wave count.
DOW THEORY
Dow Theory confirmed a bear market in December 2018. This does not necessarily mean a bear market at Grand Super Cycle degree though; Dow Theory makes no comment on Elliott wave counts. On the 25th of August 2015 Dow Theory also confirmed a bear market. The Elliott wave count sees that as part of cycle wave II. After Dow Theory confirmation of a bear market in August 2015, price went on to make new all time highs and the bull market continued.
DJIA: 23,344.52 – a close on the 19th of December at 23,284.97 confirms a bear market.
DJT: 9,806.79 – price has closed below this point on the 13th of December.
S&P500: 2,532.69 – a close on the 19th of December at 2,506.96 provides support to a bear market conclusion.
Nasdaq: 6,630.67 – a close on the 19th of December at 6,618.86 provides support to a bear market conclusion.
With all the indices having moved higher following a Dow Theory bear market confirmation, Dow Theory would confirm a bull market if the following highs are made:
DJIA: 26,951.81 – a close above this point has been made on the 3rd of July 2019.
DJT: 11,623.58 – to date DJT has failed to confirm an ongoing bull market.
S&P500: 2,940.91 – a close above this point was made on the 29th of April 2019.
Nasdaq: 8,133.30 – a close above this point was made on the 26th of April 2019.
Published @ 07:58 p.m. EST.
—
Careful risk management protects your trading account(s).
Follow my two Golden Rules:
1. Always trade with stops.
2. Risk only 1-5% of equity on any one trade.
—
New updates to this analysis are in bold.

Kevin,
RUT made a lower low on divergence today, seems like a bull flag after Monday’s run… if the low hold and it closes at the highs… it very well could be hammer.. keep an eye
TY! I will. I am not in RUT presently, waiting to see it make some kind of commitment.
hourly chart updated
the only way I can see so far to label todays upwards movement is another series of first and second waves
Multiple 1-2 combination usually end up being a triangle.
I believe SPX is still in wave 1 purple (currently tracing a 4th wave, with 5 up to go).
Several stock trade ideas on my Alerts page (specktrading). The link is on Lara’s list of resource links. QCOM may be done with a very large triangle 4, CGC maybe finished with a big ABC down, and ZEN starting to look sporty to the upside after a large 4 down.
sold SPY calls at 300 ish for some gain, but NOW I am short
SPX is up against the trendline from the July and Sept highs. This is attempt #2 at breaking through on this go around. They say, “Three times is a charm.” So maybe some more time and downwards movement ahead. BTY, this is basically SPX’s third attemp to break through the 3000 barrier. (Again, third time is a charm!)
But I am persuaded the 3000 mark will continue to provide some, if not substantial, support. The next support is at the 2940 area. I find myself growing impatient with this breakout. We have basically gone sideways since October of 2018, 24 months. This is a large / long consolidation. If we do break above, there is a lot of cash on the sidelines which could propel us to an 24 month series of higher highs and higher lows. The first few months could be explosive.
I’m reasonably confident that 24 month future is coming Rodney. I like the “millennial money” theory per Ciovacco that could drive this market for well over a decade, too.
But until the close of tomorrow, SPX at 3000 is just about a perfect pin for my little SPY ‘fly (299.5).
Meanwhile, RUT is now showing a bearish engulfing candle look…I suspect these markets hold up through tomorrow (could be wishful thinking) to maximize big money option returns, then fall back into range next week.
I too watched the Ciovacco video, and I found the millennial argument extremely weak.
The reason baby boomers have a special influence is because there was a surge in natality after WW2 which translates over time in increased consumption and non-linear phenomenon. It’s a demographic argument.
Since the 90s, the growth of the US population has slowed dramatically (from 2% to 1% today). So the millennials is the opposite of the boomers as far as growth is concerned: it was an increase of growth of natality then vs. a decrease of growth of natality now.
You can find all relevant population data in the “Demography of the United States” article in Wikipedia. It’s easy enough to to copy the table on a spreadsheet and make all the nice graphs necessary.
For this reason, I would discount his analysis tremendously to “entertainment”, and I would put exactly zero of my own dollars on his trade (based on his rationale).
The “money on the sidelines” I spoke of has nothing to do with demographics or Ciovacco. The money I refer to is the net outflow of funds from equity / financial funds. Of course, some of that may be from Boomers withdrawals as per Harry Dent’s argument. However, there still remains a lot of cash on the sidelines ready to be deployed relative to other periods.
Here is one such example of an article highlighting the situation. But looking backwards many months, there is much more cash.
“CHICAGO, Sept. 13, 2019 /PRNewswire/ — Morningstar, Inc. (Nasdaq: MORN), a leading provider of independent investment research, today reported estimated U.S. mutual fund and exchange-traded fund (ETF) flows for August 2019. Overall, passive U.S. equity funds saw approximately $900.0 million in outflows while active U.S. equity funds had $18.9 billion in outflows. Morningstar estimates net flow for mutual funds by computing the change in assets not explained by the performance of the fund, and net flow for U.S. ETFs shares outstanding and reported net assets.”
The herd is on the sidelines in a big way. The herd is always wrong. Right?
Hmmm. Well, I find the type of structural and relationships analogues analysis to be at times compelling.
I think what you are saying is that this cyclical peak of US population is a significantly smaller peak than the boomer peak (and perhaps “narrower” too). But that by no means implies that it won’t have an effect on…well, everything. Okay, “not as much” as the boomer generation, but that should not diminish the fundamental thesis that their economic production will drive a healthy and growing economy etc. through their “peak years”.
I think there are plenty of reasons more broadly to support Lara’s thesis that a GSC wave II is coming. i.e, an EPIC bear market starting up sometime in the 2020’s. Despite a millennial effect. I kind of like 2028 as the date, wonderful symmetry there.
I’ve been a follower of Elliott for 30 years, and I can’t remember a time I took a position based on fundamentals or economic analysis.
I too am hoping for the mid/late 2020s market rally, since bull market are way more fun to live through than bear markets (long lines at Starbucks beat long lines at the unemployment office). But nothing is certain…
Good day for my TLSA, I have a speculative long bet that one day my phone will summon a driverless UBER to take me to the bar, and then my wife will summon the same UBER to take me home instead
TSLA up….TWTR destroyed!! Lol!!!! I can sit back and chuckle because I wasn’t in either. Waiting for V to announce, assuming decent results and action I will take a bull put spread underneath market. Will do the same on ZEN after earnings (early next week) assuming same. It’s retraced deeply and turned now at 61.8%.
ROFLMAO! I guess I would just have to pay the UBER driver to wait in the parking lot until I was ready to go home. Better yet, maybe I would invite him in for a few drinks and then we call a LYFT driver.
What hempen home spuns have we swaggering here,
so near the cradle of the fairy queen?
Well, tomorrow may be the day ….
You short yet Peter? Or waiting for more confirmation? Sure looks toppish to me, and today we might see a dark cloud cover or even bearish engulfing candle. This inability to punch through resistance coupled with low volume, feels like a pivot in process (7/29 and 9/19 are the analogues) then back down deep in the wide range. Maybe.
well, crazy me bought a SPY ‘fly for tomorrow, 297-299.5-302.
The volume node in SPY hourly is right at 299.5, and it sure feels like the big money wants price right around there tomorrow at expiry. We will see!!
lol, WAS going to close my calls at SPY 301 and watch, but I missed the open today, and am NOW stuck with having to watch 299.5 to stop out even if it drops……..
not short but I took my nice profit in Dec RUT bull put spread. Don’t want to see good money evaporate, so it’s in my pocket now. Should be a great opportunity to do it again at cheaper prices soon I suspect.
yes