A very little downwards movement was expected for the short term. A small range inside day mostly fits the expecation.
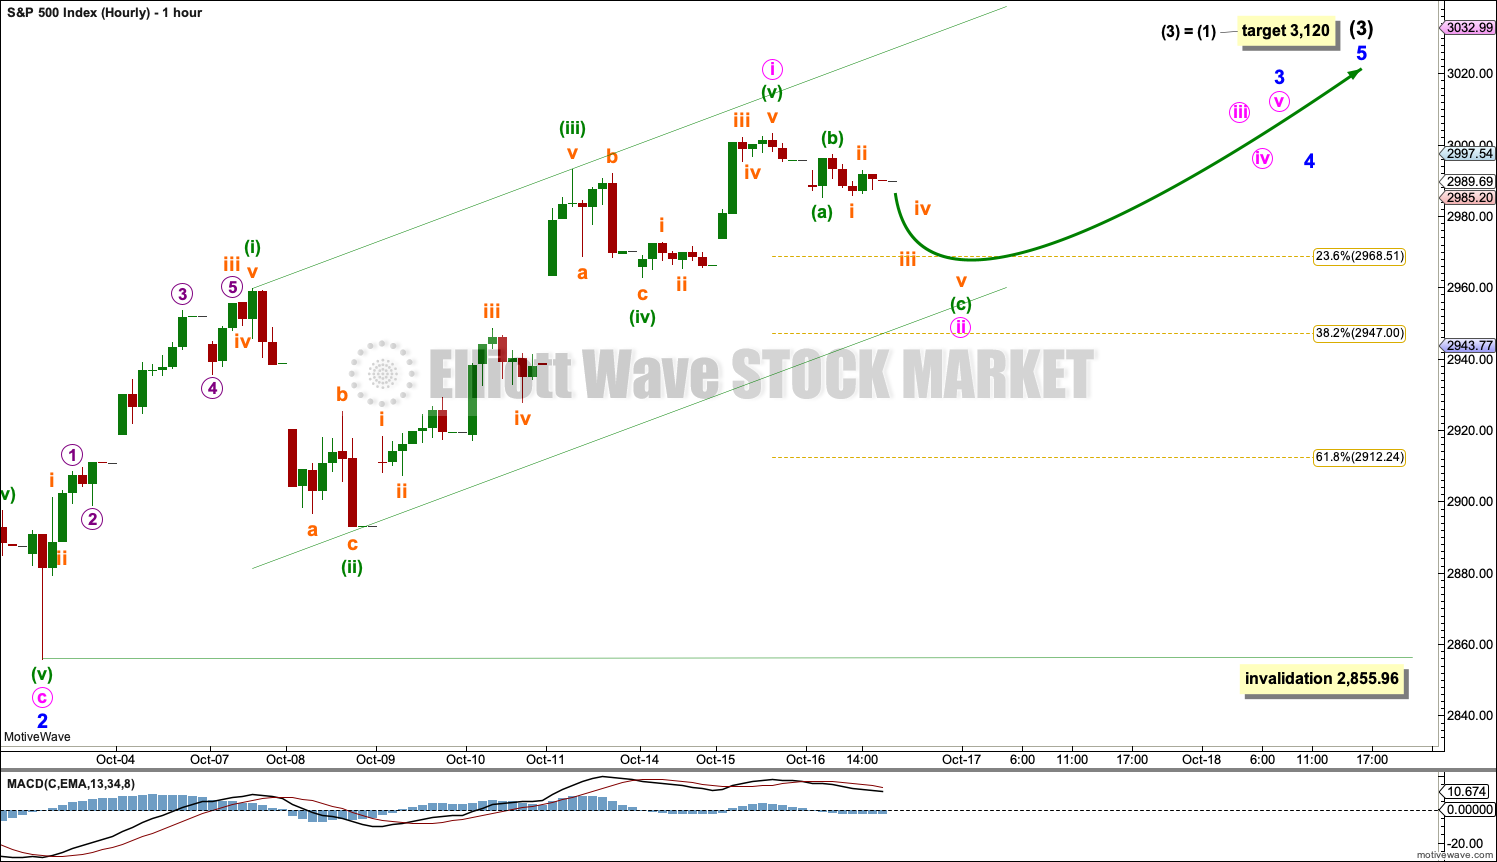
Summary: For the very short term, a little downwards movement to about 2,968 or 2,947 may continue tomorrow. Thereafter, the upwards trend may resume. The next target is at 3,120.
Further confidence that a low is in place and price should make new all time highs very soon would come if either a 90% up day or two back to back 80% up days is seen.
A new low below 2,822.12 would add confidence to an alternate. Expect price at that stage to keep falling to 2,578 – 2,476 to find support at the lower edge of the large teal channel on weekly and daily charts.
The biggest picture, Grand Super Cycle analysis, is here.
Monthly charts were last published here, with video here. There are two further alternate monthly charts here, with video here.
ELLIOTT WAVE COUNTS
The two weekly Elliott wave counts below will be labelled First and Second. They may be about of even probability. When the fifth wave currently unfolding on weekly charts may be complete, then these two wave counts will diverge on the severity of the expected following bear market. To see an illustration of this future divergence monthly charts should be viewed.
FIRST WAVE COUNT
MAIN WEEKLY CHART
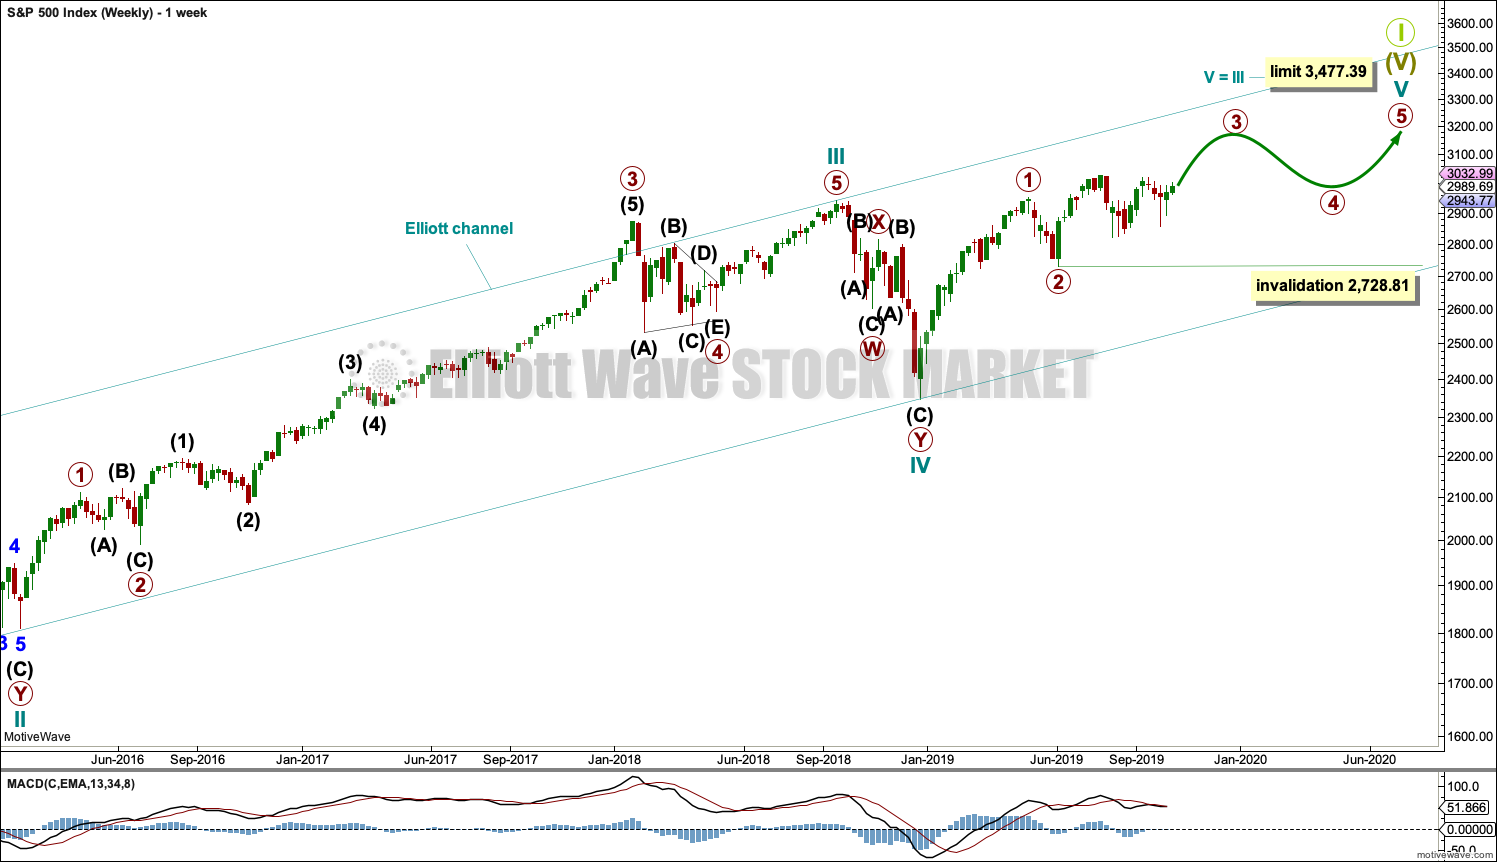
The basic Elliott wave structure consists of a five wave structure up followed by a three wave structure down (for a bull market). This wave count sees the bull market beginning in March 2009 as an incomplete five wave impulse and now within the last fifth wave, which is labelled cycle wave V. This impulse is best viewed on monthly charts. The weekly chart focusses on the end of it.
Elliott wave is fractal. This fifth wave labelled cycle wave V may end a larger fifth wave labelled Super Cycle wave (V), which may end a larger first wave labelled Grand Super Cycle wave I.
The teal Elliott channel is drawn using Elliott’s first technique about the impulse of Super Cycle wave (V). Draw the first trend line from the end of cycle wave I (off to the left of the chart, the weekly candlestick beginning 30th November 2014) to the end of cycle wave III, then place a parallel copy on the end of cycle wave II. This channel perfectly shows where cycle wave IV ended at support. The strongest portion of cycle wave III, the end of primary wave 3, overshoots the upper edge of the channel. This is a typical look for a third wave and suggests the channel is drawn correctly and the way the impulse is counted is correct.
Within Super Cycle wave (V), cycle wave III is shorter than cycle wave I. A core Elliott wave rule states that a third wave may never be the shortest. For this rule to be met in this instance, cycle wave V may not be longer in length than cycle wave III. This limit is at 3,477.39.
Cycle wave V may subdivide either as an impulse or an ending diagonal. Impulses are much more common. This main wave count expects that cycle wave V may be unfolding as an impulse.
The daily chart below will focus on movement from the end of primary wave 2.
In historic analysis, two further monthly charts have been published that do not have a limit to upwards movement and are more bullish than this wave count. Members are encouraged to consider those possibilities (links below summary) alongside the wave counts presented on a daily and weekly basis.
Within cycle wave V, primary waves 1 and 2 may be complete. Within primary wave 3, no second wave correction may move beyond its start below 2,728.81.
MAIN DAILY CHART
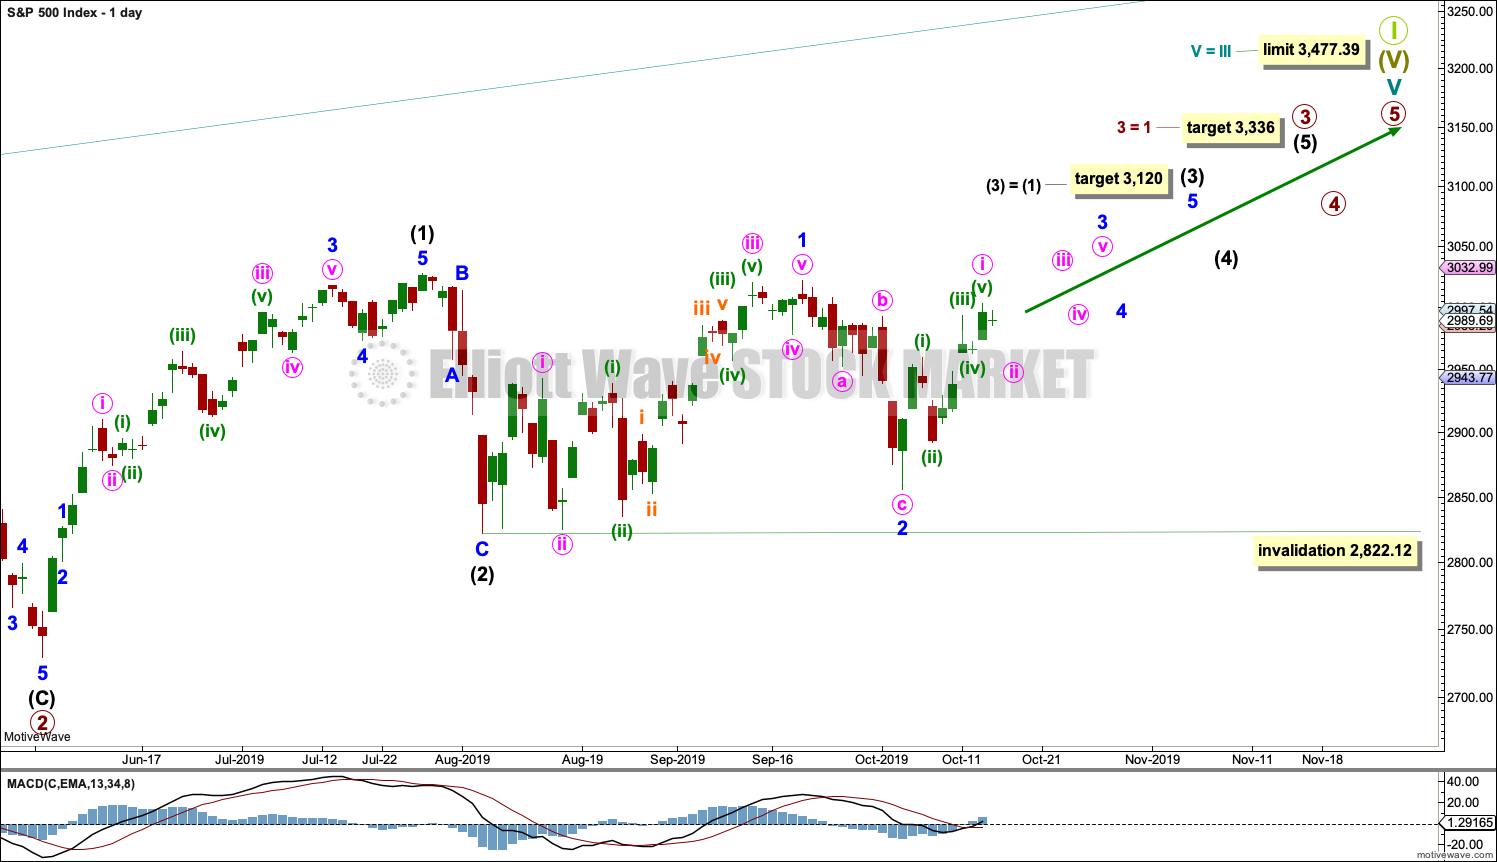
Primary wave 3 may have begun.
All of primary wave 3, intermediate wave (3) and minor wave 3 may only subdivide as impulses. Within each impulse, its second wave correction may not move beyond the start of its first wave.
Minor wave 2 may not move beyond the start of minor wave 1 below 2,822.12. It is still possible that minor wave 2 may continue lower as a double zigzag. The invalidation point is left the same to allow for this possibility.
Intermediate wave (3) must move far enough above the end of intermediate wave (1) to then allow intermediate wave (4) to unfold and remain above intermediate wave (1) price territory.
HOURLY CHART
Minor wave 2 should be over.
Minor wave 3 may only subdivide as an impulse. Within the impulse, minute wave i may have been over at yesterday’s high. Minute wave ii may continue as a relatively brief and shallow correction. The strong upwards pull of a third wave at four degrees may force minute wave ii to be more shallow than usual.
Minute wave ii may not move beyond the start of minute wave i below 2,855.96.
ALTERNATE WEEKLY CHART
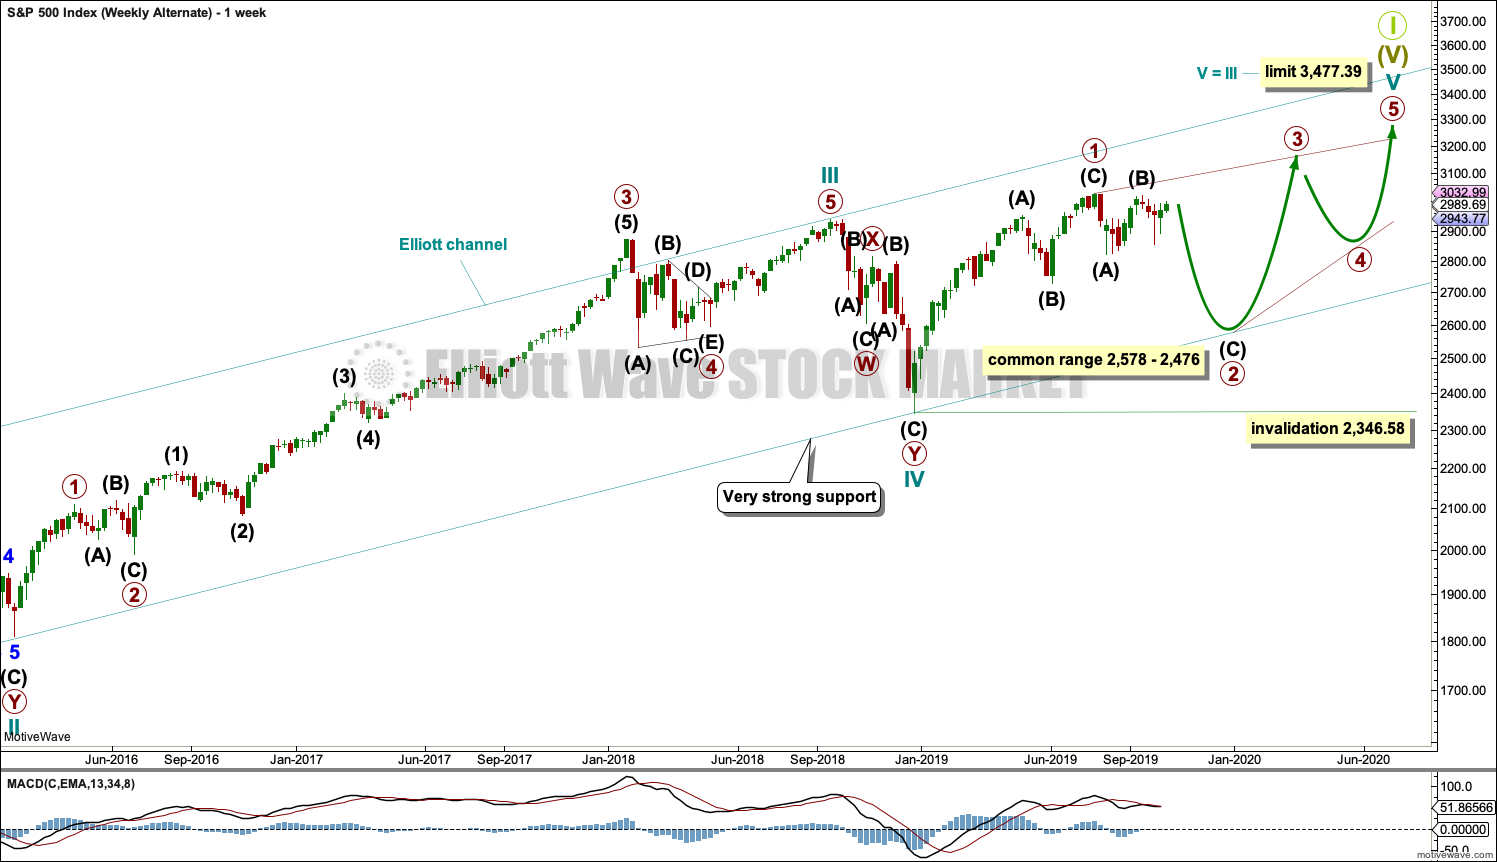
Cycle wave V may be subdividing as an ending diagonal. Within ending diagonals, all sub-waves must subdivide as zigzags. Primary wave 1 may be over at the last all time high as a zigzag.
Primary wave 2 must complete lower as a zigzag.
The second and fourth waves within diagonals are usually very deep, commonly between 0.81 to 0.66 the depth of the prior wave. This gives a target zone for primary wave 2.
Primary wave 2 may end if it comes down to find support at the lower edge of the teal channel, which is copied over from monthly and weekly charts. This trend line should provide final support for a deeper pullback.
Primary wave 2 may not move beyond the start of primary wave 1 below 2,346.58.
Within primary wave 2, intermediate wave (B) may not move beyond the start of intermediate wave (A) above 3.027.98. A new all time high would invalidate this wave count.
This alternate wave count is provided only for those members who wish to follow a more bearish wave count due to their own personal analysis. It is my judgement that this wave count has a very low probability.
SECOND WAVE COUNT
WEEKLY CHART
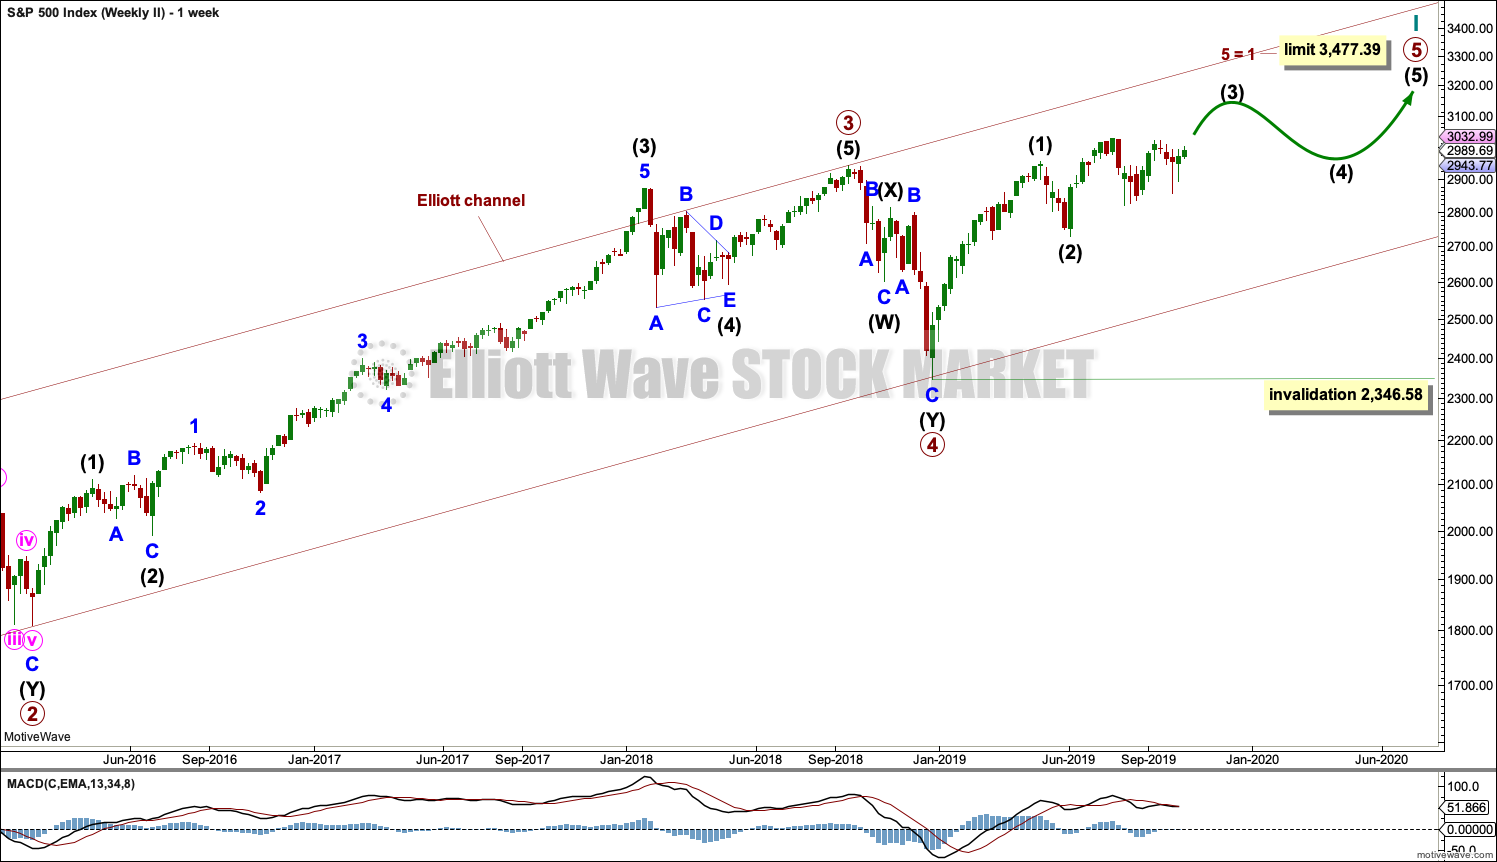
This weekly chart is almost identical to the first weekly chart, with the sole exception being the degree of labelling.
This weekly chart moves the degree of labelling for the impulse beginning in March 2009 all down one degree. This difference is best viewed on monthly charts.
The impulse is still viewed as nearing an end; a fifth wave is still seen as needing to complete higher. This wave count labels it primary wave 5.
Primary wave 5 may be subdividing as either an impulse or ending diagonal, in the same way that cycle wave V is seen for the first weekly chart.
TECHNICAL ANALYSIS
WEEKLY CHART
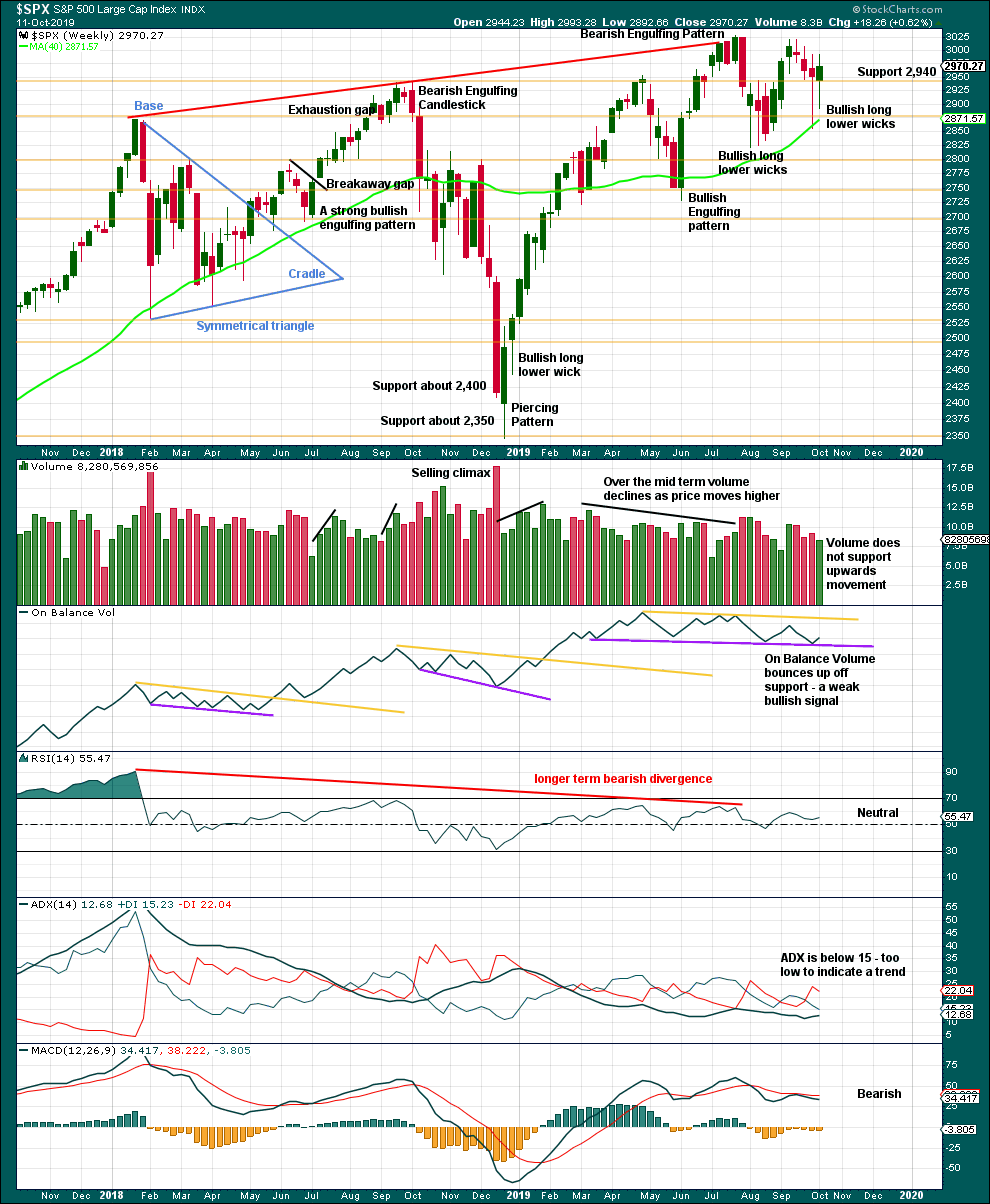
Click chart to enlarge. Chart courtesy of StockCharts.com.
Two long lower wicks now suggest more upwards movement ahead. A decline in volume with upwards movement is not of a concern in current market conditions.
DAILY CHART
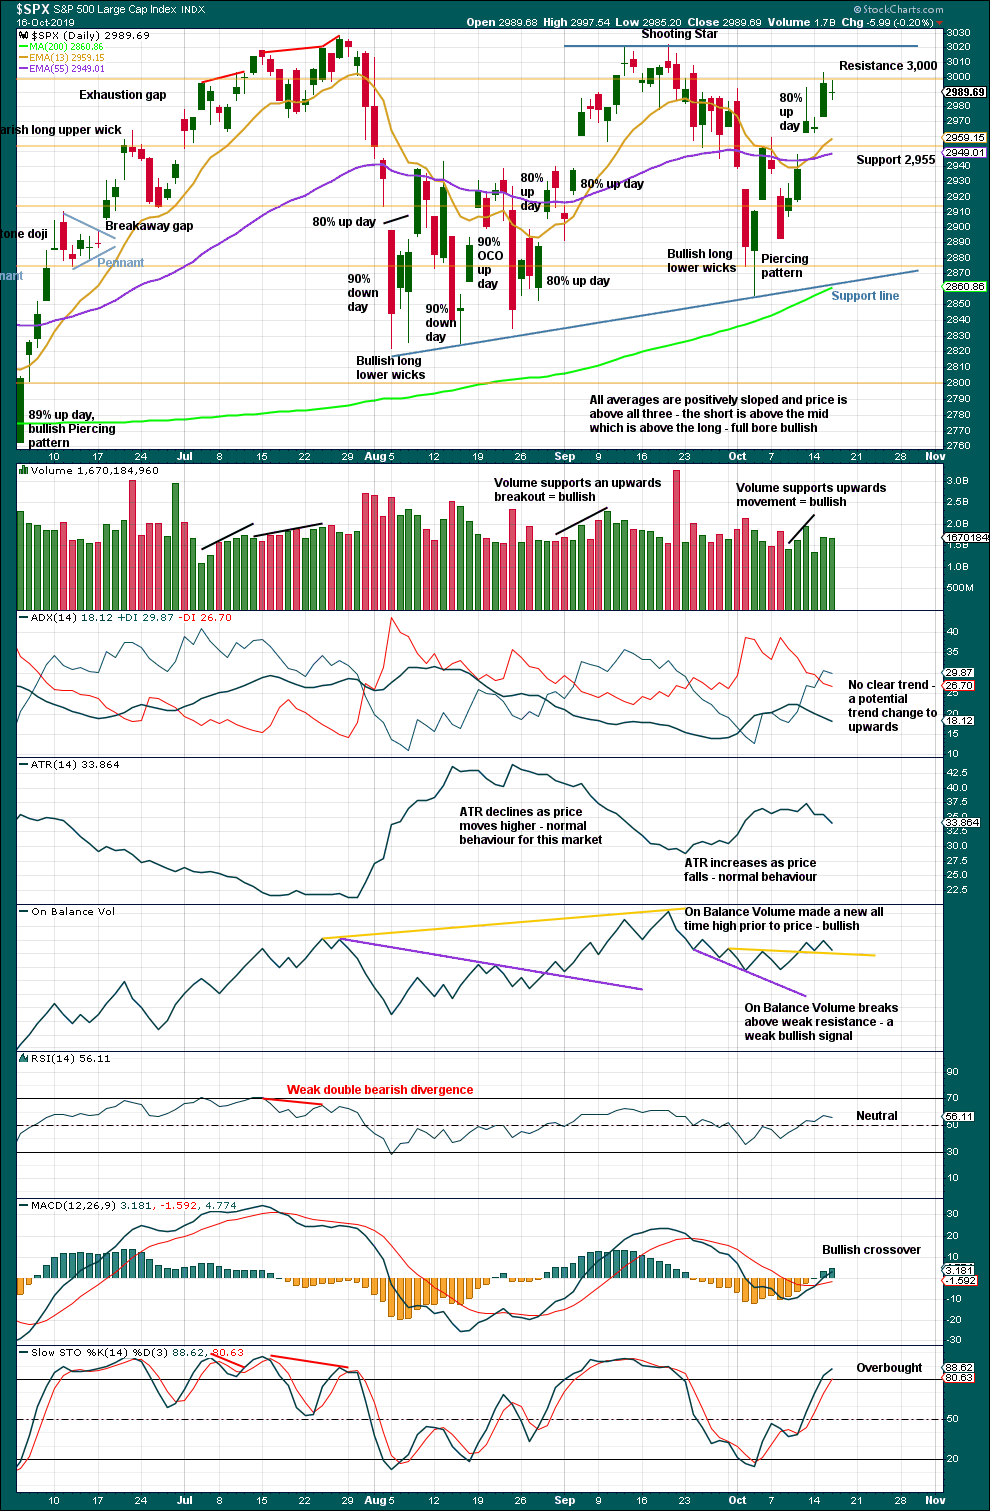
Click chart to enlarge. Chart courtesy of StockCharts.com.
There is now a series of higher highs and higher lows since the 5th of August. Strength in 90% up days and back to back 80% up days off lows indicate the lows may still be sustainable.
There is a little strength in the current upwards movement, but with no 90% upwards day nor two back to back 80% upwards days the risk of a near term pullback is reasonable. There should be fairly strong support about the rising support line below.
BREADTH – AD LINE
WEEKLY CHART
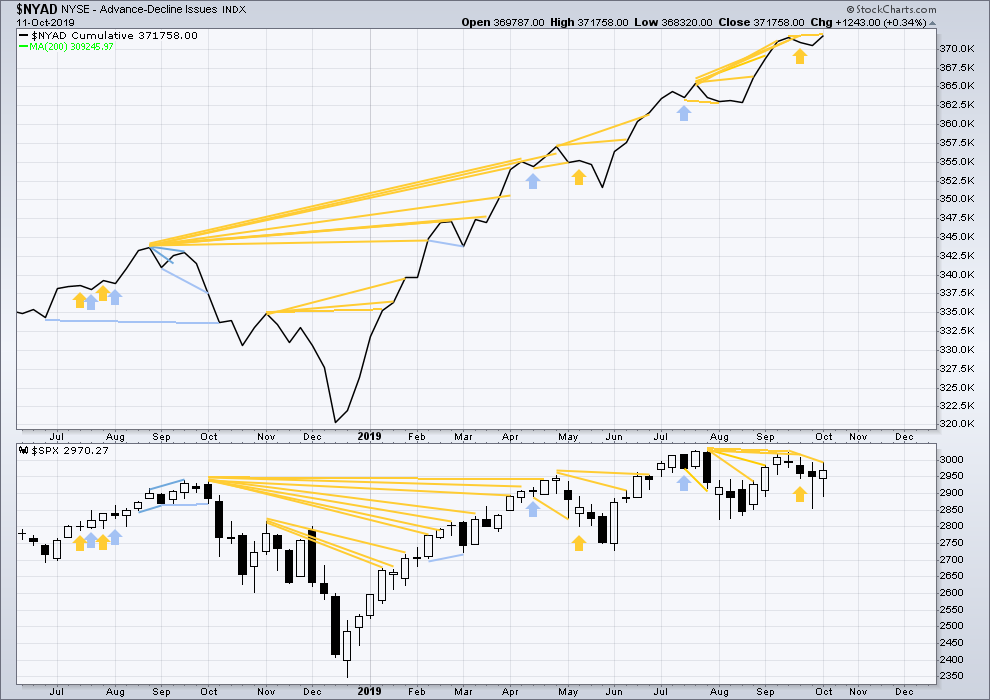
Click chart to enlarge. Chart courtesy of StockCharts.com. So that colour blind members are included, bearish signals
will be noted with blue and bullish signals with yellow.
Bear markets from the Great Depression and onwards have been preceded by an average minimum of 4 months divergence between price and the AD line with only two exceptions in 1946 and 1976. With the AD line making new all time highs again this week, the end of this bull market and the start of a new bear market is very likely a minimum of 4 months away, which is mid February 2020.
In all bear markets in the last 90 years there is some positive correlation (0.6022) between the length of bearish divergence and the depth of the following bear market. No to little divergence is correlated with more shallow bear markets. Longer divergence is correlated with deeper bear markets.
If a bear market does develop here, it comes after no bearish divergence. It would therefore more likely be shallow.
Small caps have made a new swing high above the prior high of the end of July, but mid and large caps have not yet done so. The last upwards movement appears to be led by small caps. Because small caps are usually the first to exhibit deterioration in the later stages of a bull market, some strength in small caps at this stage indicates a healthy bull market with further to run.
Last week the AD line makes another new all time high. This divergence is bullish and strongly supports the main Elliott wave count.
DAILY CHART
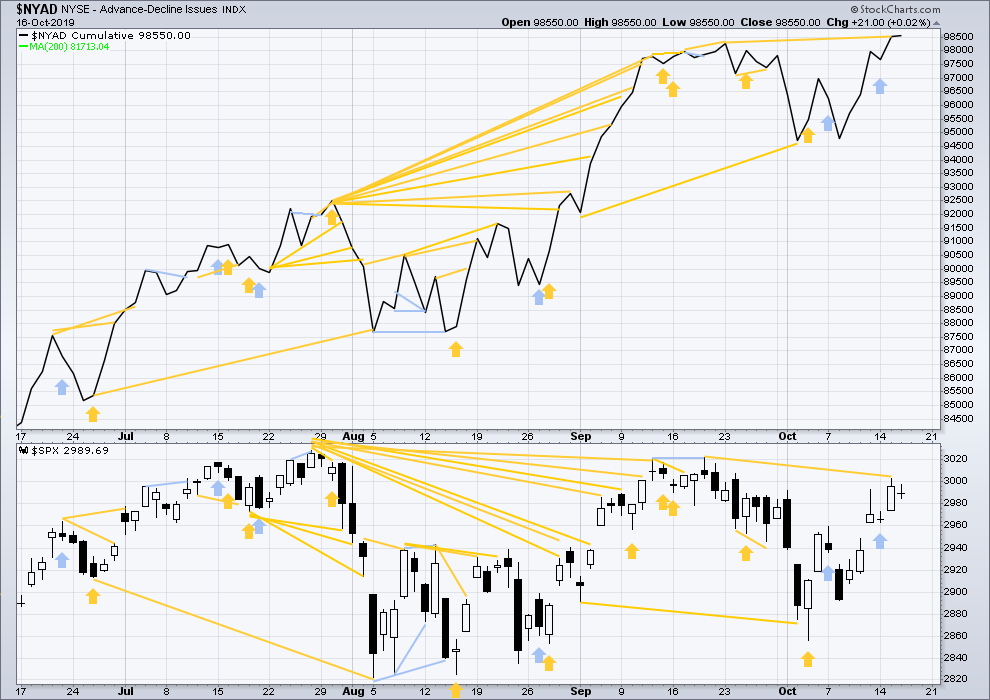
Click chart to enlarge. Chart courtesy of StockCharts.com. So that colour blind members are included, bearish signals
will be noted with blue and bullish signals with yellow.
Breadth should be read as a leading indicator.
A new all time high yesterday from the AD line is a very bullish signal. This divergence strongly supports the main Elliott wave count.
Today price and the AD line have both moved sideways. There is no new divergence.
VOLATILITY – INVERTED VIX CHART
WEEKLY CHART
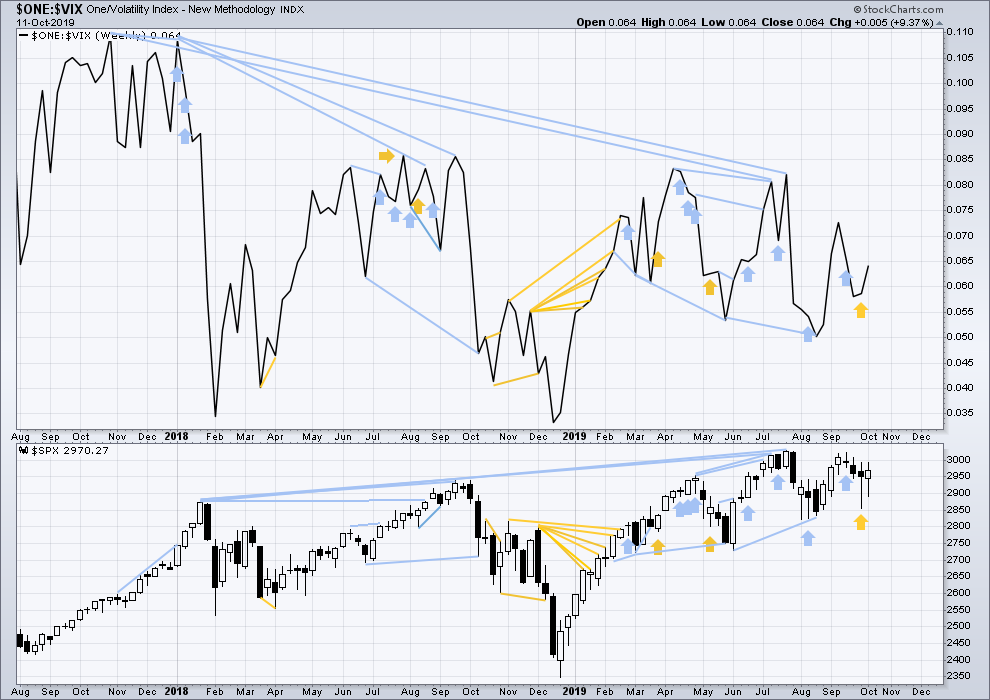
Click chart to enlarge. Chart courtesy of StockCharts.com. So that colour blind members are included, bearish signals
will be noted with blue and bullish signals with yellow.
The all time high for inverted VIX (which is the same as the low for VIX) was on 30th October 2017. There is now nearly two years of bearish divergence between price and inverted VIX.
The rise in price is not coming with a normal corresponding decline in VIX; VIX remains elevated. This long-term divergence is bearish and may yet develop further as the bull market matures.
This divergence may be an early warning, a part of the process of a top developing that may take years. It may not be useful in timing a trend change.
Last week both price and inverted VIX have moved higher. Neither have made new short-term swing highs. There is no new divergence.
DAILY CHART
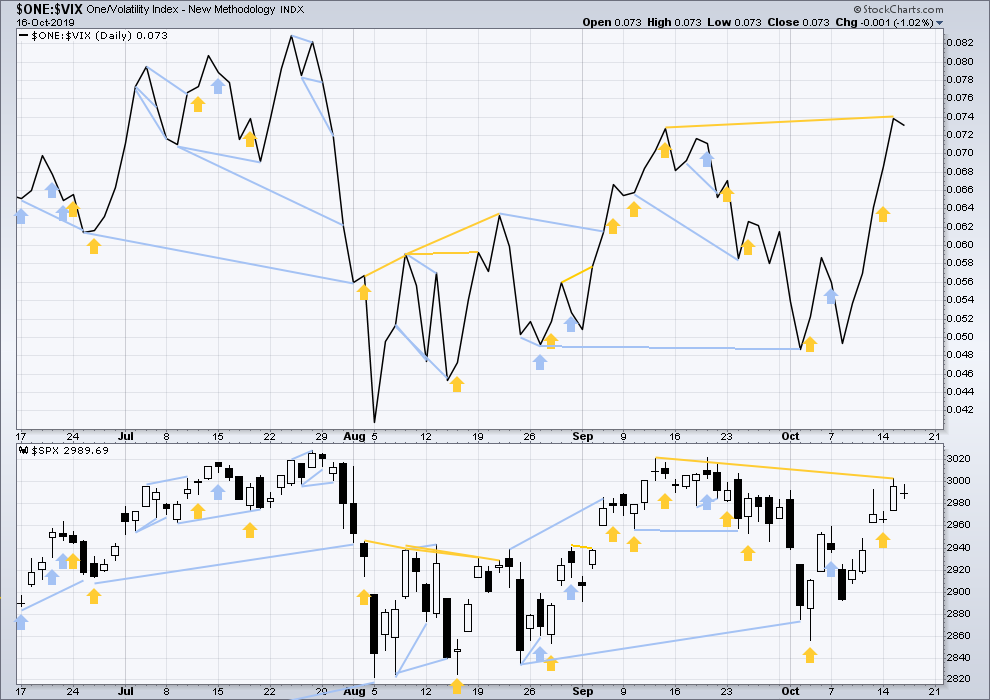
Click chart to enlarge. Chart courtesy of StockCharts.com. So that colour blind members are included, bearish signals
will be noted with blue and bullish signals with yellow.
Yesterday inverted VIX makes a new short/mid-term swing high, but price has not. This divergence is bullish and will be given some weight as it confirms the bullish signal today from the AD line.
Today a small range inside day from price and a small decline in inverted VIX, which has not made a new swing low, offers no new divergence.
DOW THEORY
Dow Theory confirmed a bear market in December 2018. This does not necessarily mean a bear market at Grand Super Cycle degree though; Dow Theory makes no comment on Elliott wave counts. On the 25th of August 2015 Dow Theory also confirmed a bear market. The Elliott wave count sees that as part of cycle wave II. After Dow Theory confirmation of a bear market in August 2015, price went on to make new all time highs and the bull market continued.
DJIA: 23,344.52 – a close on the 19th of December at 23,284.97 confirms a bear market.
DJT: 9,806.79 – price has closed below this point on the 13th of December.
S&P500: 2,532.69 – a close on the 19th of December at 2,506.96 provides support to a bear market conclusion.
Nasdaq: 6,630.67 – a close on the 19th of December at 6,618.86 provides support to a bear market conclusion.
With all the indices having moved higher following a Dow Theory bear market confirmation, Dow Theory would confirm a bull market if the following highs are made:
DJIA: 26,951.81 – a close above this point has been made on the 3rd of July 2019.
DJT: 11,623.58 – to date DJT has failed to confirm an ongoing bull market.
S&P500: 2,940.91 – a close above this point was made on the 29th of April 2019.
Nasdaq: 8,133.30 – a close above this point was made on the 26th of April 2019.
Published @ 07:08 p.m. EST.
—
Careful risk management protects your trading account(s).
Follow my two Golden Rules:
1. Always trade with stops.
2. Risk only 1-5% of equity on any one trade.
—
New updates to this analysis are in bold.

The AD line has made a new all time high today, and you all know by now that I view that as a very bullish signal.
This does not preclude a near term small pullback, but it does strongly support the main Elloitt Wave count.
however, Lowry’s see a little weakness in todays upwards move and VIX has increased (does not confirm bullishness from the AD line) so I’m reverting to labelling minute ii as incomplete
there is risk here of another small pullback at resistance
hourly chart updated
I’m labelling minute ii over but I’m leaving the invalidation point as is to allow for the possibility that it is not over and may move lower
lets see if there is any strength in todays upwards movement
if not, then a near term pullback here at resistance may begin tomorrow, minute ii may not be over
if there is strength then I shall leave this chart as is
important to keep in mind that SPX is now back to the top of the range, and showing some early signs of stalling, and if we “assume the future will be like the past” (a more generalized version of “assume a trend in motion will continue until proven otherwise”), then we assume it will go back down into the range. Certainly as likely as not anyway. I’m being very cautious with my short term long position here, and starting to think about short triggers.
the RUT has gotten very close to a 61.8% and a high fit swing target. meanwhile the SPX is turning on a level I projected from the swing as of Monday. The action upward is very B/X wave-ish (weak). My suspicion re: time to zoom back down to a high volume node in the range below is rising by the minute. i’ve already a pilot short…we’ll see.
SPX projections. red marks some short trigger spots.
Makes some good sense, Kevin. I’m looking forward to Lara’s update.
Lara your October inter-month “Trends” report has a small typo. You have a section on the DVN chart (which you show), but the name you associate with “DVN” isn’t Devon Energy, it’s United Technologies (which is of course UTX). This is on page 12.
oops! thank you Kevin
I’ll ask Cesar to fix it
Well, that very well could be B of ii as an expanded flat, we could end ii around 2975-80, maybe tomorrow or Monday….
It seems to me that HoD & LoD is in today and we may very well balance around here
You may be on to something there my friend.
I think sunday night in the ETH could be the buy the dip as UK has parliament vote for Brexit on Saturday and most likely to be rejected…
IF that would be the case then Futures will gap down and could be the buy…
Obviously in case of approval they very well open gap up but IMO that is a low probability, so be aware of the risk going into this weekend
thanks for the heads up hashtrader. I’m presuming they do the sane thing and not hard exit…but obviously anything is possible.
Well I think if parliament votes no then UK will ask for extension until 31st Jan 2020….
It’s gonna go on for a while
I’m republishing a count I posted on October 11. I still like this count much better than the main count.
I see wave 3 of 5 red on the 15, and wave 4 as a nice triangle yesterday. Wave 5 today is possibly finished or may have a last hurrah.
I’m waiting for a correction into the 2960s.
Some higher potential stall/pivot levels above. 3015, 3022, 2028.
And the same for RUT. 1542-44 has a lot of potential as a stall/pivot level, coming up soon! Loving this action overall…
The McClellan Oscillator is currently at +35 or so. The oscillator is confirming the upmove from SPX 2856 as a sustainable ongoing rally. I suspect we may see the 90% upday that Lara is looking for to add significant confidence in the main count.
Hey, nice open for us bulls. I am going to guess that Minute ii is over. It may be that Lara will make a change of degree to the labeling to accommodate this morning’s move up. At this point we are only 19 points away from a new ATH in the SPX. Maybe today. But most likely early next week.
So much for the October syndrome when everyone thinks October must be a down hard month.
I should have mentioned, the potential for Minute ii to be shallow and relatively short in duration was the main reason for establishing my long positions on Monday. Today I am rewarded.
Well played Rodney.
I am in as of a few days ago via UPRO and UWM too (some adding at open today as well). But more broadly, most of my money is deployed by selling put spreads below market on various larger cap strongly bullish issues. I’m really liking this tactic in these market conditions. Gets me on the right side of capturing $ from premium decay (“free money”!), and assuring it all with rising prices. Eliminates daily or intraday trading grind. I sell them fairly deep below market using whatever structural support/resistance features are there, and only after some kind of pullback and turn. Of course, if the whole market turns south big time I’m in some pain, but that’s true of any and every long strategy. Using this technique I have positions in AMZN, AMGN, AVGO, BLUE, COST, DIS, ECL, EEM, FB, HD, LMT, MA, MSFT, NVDA, and RUT. Expiries from Nov out to Jan. I also have a few sold puts in ROKU and ALGN.
Here’s to the bull roaring!
BTW, I have the RUT in a minor 3 of an intermediate 3 of a primary 3 up. While I think that’s most probable, obviously until RUT escapes its consolidation range that’s by no means confirmed.
What is interesting is that it’s in a MONTHLY squeeze (7th month!), and it’s in a WEEKLY squeeze (5th week). It could roar here in 2020 if it can break to the upside out of it’s massive range.
Squeezes BTW are when the 20 period standard Bollinger bands come “inside” the 15 period Keltner channels. Bollingers are based on overall price volatility (standard deviation of closes). Keltners are based on average true range of bars. So when the overall price ranging gets quite low relative to the range of the bars themselves, a “squeeze” happens, and often price eventually explodes out in one direction or another. It’s a key set up used by a lot of traders these days.
Flag captured!