The bounce at the end of today’s session is carefully analysed for signs of strength or weakness to identify if the main or alternate Elliott wave count is more likely.
Summary: Lack of strength in upwards movement today favours the alternate Elliott wave count.
The trend for the short term is down until proven otherwise. Proven otherwise would be any one of either:
– A new high above 2,952.86.
– A 90% up day.
– Two back to back 80% up days.
– A bullish candlestick reversal pattern with support from volume (today’s Piercing pattern lacks support from volume)
The main wave count expects the pullback is over here or very soon indeed.
A new low below 2.822.12 would invalidate the main wave count and add confidence to an alternate. Expect price at that stage to keep falling to 2,578 – 2,476 to find support at the lower edge of the large teal channel on weekly and daily charts.
The biggest picture, Grand Super Cycle analysis, is here.
Monthly charts were last published here, with video here. There are two further alternate monthly charts here, with video here.
ELLIOTT WAVE COUNTS
The two weekly Elliott wave counts below will be labelled First and Second. They may be about of even probability. When the fifth wave currently unfolding on weekly charts may be complete, then these two wave counts will diverge on the severity of the expected following bear market. To see an illustration of this future divergence monthly charts should be viewed.
FIRST WAVE COUNT
WEEKLY CHART
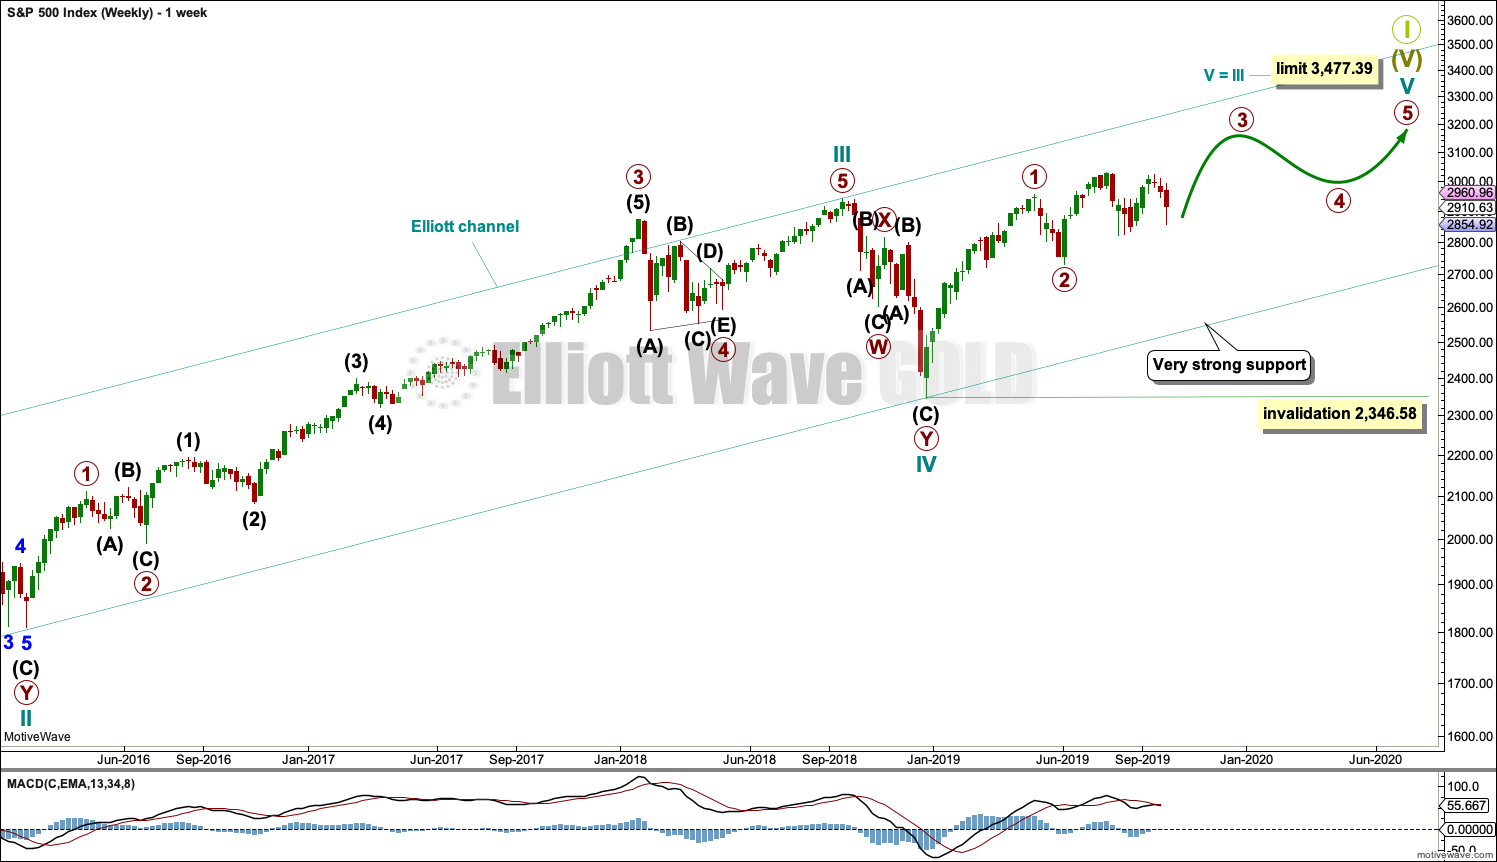
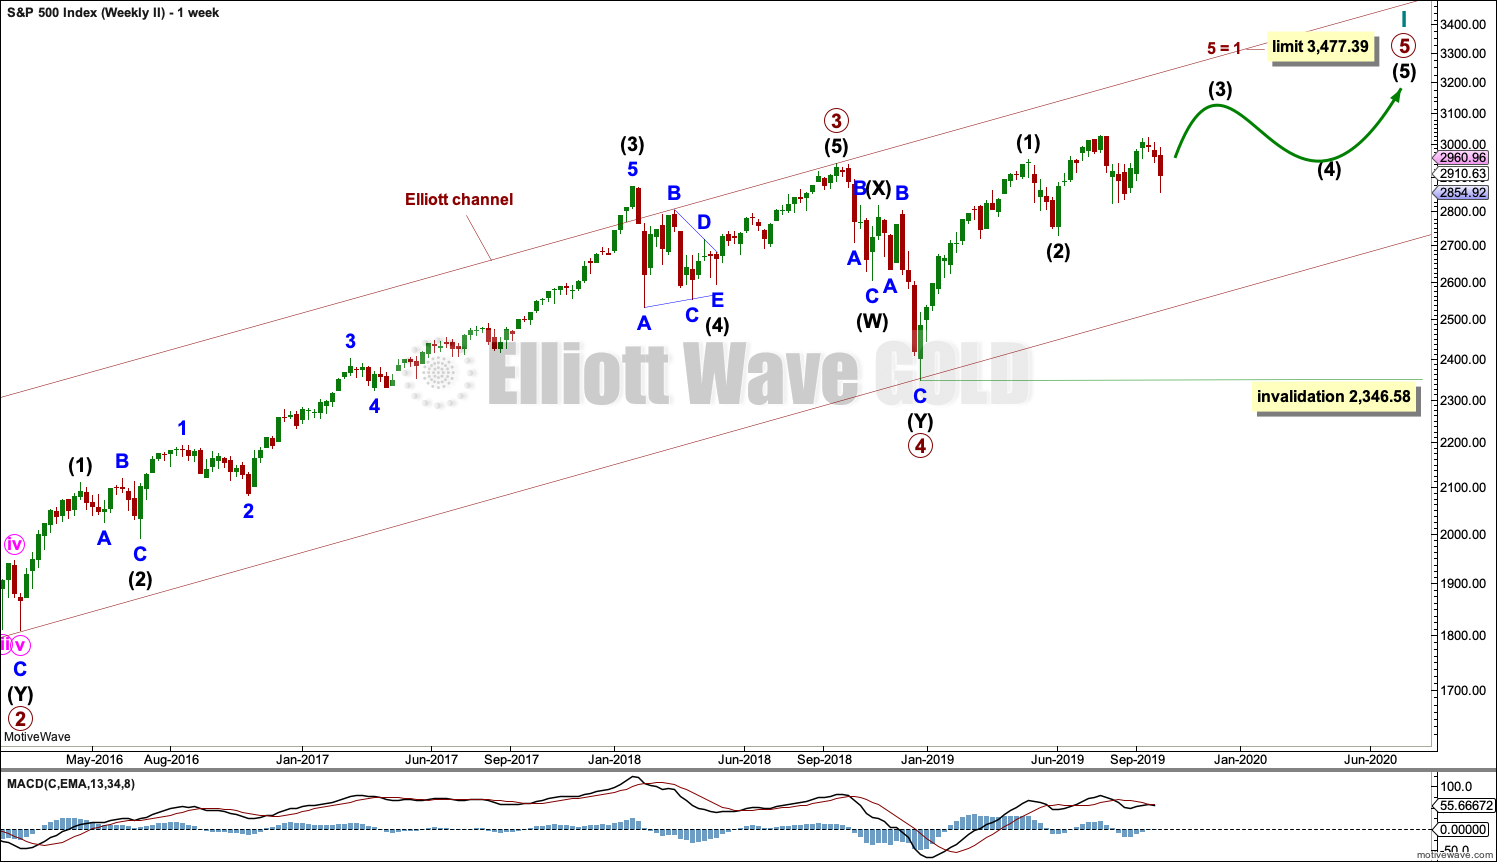
The basic Elliott wave structure consists of a five wave structure up followed by a three wave structure down (for a bull market). This wave count sees the bull market beginning in March 2009 as an incomplete five wave impulse and now within the last fifth wave, which is labelled cycle wave V. This impulse is best viewed on monthly charts. The weekly chart focusses on the end of it.
Elliott wave is fractal. This fifth wave labelled cycle wave V may end a larger fifth wave labelled Super Cycle wave (V), which may end a larger first wave labelled Grand Super Cycle wave I.
The teal Elliott channel is drawn using Elliott’s first technique about the impulse of Super Cycle wave (V). Draw the first trend line from the end of cycle wave I (off to the left of the chart, the weekly candlestick beginning 30th November 2014) to the end of cycle wave III, then place a parallel copy on the end of cycle wave II. This channel perfectly shows where cycle wave IV ended at support. The strongest portion of cycle wave III, the end of primary wave 3, overshoots the upper edge of the channel. This is a typical look for a third wave and suggests the channel is drawn correctly and the way the impulse is counted is correct.
Within Super Cycle wave (V), cycle wave III is shorter than cycle wave I. A core Elliott wave rule states that a third wave may never be the shortest. For this rule to be met in this instance, cycle wave V may not be longer in length than cycle wave III. This limit is at 3,477.39.
Cycle wave V may subdivide either as an impulse or an ending diagonal. Impulses are much more common. This main wave count expects that cycle wave V may be unfolding as an impulse.
The daily charts below will focus on all of cycle wave V.
In historic analysis, two further monthly charts have been published that do not have a limit to upwards movement and are more bullish than this wave count. Members are encouraged to consider those possibilities (links below summary) alongside the wave counts presented on a daily and weekly basis.
MAIN DAILY CHART
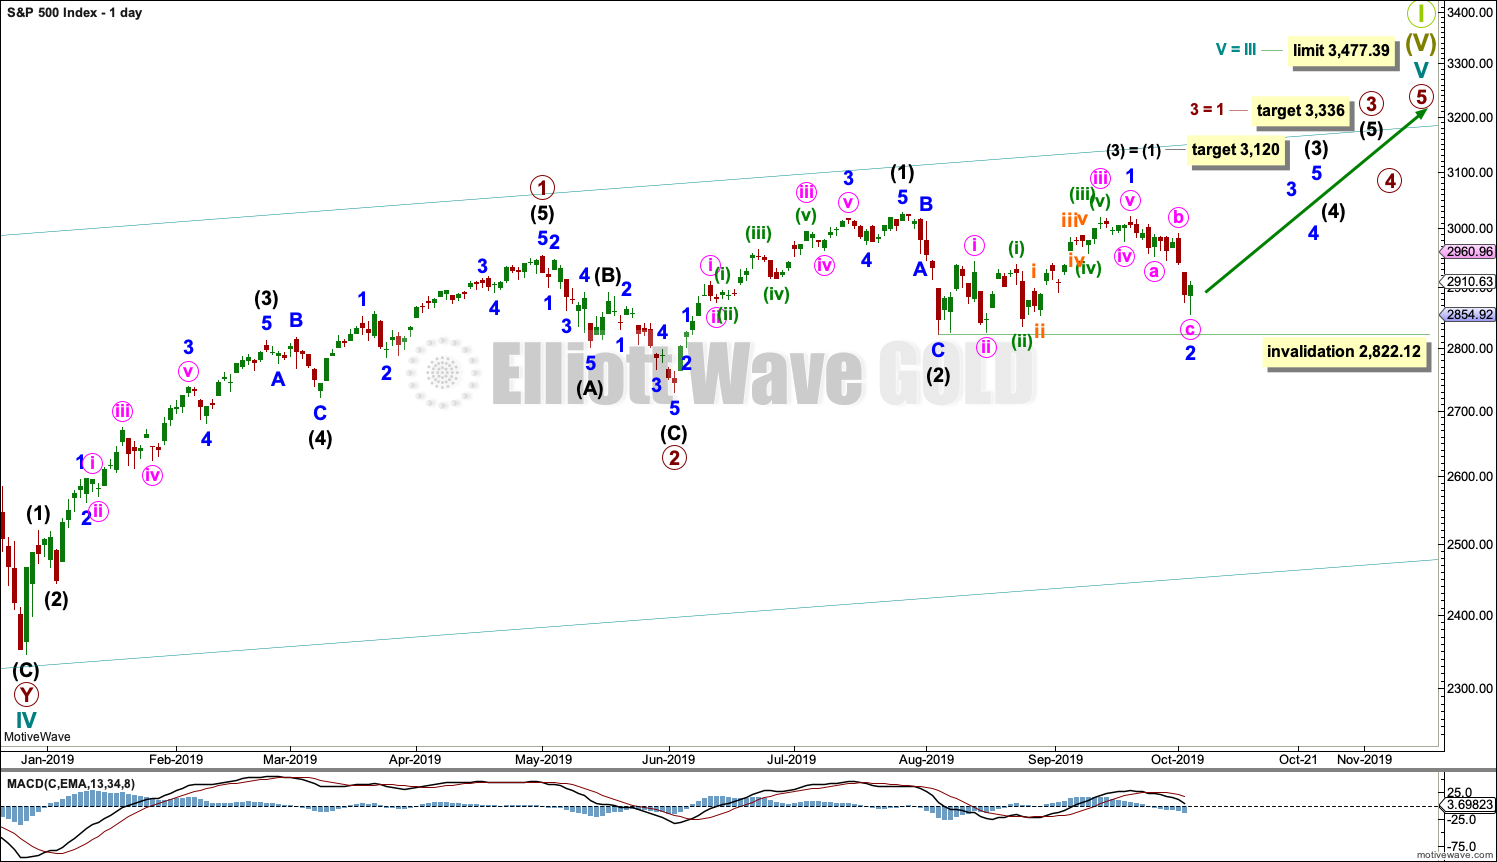
Primary wave 3 may have begun.
All of primary wave 3, intermediate wave (3) and minor wave 3 may only subdivide as impulses. Within each impulse, its second wave correction may not move beyond the start of its first wave.
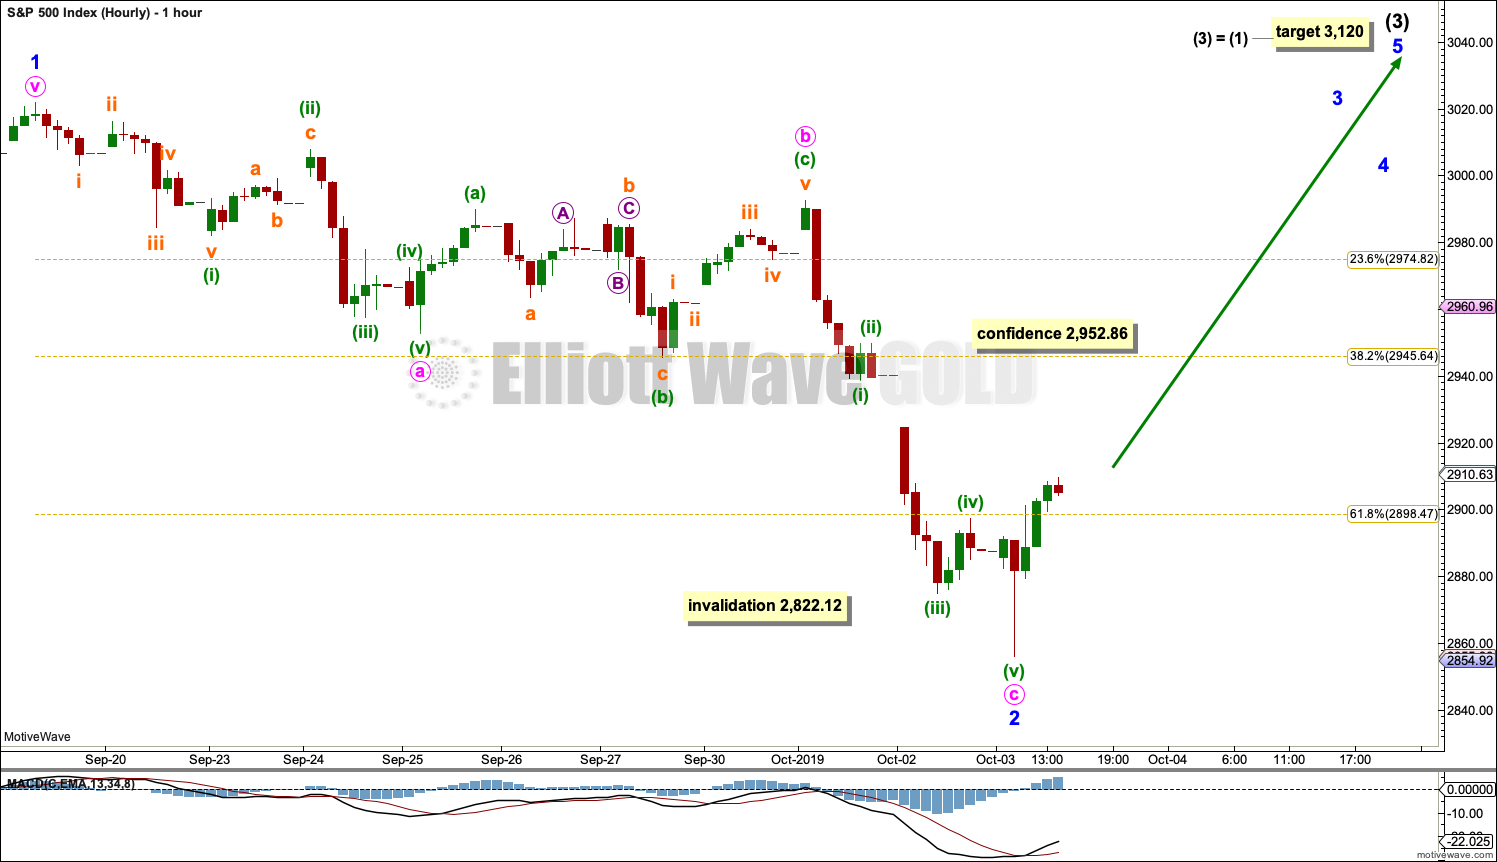
Minor wave 2 may not move beyond the start of minor wave 1 below 2,822.12.
Intermediate wave (3) must move far enough above the end of intermediate wave (1) to then allow intermediate wave (4) to unfold and remain above intermediate wave (1) price territory.
HOURLY CHART
If a second wave correction is unfolding lower, then it would most likely subdivide as a zigzag.
It is again possible that minor wave 2 could be over at today’s low. But this wave count still requires a new high above 2,952.86 or support from technical analysis for confidence.
Minute wave c exhibits no Fibonacci Ratio to minute wave a.
There is still room for minute wave c to extend lower. Minor wave 2 may not move beyond the start of minor wave 1 below 2,822.12.
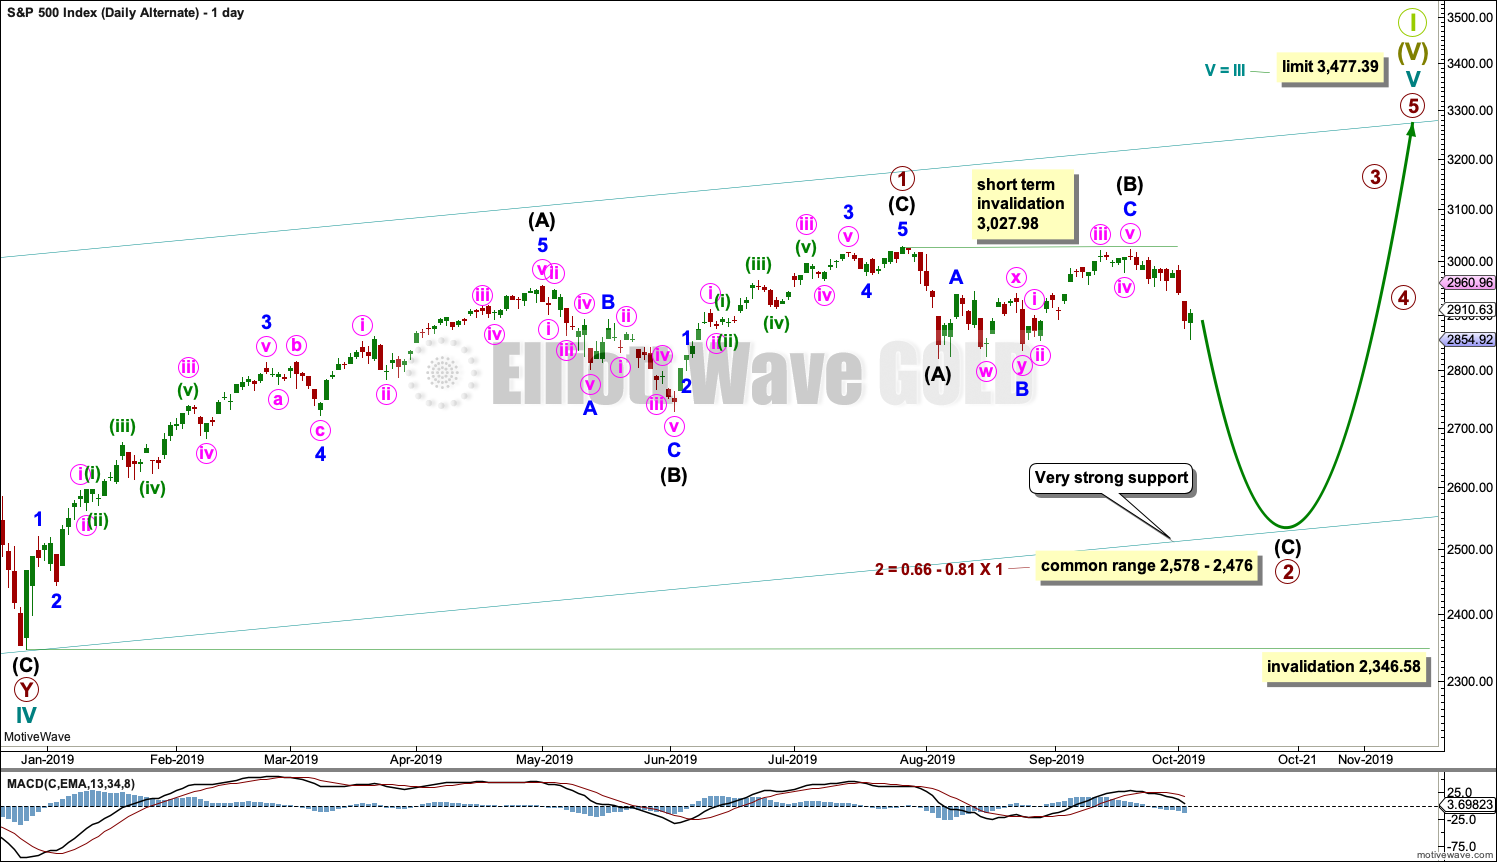
ALTERNATE DAILY CHART
This wave count has been published before. It remains valid, and now is time to again consider this possibility.
Cycle wave V may be subdividing as an ending diagonal. Within ending diagonals, all sub-waves must subdivide as zigzags. Primary wave 1 may be over at the last all time high as a zigzag.
Primary wave 2 must complete lower as a zigzag.
The second and fourth waves within diagonals are usually very deep, commonly between 0.81 to 0.66 the depth of the prior wave. This gives a target zone for primary wave 2.
Primary wave 2 may end if it comes down to find support at the lower edge of the teal channel, which is copied over from monthly and weekly charts. This trend line should provide final support for a deeper pullback.
Primary wave 2 may not move beyond the start of primary wave 1 below 2,346.58.
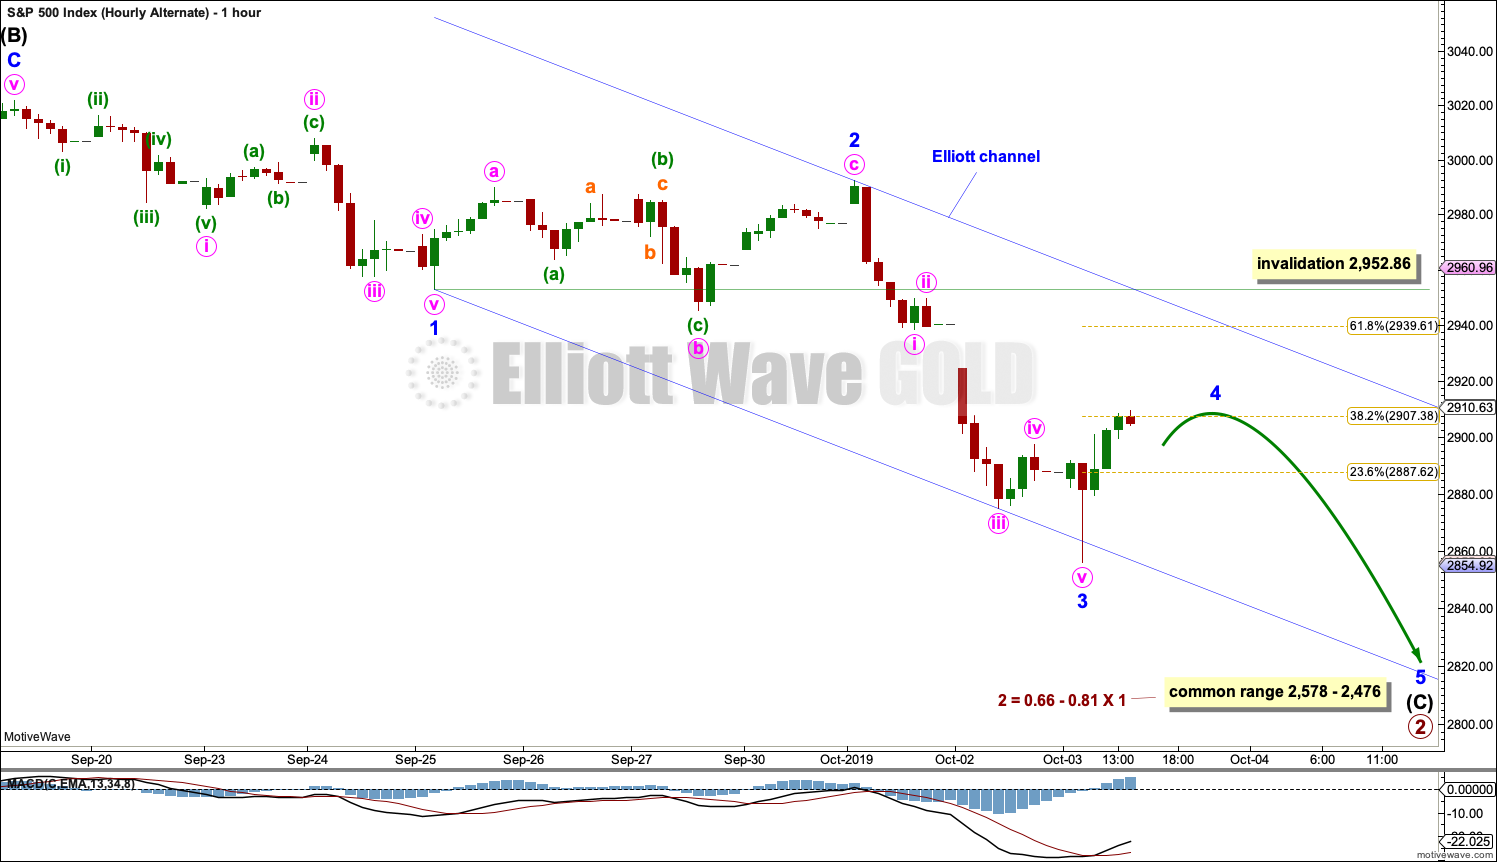
ALTERNATE HOURLY CHART
Intermediate wave (C) must subdivide as a five wave structure, most likely an impulse. So far within the impulse, minor waves 1 through to 3 may be complete.
Minor wave 3 no longer exhibits a Fibonacci Ratio to minor wave 1.
Minor wave 4 may not move into minor wave 1 price territory above 2,952.86.
Minor wave 2 was a deep 0.57 expanded flat correction. Given the guideline of alternation, minor wave 4 may be expected to be shallow and most likely a zigzag, triangle or combination. Minor wave 4 should last at least one session and likely a few so that it shows up on the daily chart, giving intermediate wave (C) a five wave look at higher time frames.
So far minor wave 4 has reached the 0.382 Fibonacci ratio of minor wave 3, but it looks too brief to be over here. It may now continue sideways for another one to few sessions as most likely a triangle or combination. This would give better proportion with minor wave 2, and give intermediate wave (C) a five wave look on the daily chart.
SECOND WAVE COUNT
WEEKLY CHART
This weekly chart is almost identical to the first weekly chart, with the sole exception being the degree of labelling.
This weekly chart moves the degree of labelling for the impulse beginning in March 2009 all down one degree. This difference is best viewed on monthly charts.
The impulse is still viewed as nearing an end; a fifth wave is still seen as needing to complete higher. This wave count labels it primary wave 5.
TECHNICAL ANALYSIS
WEEKLY CHART
Click chart to enlarge. Chart courtesy of StockCharts.com.
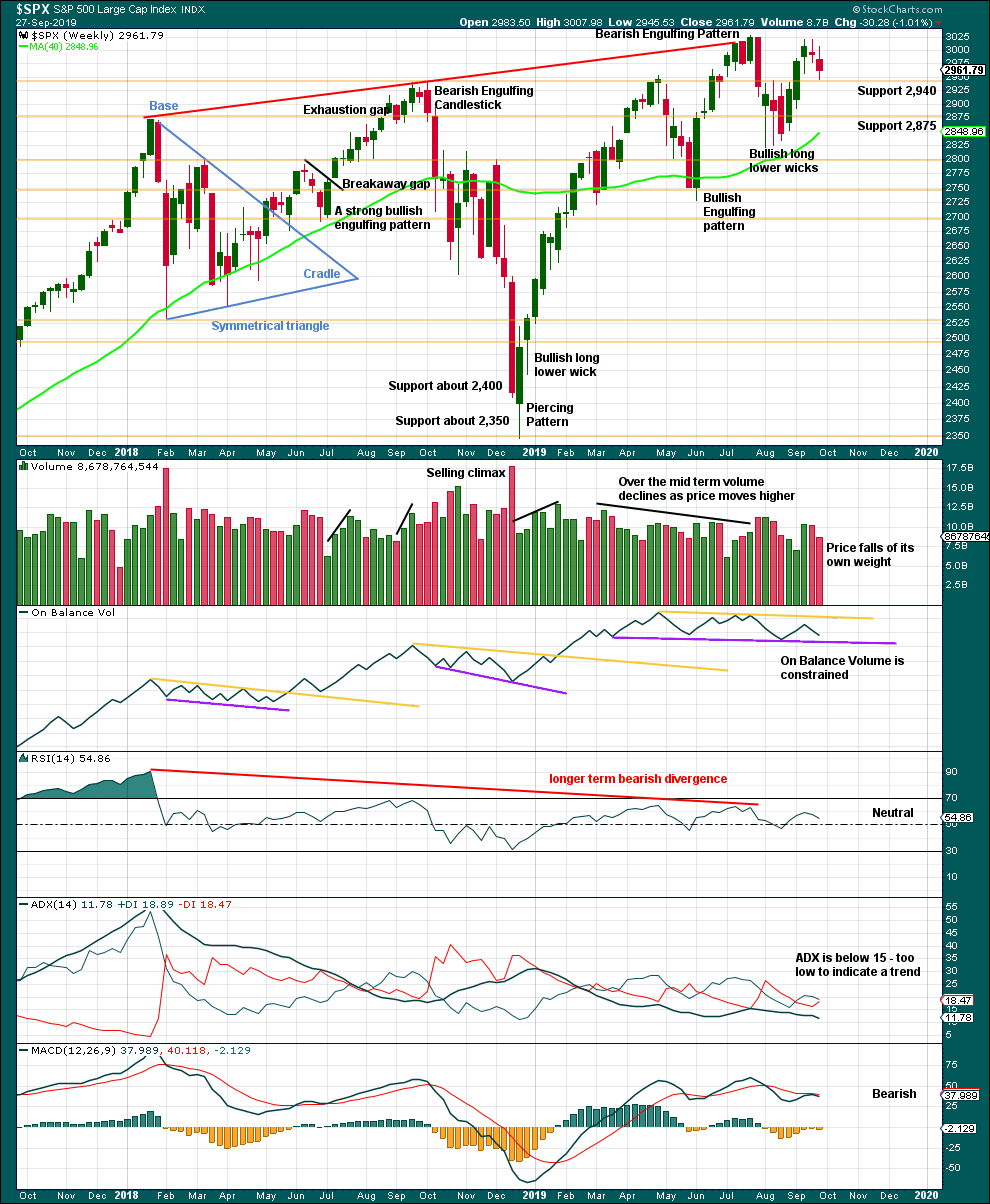
There is no bearish candlestick reversal pattern in the last three weekly candlesticks. A decline in volume last week with a small range real body is slightly bullish. This looks like a small pullback within an ongoing upwards trend.
DAILY CHART
Click chart to enlarge. Chart courtesy of StockCharts.com.
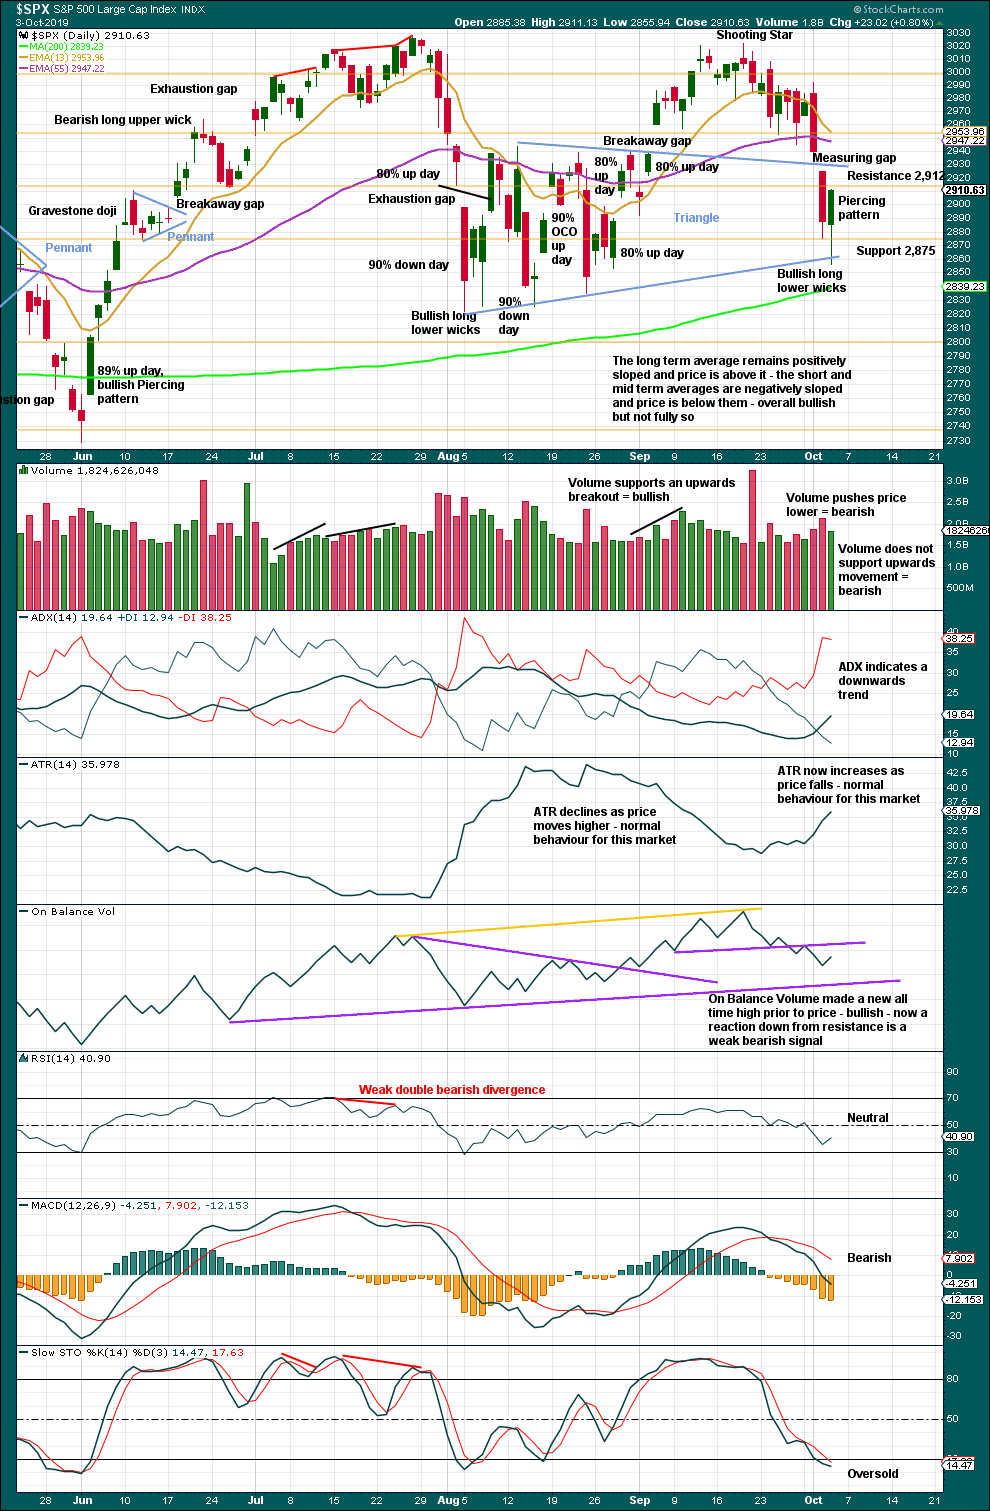
There is now a series of higher highs and higher lows since the 5th of August. Strength in 90% up days and back to back 80% up days off lows indicate the lows may still be sustainable.
At this stage, for the short term at least, there is a new downwards trend in place. Next support is about 2,800 if support here at 2,875 can be overcome.
For confidence that a low is in place any one of the following shall be looked for:
– A 90% up day.
– Two back to back 80% up days.
– A bullish candlestick reversal pattern with support from volume.
The piercing pattern today lacks support from volume. Today fell well short of an 80% up day. Upwards movement at the end of this session was not strong enough for confidence that a low is in place yet.
For the very short term, a close near the high for the session and a bullish long lower wick suggest a small counter trend bounce may continue tomorrow.
BREADTH – AD LINE
WEEKLY CHART
Click chart to enlarge. Chart courtesy of StockCharts.com. So that colour blind members are included, bearish signals
will be noted with blue and bullish signals with yellow.
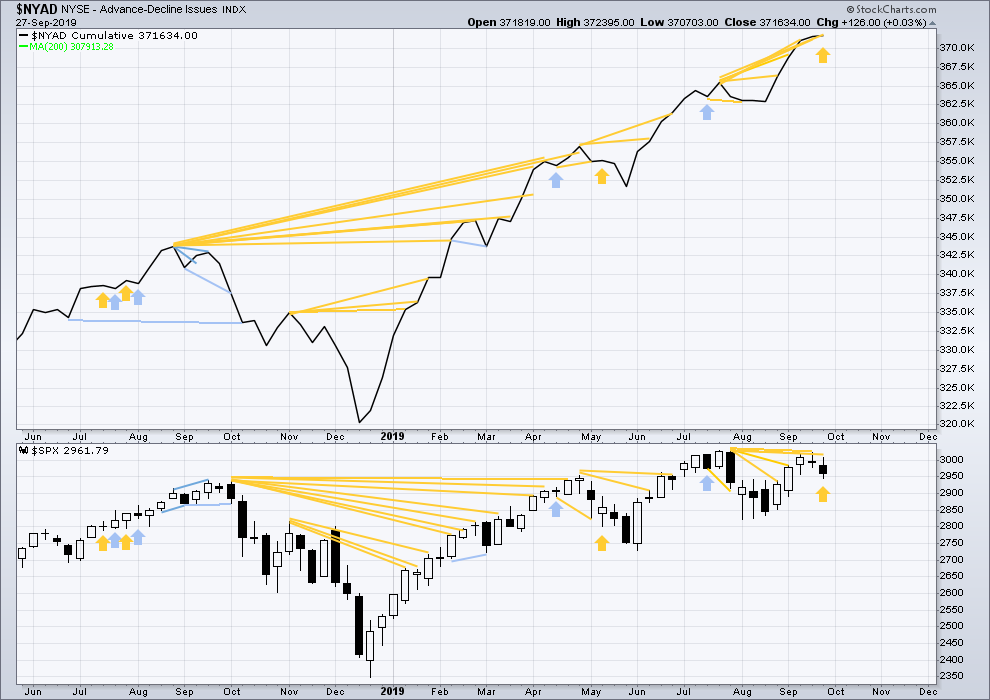
Bear markets from the Great Depression and onwards have been preceded by an average minimum of 4 months divergence between price and the AD line with only two exceptions in 1946 and 1976. With the AD line making new all time highs again this week, the end of this bull market and the start of a new bear market is very likely a minimum of 4 months away, which is end January 2020.
In all bear markets in the last 90 years there is some positive correlation (0.6022) between the length of bearish divergence and the depth of the following bear market. No to little divergence is correlated with more shallow bear markets. Longer divergence is correlated with deeper bear markets.
If a bear market does develop here, it comes after no bearish divergence. It would therefore more likely be shallow.
Last week price has moved lower, but the AD line has moved slightly higher to make a slight new all time high. This divergence is strongly bullish and supports the main Elliott wave count.
Small caps have made a new swing high above the prior high of the end of July, but mid and large caps have not yet done so. This upwards movement of the last four weeks appears to be led by small caps. Because small caps are usually the first to exhibit deterioration in the later stages of a bull market, some strength in small caps at this stage indicates a healthy bull market with further to run.
DAILY CHART
Click chart to enlarge. Chart courtesy of StockCharts.com. So that colour blind members are included, bearish signals
will be noted with blue and bullish signals with yellow.
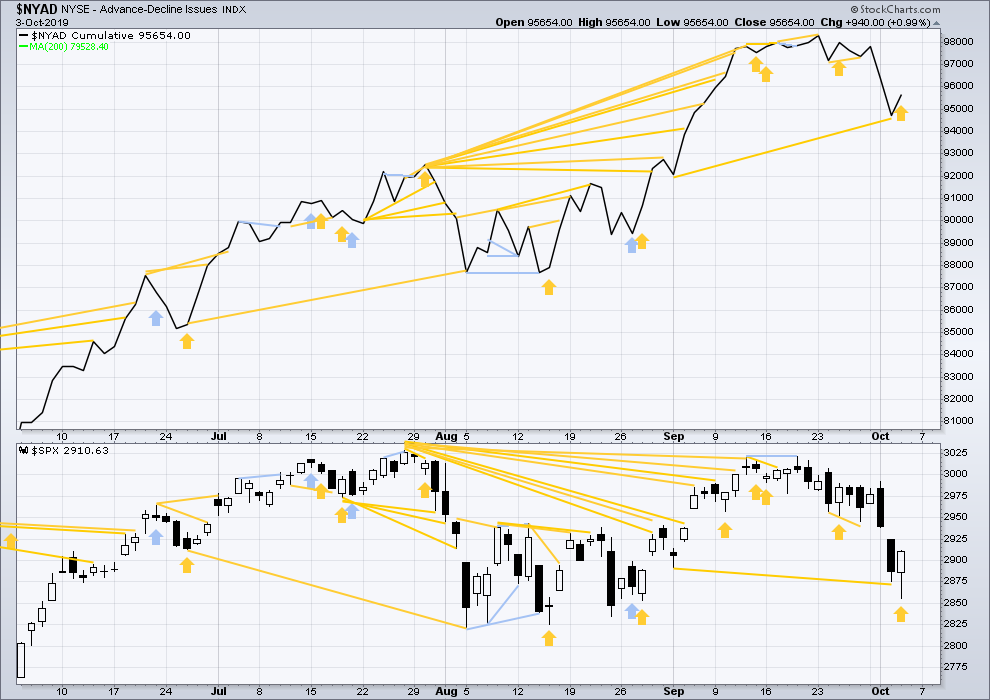
Breadth should be read as a leading indicator.
Today price moved lower with a lower low and a lower high, but the AD line has moved higher. This divergence is bullish and supports the view that a counter trend bounce may continue tomorrow.
VOLATILITY – INVERTED VIX CHART
WEEKLY CHART
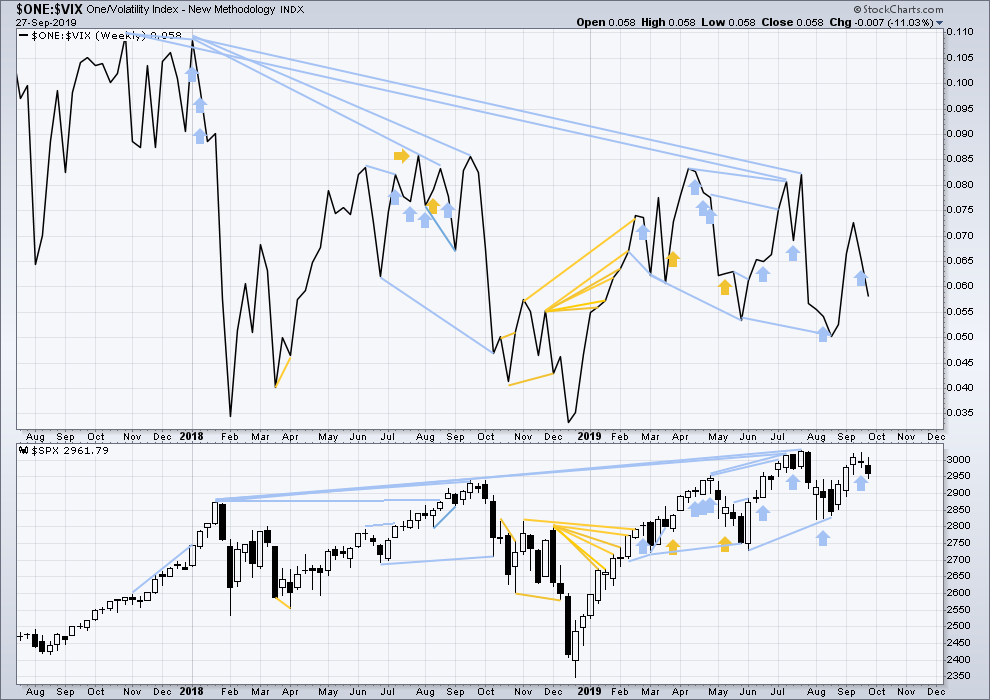
Click chart to enlarge. Chart courtesy of StockCharts.com. So that colour blind members are included, bearish signals
will be noted with blue and bullish signals with yellow.
The all time high for inverted VIX (which is the same as the low for VIX) was on 30th October 2017. There is now nearly one year and eleven months of bearish divergence between price and inverted VIX.
The rise in price is not coming with a normal corresponding decline in VIX; VIX remains elevated. This long-term divergence is bearish and may yet develop further as the bull market matures.
This divergence may be an early warning, a part of the process of a top developing that may take years. It may not be useful in timing a trend change.
Last week both price and inverted VIX moved lower. There is no new short-term divergence.
DAILY CHART
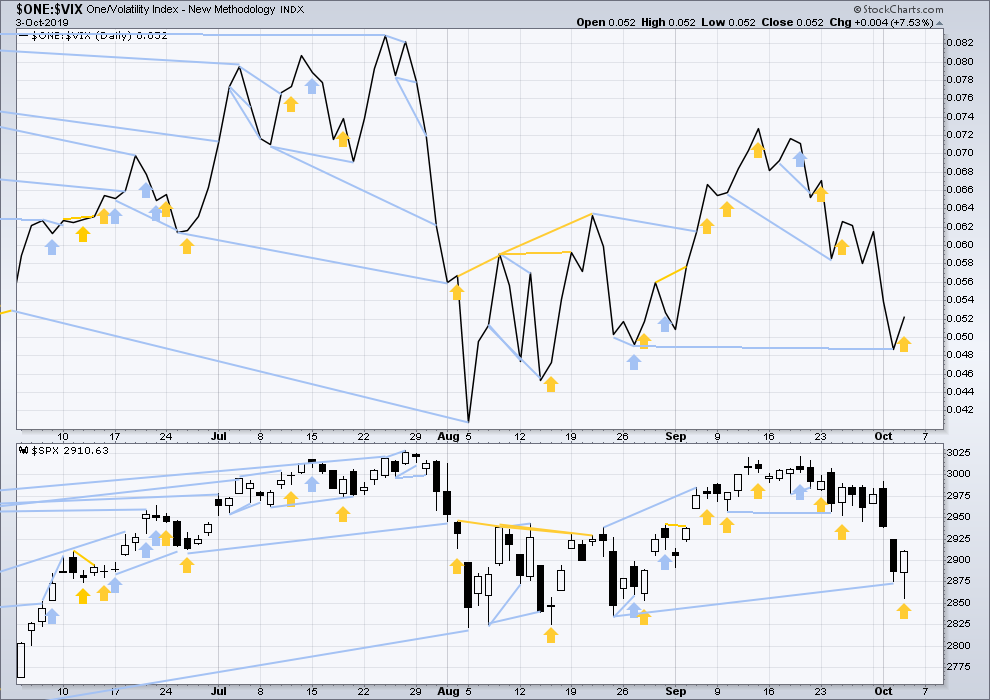
Click chart to enlarge. Chart courtesy of StockCharts.com. So that colour blind members are included, bearish signals
will be noted with blue and bullish signals with yellow.
Today price has moved lower with a lower low and a lower high, but inverted VIX has moved higher. This divergence is bullish and supports the view that a counter trend bounce may continue tomorrow.
DOW THEORY
Dow Theory confirmed a bear market in December 2018. This does not necessarily mean a bear market at Grand Super Cycle degree though; Dow Theory makes no comment on Elliott wave counts. On the 25th of August 2015 Dow Theory also confirmed a bear market. The Elliott wave count sees that as part of cycle wave II. After Dow Theory confirmation of a bear market in August 2015, price went on to make new all time highs and the bull market continued.
DJIA: 23,344.52 – a close on the 19th of December at 23,284.97 confirms a bear market.
DJT: 9,806.79 – price has closed below this point on the 13th of December.
S&P500: 2,532.69 – a close on the 19th of December at 2,506.96 provides support to a bear market conclusion.
Nasdaq: 6,630.67 – a close on the 19th of December at 6,618.86 provides support to a bear market conclusion.
With all the indices having moved higher following a Dow Theory bear market confirmation, Dow Theory would confirm a bull market if the following highs are made:
DJIA: 26,951.81 – a close above this point has been made on the 3rd of July 2019.
DJT: 11,623.58 – to date DJT has failed to confirm an ongoing bull market.
S&P500: 2,940.91 – a close above this point was made on the 29th of April 2019.
Nasdaq: 8,133.30 – a close above this point was made on the 26th of April 2019.
Published @ 08:49 p.m. EST.
—
Careful risk management protects your trading account(s).
Follow my two Golden Rules:
1. Always trade with stops.
2. Risk only 1-5% of equity on any one trade.
—
New updates to this analysis are in bold.

Looks like an a,b,c wave 2 up to me.
Possibly but I doubt it. On the intraday chart the slope and big momentum on the move up into the close looks like 3rd wave material-particularly on a 240 minute chart.
It could also be a nasty B wave!
Sometimes it’s hard to tell the difference… at least for me it is
🙂
Well, what a day and what a week. I exited my longs at the high of the day picking up a nice 1.4% additional account balance to already profitable positions. As Kevin might say, “Cha-ching”. I can’t wait to see the volume and other TA that Lara will have for us. The SPX move off the recent low of 2856 is just under 100 SPX points. That is a substantial move in less than 2 days. For now I will be sitting on hands until at least Monday! (ha-ha) At that point, I might just decide to open some new long positions.
With the alternate invalidated on the hourly chart at the end of this session, for it to remain valid in another form I have to move the degree of labelling within its minor 3 down one degree.
The alternate has a low probability. I shall publish the daily chart for now, but I am asking here for members to please let me know if you want me to publish an hourly chart for it. My own preference would be not to, as I think that gives it too much weight.
Is you own analysis bearish enough for you to want to follow that wave count next week?
Dear Lara,
I think it would make sense to publish a link to the bearish analyses that remain possible, but not necessarily to update these analyses.
I agree that the most probable path is up at this stage & the fears expressed on this forum (US-China talks for example) are to be taken as buy negative-sentiment indicators.
Okay, as no members have requested I provide an hourly chart for the bearish alternate I shall not do so.
It is my view that it would give it too much weight anyway, so….
2952.86 has been surpassed !!
Day’s Range 2,918.56 – 2,952.88
Closing price 2,951.69.
Since 2952.86 was exceeded, is the trend up to 3120?
I think on balance of probability, yes.
Also, this weekly candlestick has a very long lower wick. It looks VERY bullish.
The strength, or lack of it, will be important in todays upwards movement.
But at this point the weekly candlestick is going to have a very long lower wick, that’s very bullish.
Apart from the last high failing by a small margin to make a new all time high, there is still a series of higher highs and higher lows off the December 2018 low. All my wave counts still expect that low to remain intact for at least another year or so.
Main hourly chart updated:
Alternate hourly chart updated:
Minor 4 is now outside the Elliott channel. Fourth waves aren’t always contained within those channels though, so that doesn’t mean this count should be discarded. This count remains valid.
Tom McClellan article on this decline:
https://www.mcoscillator.com/learning_center/weekly_chart/aaii_survey_shows_sentiment_washout/
Thanks Melanie for the link.
That’s some nice solid technical analysis, I like it.
Well it started to look like a wave 3, if it closes at highs and above 40, it would just show as a wick below 40 on the weeklies
yeah that kinda weekly candle has an excellent track record for more upside
Also check out July 2016 DJT death cross… did not hold….
and from a macro prospective, still no place better to park cash than in equities, for now…. just thinking out loud
Look at the week of 8/5 as a counterexample. Just the start of the very wide-ranging movement for a month.
Best to consider personal motivations around this entire trade war, and whether said motivations have achieved desired goals, in my view. “saving interest cost money” and “no” are my current view of that. ’nuff said.
It will be very difficult to count the rally from yesterday’s low as a correction. It looks impulsive, with this morning’s gap up being the middle of a wave 3.
There is no way to put a 90 points impulsive up trend at this juncture if this was a bear count, so the bull count is the most likely.
I don’t think the market is really focused on this round of negotiation with China, so I don’t see head winds in the short term. Hope for a mild correction next week, and go long – or longer…
and now free trades, and 0.85 for options…… interesting timing
Here is a chart to ponder. We may have a head & shoulders top to start a much larger downwards move. With a break of the neckline and a return from below, the next leg down would begin early next week if not today since we are already essentially at the underside of the neckline. Caution is warranted imo.
Here are a couple of bearish signs at the moment. Dow Jones Transports very close to 50 DMA going under 200 DMA (death cross), it might cross after today’s close.
And IWM is also close, it will likely cross in the next day or two if it doesn’t have a face ripping rally upwards. I look at those 2 as “leading indicators”.
Seems to me everything is dependent on the US-China trade talks late next week. If history is any guide, those will “fail”, and the market will tank. But perhaps (???) both sides are ready to agree? I have severe doubts for many reasons.
Yes, the death cross. I made a mistake of not paying attention to that back in November 2018. Verne warned me and I should have heeded it at that point. Hopefully never again. I will be out of all long positions by the close.
Perhaps the market is telling us (or going to tell us shortly), the trade talks will continue to stall and fail for some time to come. There will be no agreement before the next presidential election in Nov 2020. It makes sense, since if you were the Chinese and did not know who was going to be the President of the US just a year from now, would hold out till then? I would. The Chinese have full and complete control of their country with exception to Hong Kong. They don’t care if the people are hurt as long as the rulers have their lifestyle maintained. The Chinese are also in this for the long haul, 50-100 years, not relentlessly focusing on the next year.
So I agree Kevin, we could tank very soon. All that being said, I’m just a guy living out in the middle of Nowhere Land as I approach my ‘Golden’ years. What do I know? Take my opinion for what it cost?
Note: Should the SPX break above 2952, we have many more riddles to try and solve.
SPX now at the top of that massive August range. And in the “volume valley”. This is not a stable location for price. Up and away, or back down. I think back down has to be the dominant thesis.
This is the volume profile from SPY daily going back a year. SPX has to “cross a chasm” to get back to 3000. The point of control is 2880; that’s the “most likely” level price will keep returning to. The next one down is about 2800.
The neckline has to be drawn from the troughs between the shoulders and head though, so it wouldn’t be horizontal, it would have a downwards slope
Short the RUT here…Nov higher delta puts…fall baby fall….
hmmmm, I am buying the dips until proven wrong
Awesome, takes many views to make a market! I am out of that intraday short of course. Now I’ve put on a ‘fly in RUT for Oct 18, broken wing call butterfly, 1455/1475/1500. If RUT tanks completely my return is $0. If RUT closes at 1473 I make $5200. If RUT closes above 1502 and I hold to expiry (I wouldn’t) I lose $1500. I don’t see a whole lot of upside in this market at this point, so I like the trade. And of course if RUT moves firmly up I’m taking long positions that will cover the loss here. So I like it. G’luck with the longs!
both the RUT and SPX are giving that look that Verne talks about I think….. cobra coil or something
I’m just workin’ RUT intraday here, short, long, etc.. I don’t think it’s really going anywhere except up and down, honestly. Though the hourly is bullish re: the bottom structure and break upward.
I never understood that? is it coiling for upward, down movement?
If you could put up an example chart I’d appreciate it…
I know it used to work very well for Verne
US Jobs Report was just slightly below expectations. The US equity markets continue their upwards movement toward the gap above. I suspect SPX will move into the gap today and fail to close. Next week we will see the continuation of the strong move downwards. As of the close today, I will be out of all long positions and sitting on hands. I will be looking to go short SPX sometime next week.
Have a great weekend everyone.
Hi Rod 🙂
how’s your shoulder rehab coming along?
Thanks for asking ari. My range of motion on this second shoulder is vastly improved over where I was at this time after the first surgery. I am quite pleased. I started physical therapy early last week and it it progressing well. I suspect after the New Year I will be doing very well. But that road to full recovery takes a lot of perseverance, work and willingness to endure some pain. Thanks again for asking. Have a great day.
That’s great to hear Rodney!
With both shoulders now fixed, you’re the Bionic Man here
They really wanted that gap filled. Perhaps a sign we won’t be back up here for some time.
Hi Lara,
In the Alternate count Minor 5 seems as though it will be very long compared to Minor 3.
Perhaps we have just seen the end of Minute 1 of Minor 3, rather than the end of Minor 3?
I was thinking the same. Its probably the very beginnings of a selloff… if its a selloff that is…
That’s possible, yes, but this move up now just looks too big to be a lower degree second wave. It just doesn’t have the right look.
But with that count invalidated at the end of todays session I will have to try that idea for it to remain as an alternate. Move the degree of minor 3 down one.
But I don’t think I shall publish an hourly chart for it due to low probability. Unless members here want to use that chart because their own analysis is fairly bearish.
So please members, let me know here in the next couple of hours or so if you want an adjusted hourly chart for the alternate in end of week analysis.
#Uno! Is everyone asleep?