Price remains constrained within a small zone of support and resistance. The three Elliott wave counts remain the same.
Summary: Conditions are still suggesting a sustainable low may be in place. The next target is 3,120.
A new low below 2,822.12 would indicate a continuing deeper pullback as fairly likely. The first target would then be at 2,663.
The biggest picture, Grand Super Cycle analysis, is here.
Monthly charts were last published here, with video here. There are two further alternate monthly charts here, with video here.
ELLIOTT WAVE COUNTS
The two weekly Elliott wave counts below will be labelled First and Second. They may be about of even probability. When the fifth wave currently unfolding on weekly charts may be complete, then these two wave counts will diverge on the severity of the expected following bear market. To see an illustration of this future divergence monthly charts should be viewed.
FIRST WAVE COUNT
WEEKLY CHART
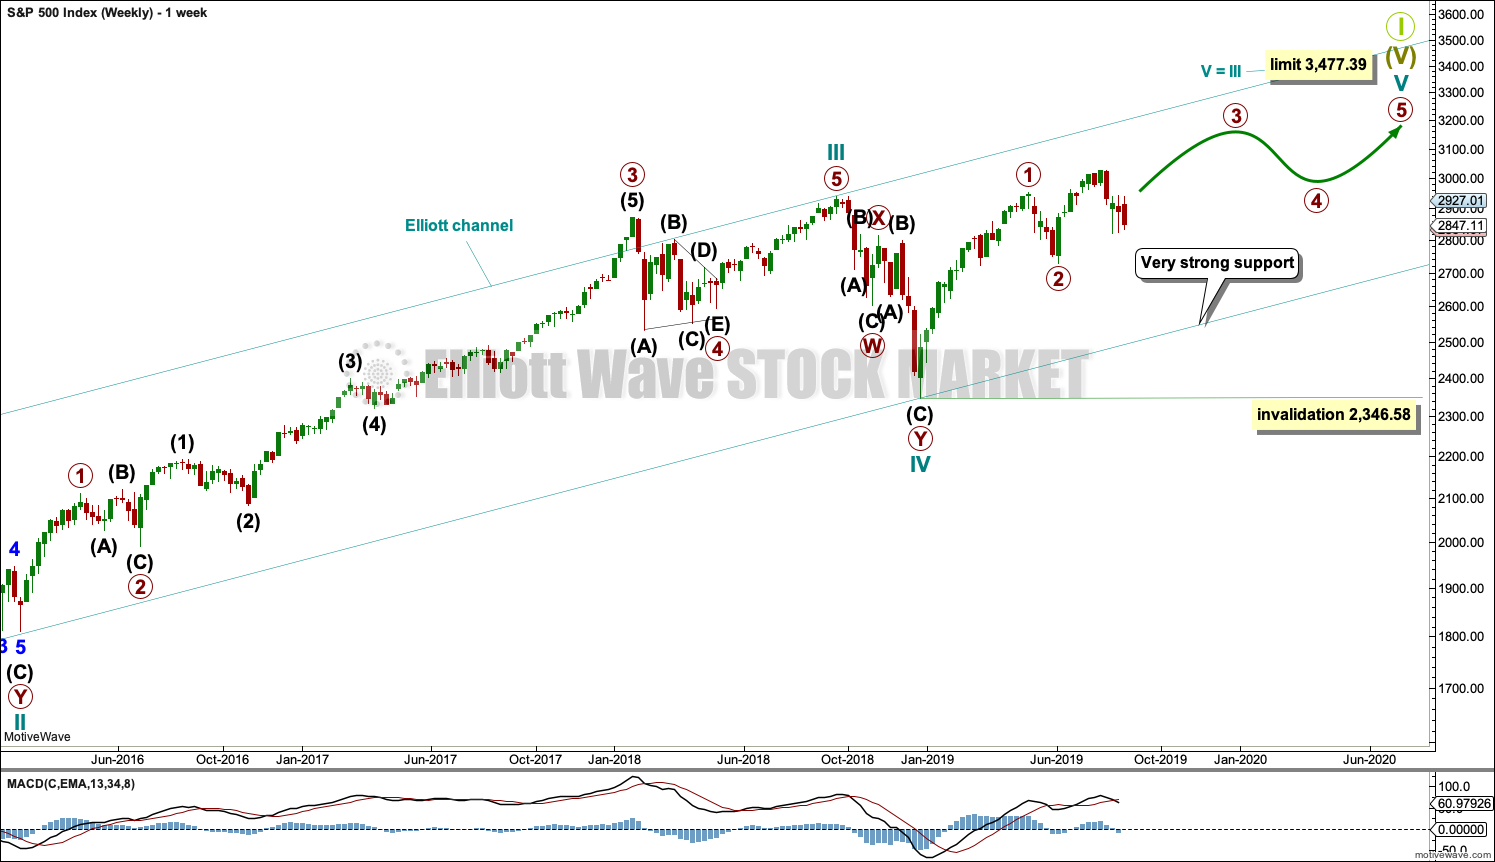
The basic Elliott wave structure consists of a five wave structure up followed by a three wave structure down (for a bull market). This wave count sees the bull market beginning in March 2009 as an incomplete five wave impulse and now within the last fifth wave, which is labelled cycle wave V. This impulse is best viewed on monthly charts. The weekly chart focusses on the end of it.
Elliott wave is fractal. This fifth wave labelled cycle wave V may end a larger fifth wave labelled Super Cycle wave (V), which may end a larger first wave labelled Grand Super Cycle wave I.
The teal Elliott channel is drawn using Elliott’s first technique about the impulse of Super Cycle wave (V). Draw the first trend line from the end of cycle wave I (off to the left of the chart, the weekly candlestick beginning 30th November 2014) to the end of cycle wave III, then place a parallel copy on the end of cycle wave II. This channel perfectly shows where cycle wave IV ended at support. The strongest portion of cycle wave III, the end of primary wave 3, overshoots the upper edge of the channel. This is a typical look for a third wave and suggests the channel is drawn correctly and the way the impulse is counted is correct.
Within Super Cycle wave (V), cycle wave III is shorter than cycle wave I. A core Elliott wave rule states that a third wave may never be the shortest. For this rule to be met in this instance, cycle wave V may not be longer in length than cycle wave III. This limit is at 3,477.39.
Cycle wave V may subdivide either as an impulse or an ending diagonal. Impulses are much more common. This main wave count expects that cycle wave V may be unfolding as an impulse.
The daily charts below will now focus on all of cycle wave V.
In historic analysis, two further monthly charts have been published that do not have a limit to upwards movement and are more bullish than this wave count. Members are encouraged to consider those possibilities (links below summary) alongside the wave counts presented on a daily and weekly basis.
MAIN DAILY CHART
There is enough support from classic technical analysis to consider this the main wave count.
Cycle wave V is seen as an impulse for this wave count.
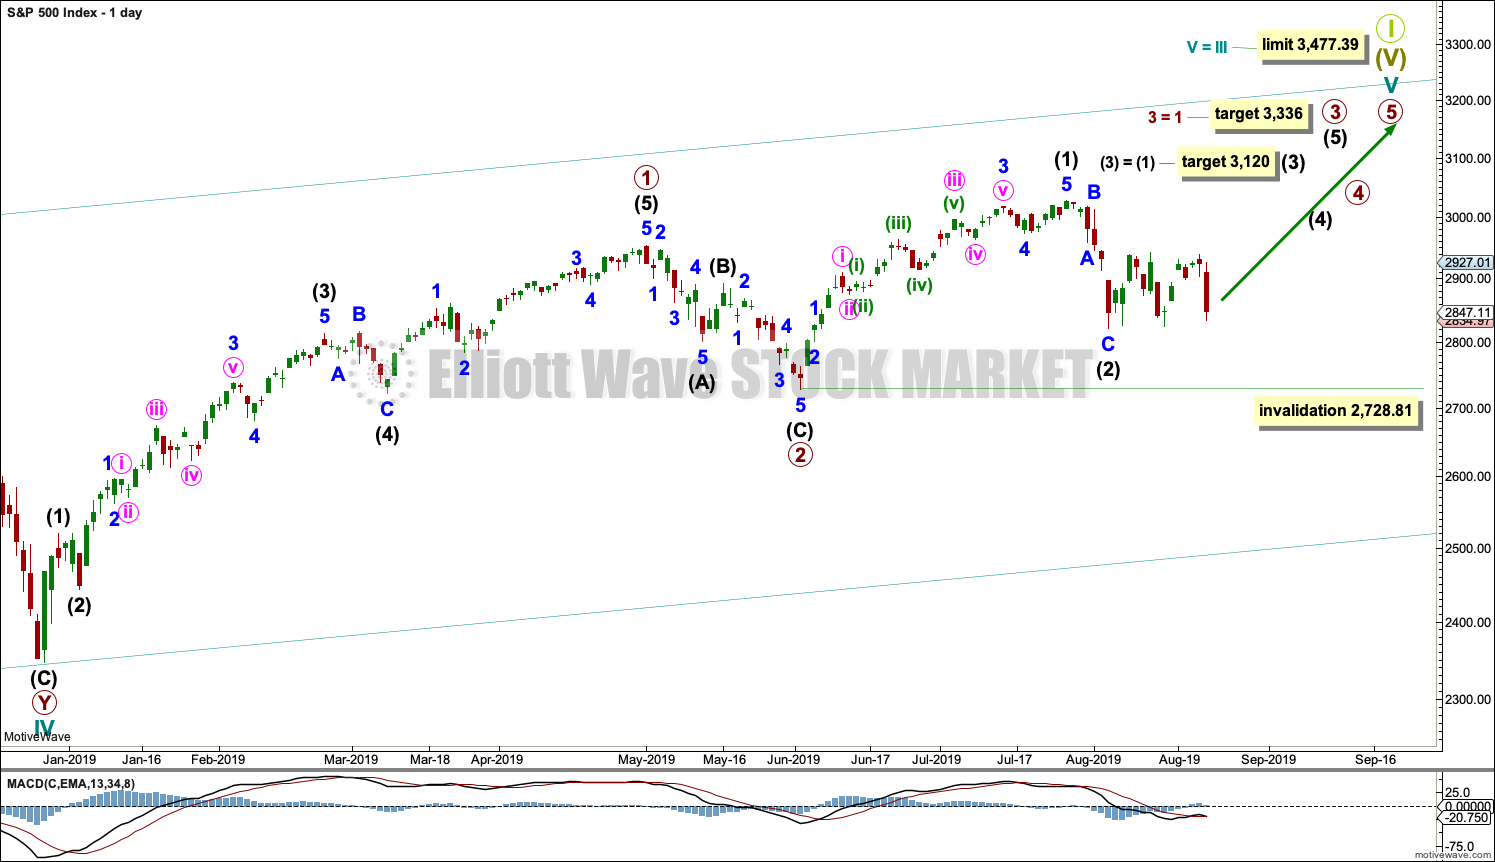
Within cycle wave V, primary waves 1 and 2 may be complete. Primary wave 3 may have begun.
Primary wave 3 may only subdivide as an impulse. Within primary wave 3, intermediate waves (1) and (2) may be complete.
It is also possible that intermediate wave (2) may be incomplete and sideways movement of the last 14 sessions may be minor wave B within a zigzag for intermediate wave (2). If intermediate wave (2) continues lower, then it may not move beyond the start of intermediate wave (1) below 2,728.81.
Intermediate wave (3) may have begun. Intermediate wave (3) may only subdivide as an impulse.
The adjusted base channel is now removed as it was not showing where price was finding support. The invalidation point remains the same.
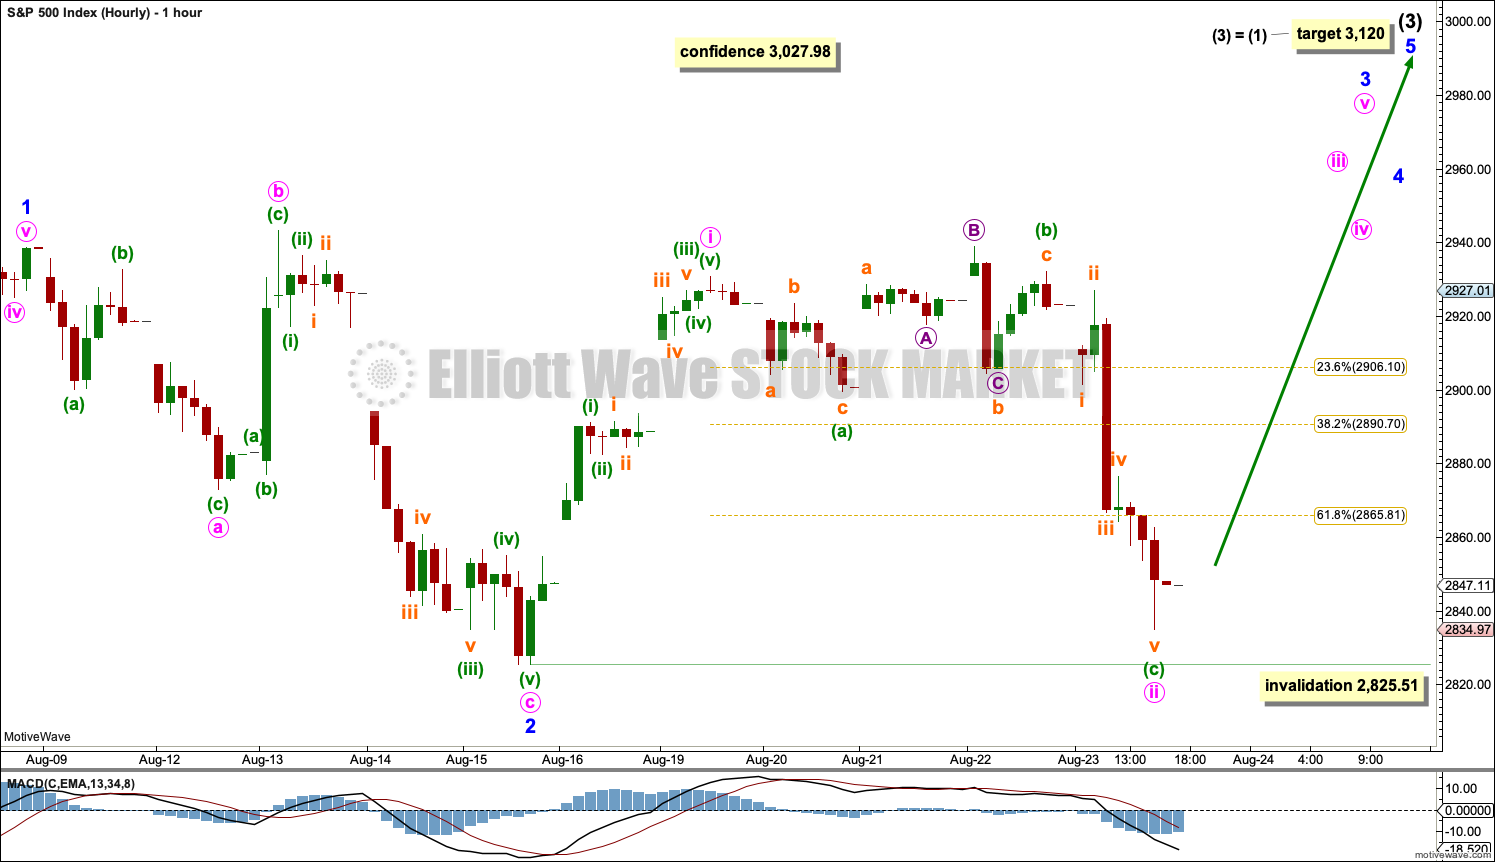
MAIN HOURLY CHART
Intermediate wave (3) may only subdivide as a five wave impulse. Within intermediate wave (3), minor waves 1 and 2 may now be complete. Minor wave 3 may only subdivide as a five wave impulse. Within minor wave 3, minute wave ii may not move beyond the start of minute wave i below 2,825.51.
Minute wave iii must move beyond the end of minute wave i. Minute wave iii must move far enough above the end of minute wave i to allow room for minute wave iv to unfold and remain above first wave price territory.
The next wave up for this wave count may then exhibit an increase in momentum as a third wave at three degrees unfolds.
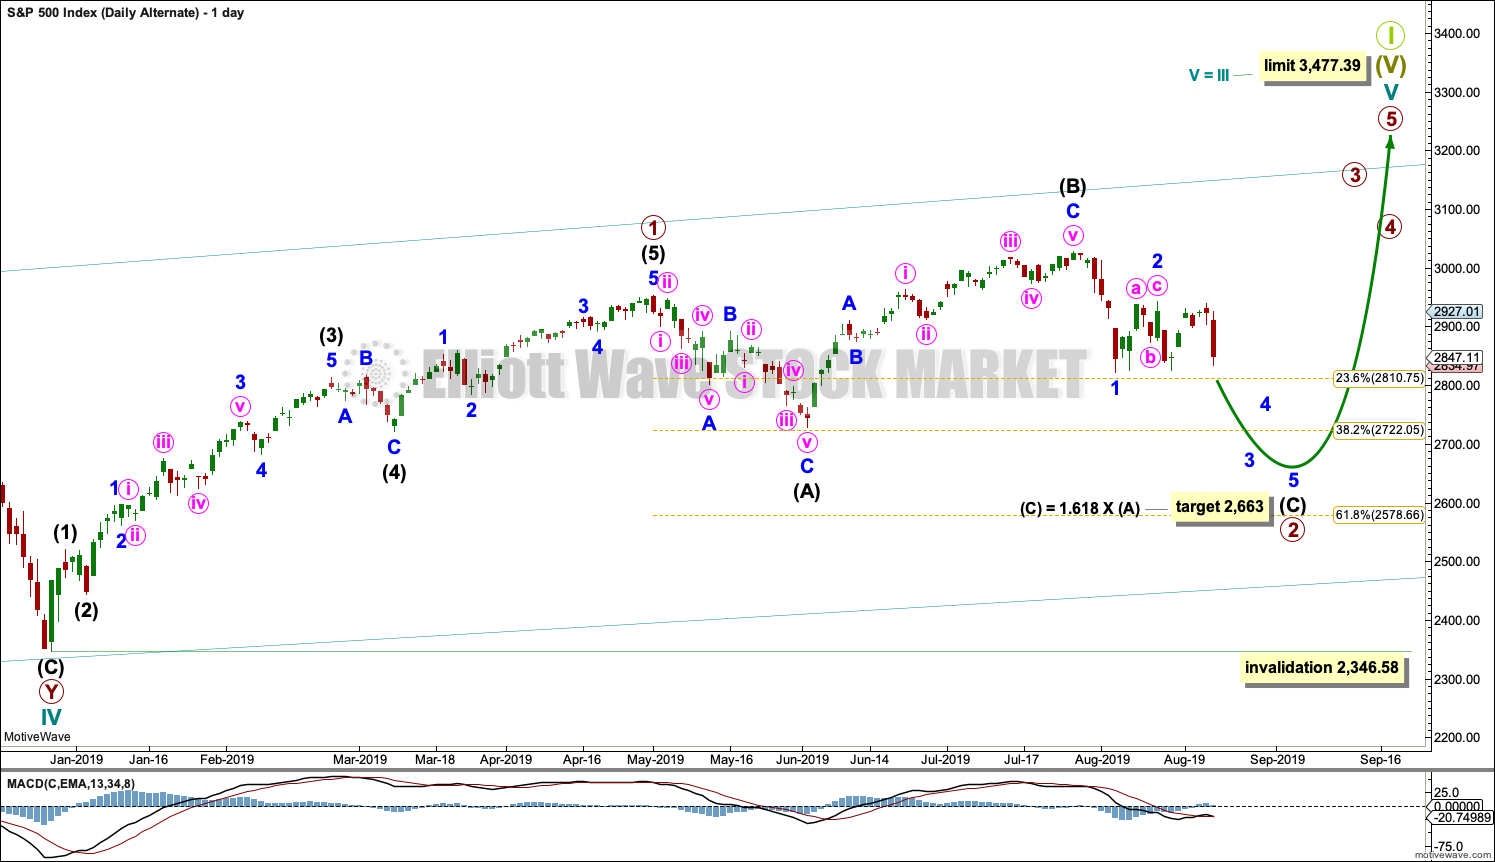
ALTERNATE DAILY CHART
This first alternate wave count considers the possibility that cycle wave V may be unfolding as an impulse.
Cycle wave V must subdivide as a five wave motive structure. Within that five wave structure, primary wave 1 only may be complete.
Primary wave 2 may be unfolding as an expanded flat correction. These are reasonably common Elliott wave corrective structures. Flat corrections subdivide 3-3-5. Expanded flats have B waves which are 1.05 or more the length of their A waves. In this example for primary wave 2, intermediate wave (B) is a 1.33 length of intermediate wave (A). The target for intermediate wave (C) expects it to exhibit the most common Fibonacci Ratio to intermediate wave (A) within an expanded flat.
If price reaches the target at 2,663 and keeps falling, then the next target would be the 0.618 Fibonacci Ratio of primary wave 1 at 2,578.66.
Primary wave 2 may not move beyond the start of primary wave 1 below 2,346.58.
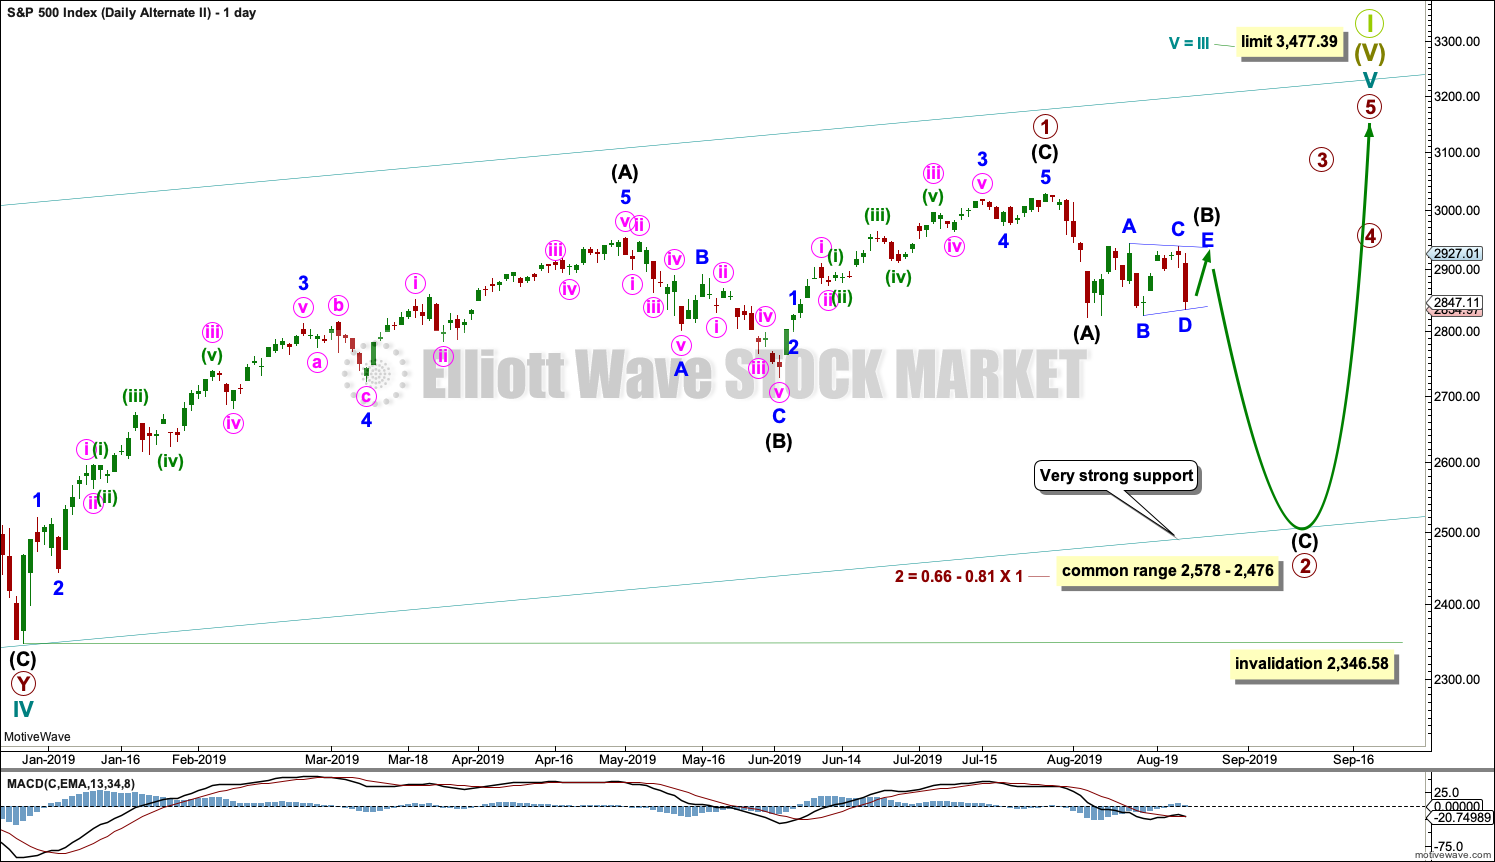
SECOND ALTERNATE DAILY CHART
This second alternate daily chart considers the other structural possibility for cycle wave V, that of an ending diagonal.
All sub-waves within an ending diagonal must subdivide as zigzags. Primary wave 1 may have been complete as a zigzag at the last all time high on the 26th of July.
Primary wave 2 may be continuing lower as a zigzag. Within the zigzag, intermediate wave (B) may be completing as a sideways triangle.
Within diagonals, sub-waves 2 and 4 are normally very deep, ending within a range of 0.66 to 0.81 the prior wave. This range for primary wave 2 is from 2,578 to 2,476. Primary wave 2 may possibly come as low as the lower edge of the teal channel, which is copied over from the weekly chart.
Primary wave 2 may not move beyond the start of primary wave 1 below 2,346.58.
SECOND WAVE COUNT
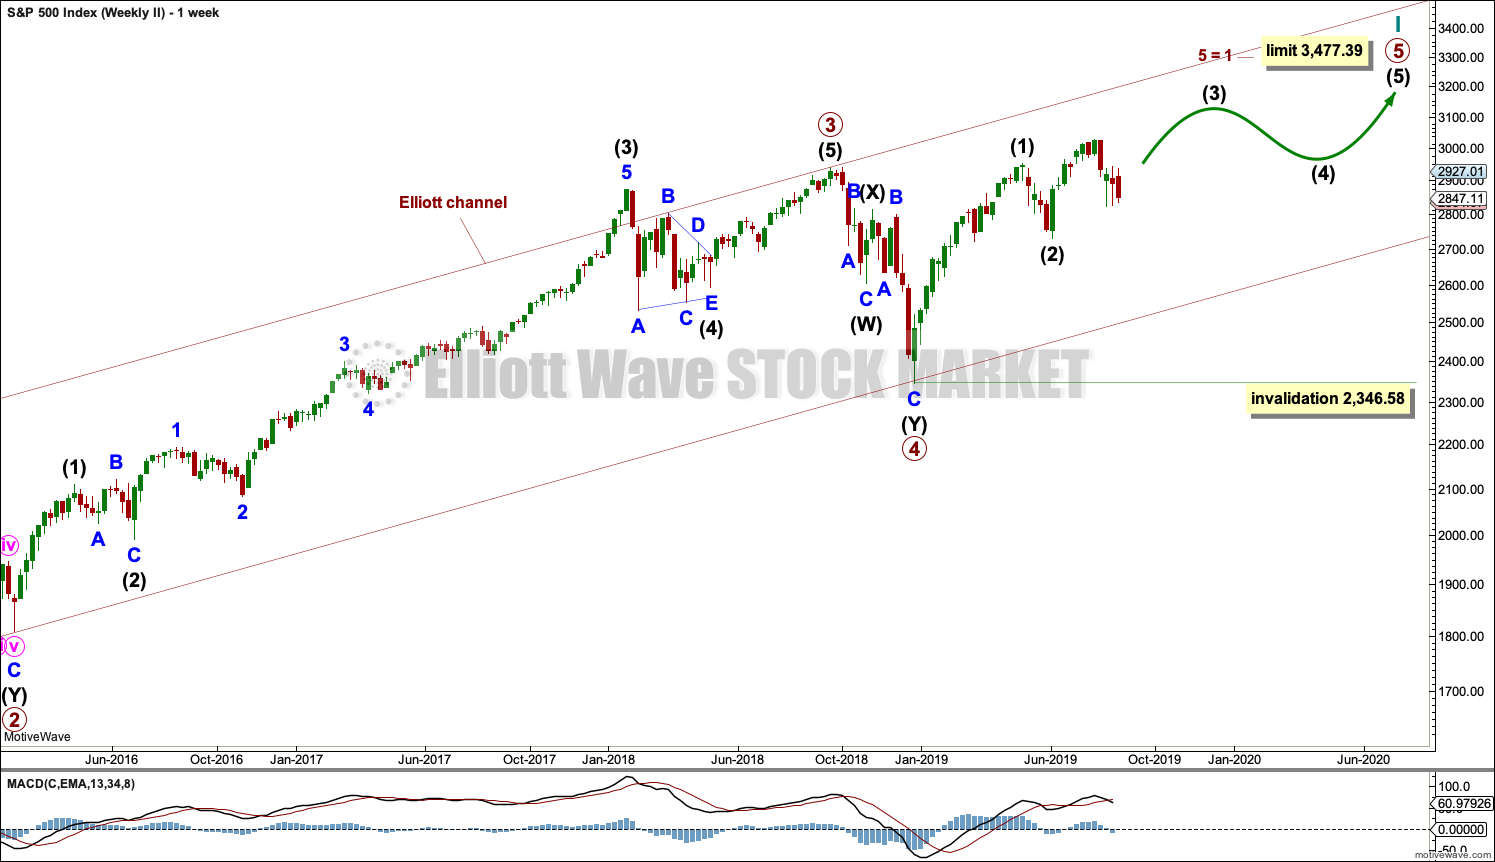
WEEKLY CHART
This weekly chart is almost identical to the first weekly chart, with the sole exception being the degree of labelling.
This weekly chart moves the degree of labelling for the impulse beginning in March 2009 all down one degree. This difference is best viewed on monthly charts.
The impulse is still viewed as nearing an end; a fifth wave is still seen as needing to complete higher. This wave count labels it primary wave 5.
TECHNICAL ANALYSIS
WEEKLY CHART
Click chart to enlarge. Chart courtesy of StockCharts.com.
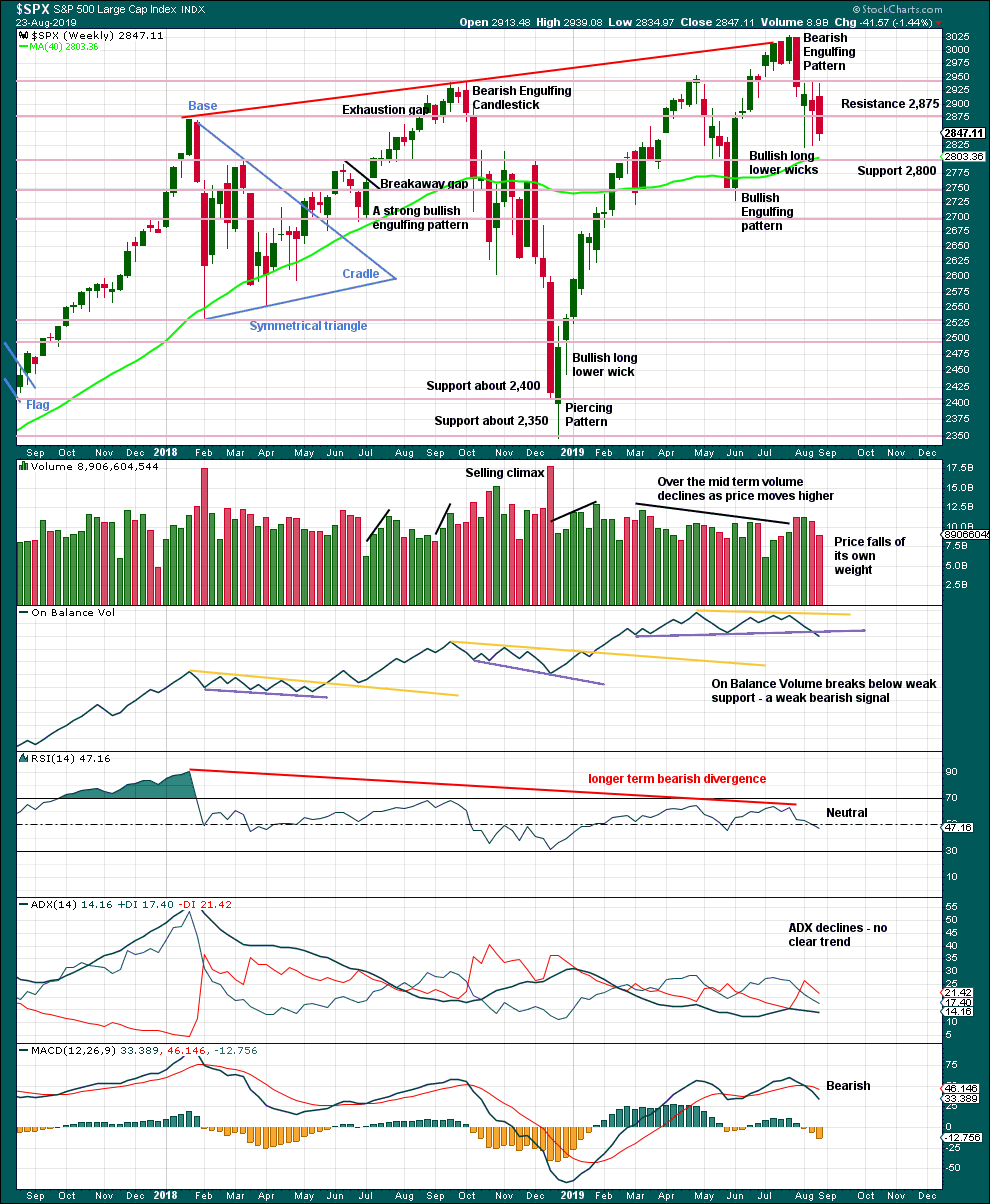
Currently, price is range bound with resistance about 2,945 and support about 2,920.
The larger trend is up from the low in December 2018, with a series of higher highs and higher lows. This upwards trend should be assumed to remain while the last swing low at 2,728.81 remains intact.
The signal from On Balance Volume favours the alternate daily Elliott wave counts.
DAILY CHART
Click chart to enlarge. Chart courtesy of StockCharts.com.
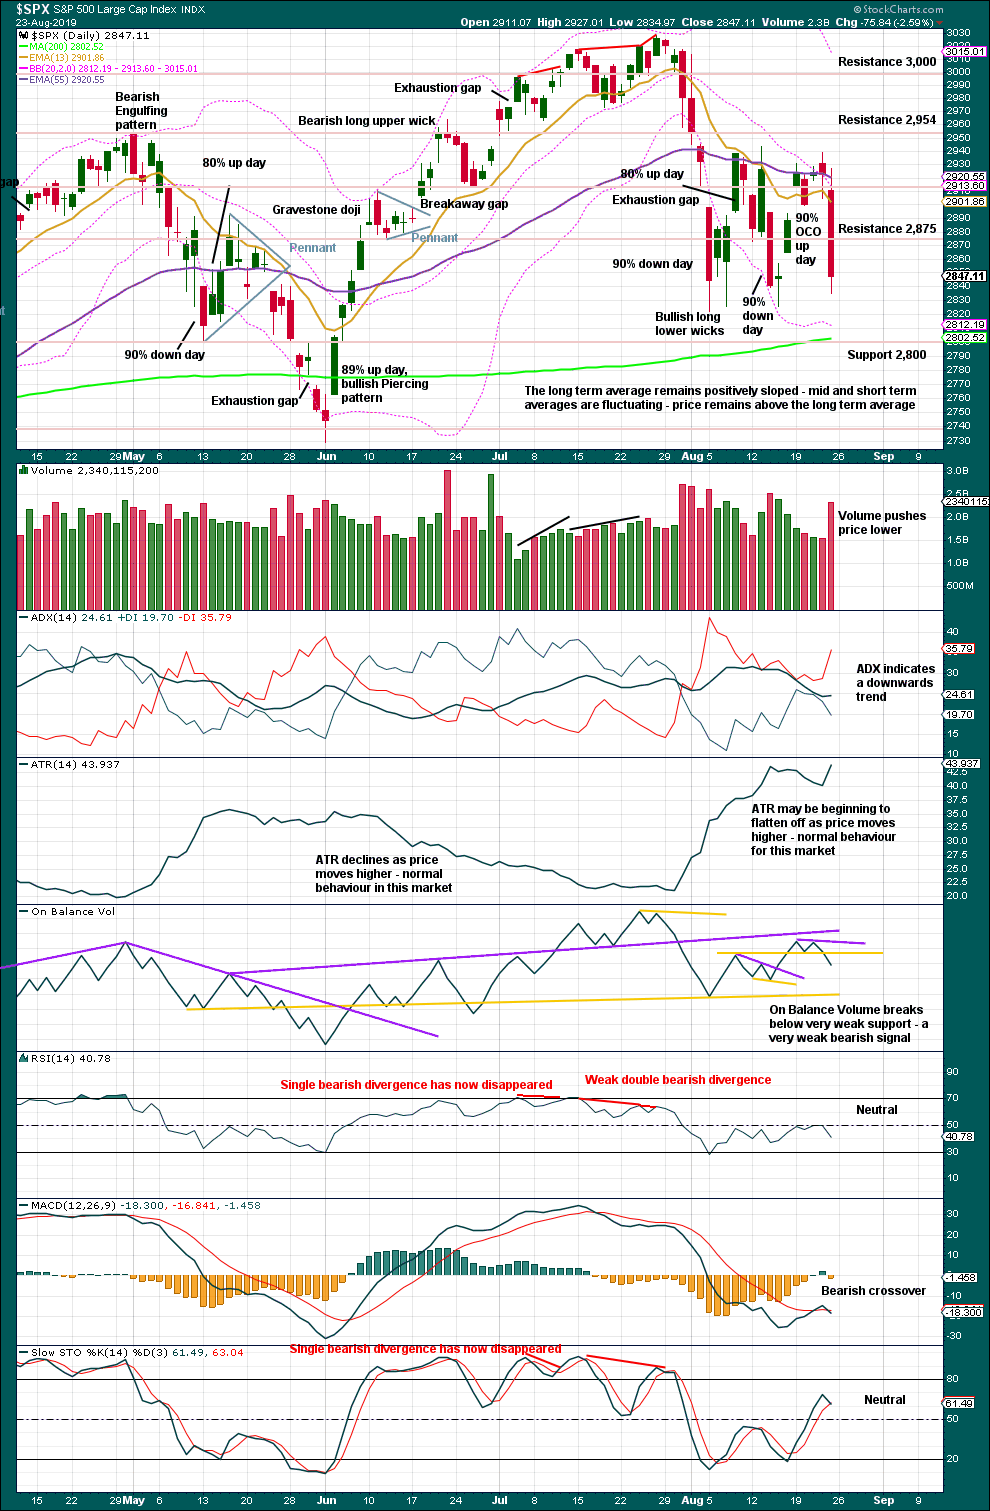
The last low of the 15th of August was preceded immediately by a 90% downward day and followed immediately by a 90% OCO (Operating Companies Only) up day. This is a pattern commonly found at major lows, and it indicates a 180 degree shift in sentiment from bearish to bullish. This favours the main Elliott wave count.
BREADTH – AD LINE
WEEKLY CHART
Click chart to enlarge. Chart courtesy of StockCharts.com. So that colour blind members are included, bearish signals
will be noted with blue and bullish signals with yellow.
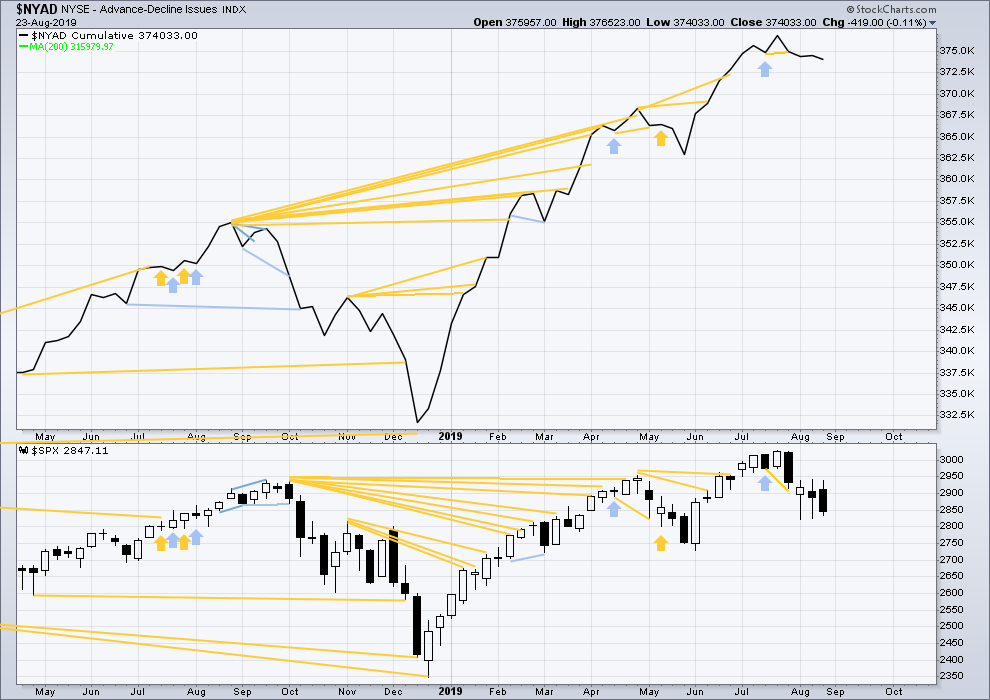
Bear markets from the Great Depression and onwards have been preceded by an average minimum of 4 months divergence between price and the AD line with only two exceptions in 1946 and 1976. With the AD line making new all time highs again recently, the end of this bull market and the start of a new bear market is very likely a minimum of 4 months away, which is mid November 2019.
In all bear markets in the last 90 years there is some positive correlation (0.6022) between the length of bearish divergence and the depth of the following bear market. No to little divergence is correlated with more shallow bear markets. Longer divergence is correlated with deeper bear markets.
If a bear market does develop here, it comes after no bearish divergence. It would therefore more likely be shallow.
This week price moved sideways with a red candlestick and the balance of volume downwards. The AD line has slightly declined. There is no new short-term divergence.
DAILY CHART
Click chart to enlarge. Chart courtesy of StockCharts.com. So that colour blind members are included, bearish signals
will be noted with blue and bullish signals with yellow.
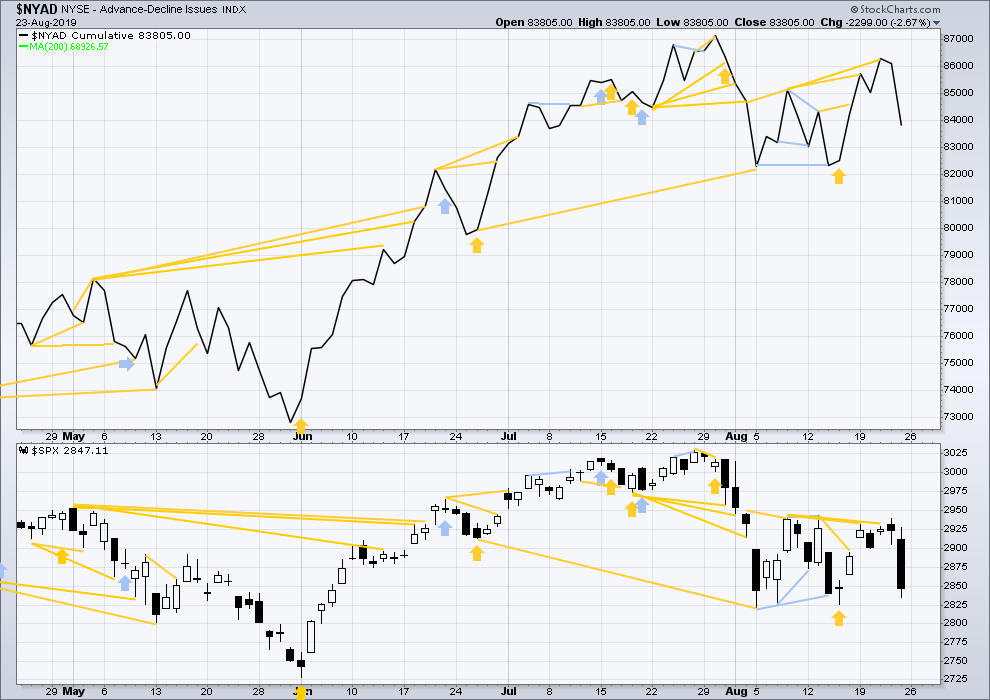
Breadth should be read as a leading indicator.
The AD line has made another new high above the prior high of the 13th of August, but price has not. This divergence is bullish and still supports the main Elliott wave count.
Today both price and the AD line have moved lower but neither have made new short-term swing lows below the prior low of the 15th of August. There is no new short-term divergence.
VOLATILITY – INVERTED VIX CHART
WEEKLY CHART
Click chart to enlarge. Chart courtesy of StockCharts.com. So that colour blind members are included, bearish signals
will be noted with blue and bullish signals with yellow.
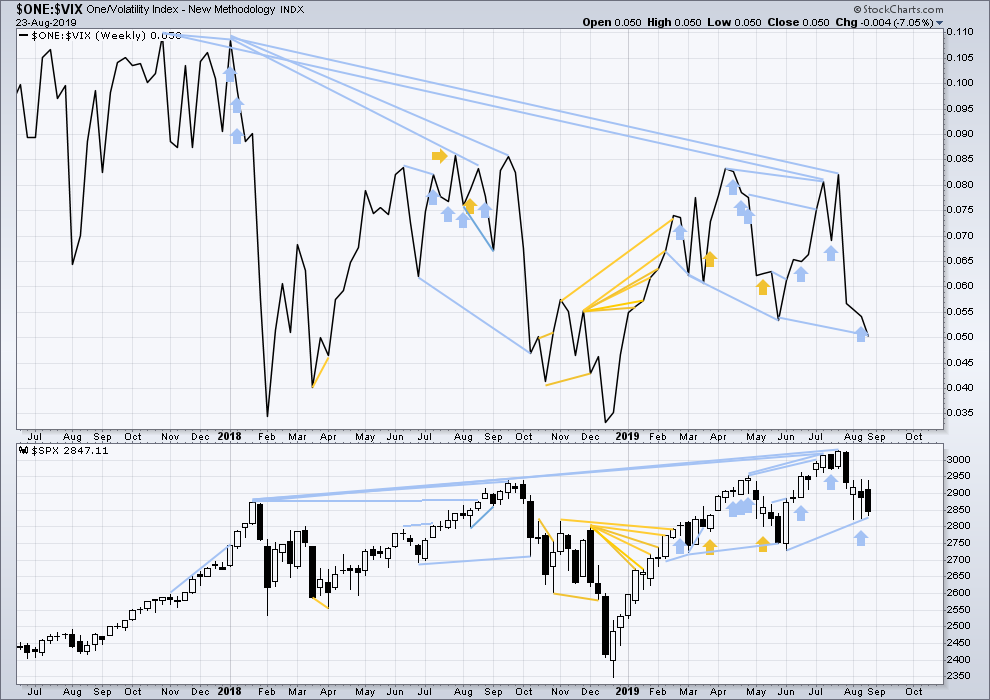
The all time high for inverted VIX (which is the same as the low for VIX) was on 30th October 2017. There is now nearly one year and nine months of bearish divergence between price and inverted VIX.
The rise in price is not coming with a normal corresponding decline in VIX; VIX remains elevated. This long-term divergence is bearish and may yet develop further as the bull market matures.
This divergence may be an early warning, a part of the process of a top developing that may take years. It may not be useful in timing a trend change.
This week price moved lower within the week. Inverted VIX has made a new swing low below the prior low of the week of the 28th of May, but price has not. This divergence is bearish and supports the alternate Elliott wave counts; but because it is not confirmed by the AD line, it is given little weight in this analysis. Note that this happened recently with prior divergence between swing lows, which was shortly after followed by upwards movement to the last all time high.
DAILY CHART
Click chart to enlarge. Chart courtesy of StockCharts.com. So that colour blind members are included, bearish signals
will be noted with blue and bullish signals with yellow.
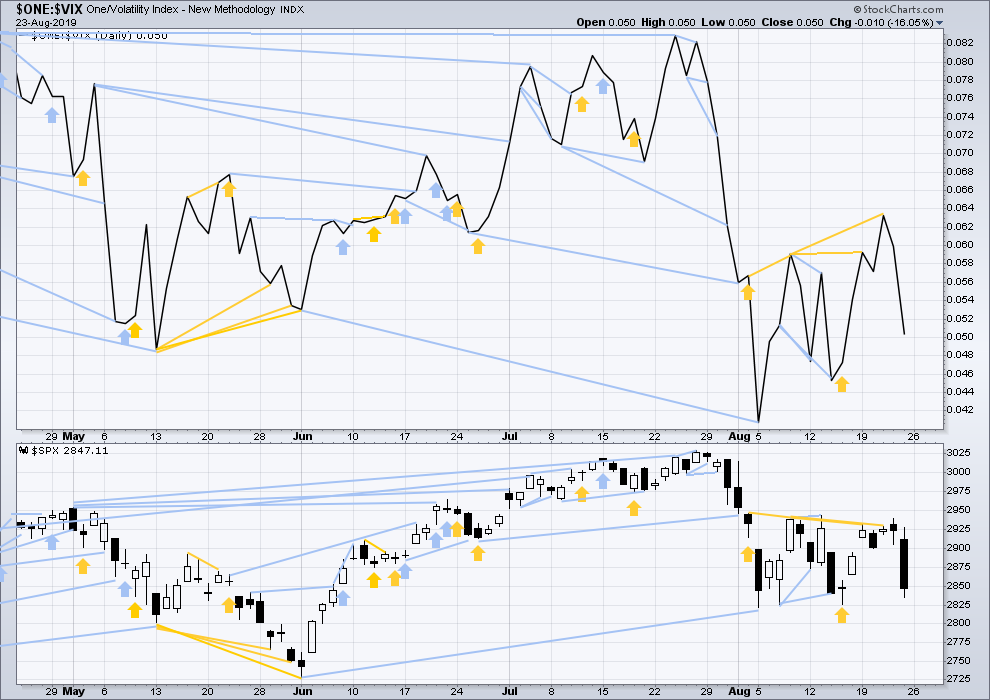
Inverted VIX made a new high above the prior high of the 13th of August, but price has not. This divergence is still bullish and confirms the bullish signal from the AD line. This supports the main Elliott wave count.
For Friday both inverted VIX and price have moved lower. Neither have made new short-term swing lows below the prior lows of the 15th of August. There is no new divergence.
DOW THEORY
Dow Theory confirmed a bear market in December 2018. This does not necessarily mean a bear market at Grand Super Cycle degree though; Dow Theory makes no comment on Elliott wave counts. On the 25th of August 2015 Dow Theory also confirmed a bear market. The Elliott wave count sees that as part of cycle wave II. After Dow Theory confirmation of a bear market in August 2015, price went on to make new all time highs and the bull market continued.
DJIA: 23,344.52 – a close on the 19th of December at 23,284.97 confirms a bear market.
DJT: 9,806.79 – price has closed below this point on the 13th of December.
S&P500: 2,532.69 – a close on the 19th of December at 2,506.96 provides support to a bear market conclusion.
Nasdaq: 6,630.67 – a close on the 19th of December at 6,618.86 provides support to a bear market conclusion.
With all the indices having moved higher following a Dow Theory bear market confirmation, Dow Theory would confirm a bull market if the following highs are made:
DJIA: 26,951.81 – a close above this point has been made on the 3rd of July 2019.
DJT: 11,623.58 – to date DJT has failed to confirm an ongoing bull market.
S&P500: 2,940.91 – a close above this point was made on the 29th of April 2019.
Nasdaq: 8,133.30 – a close above this point was made on the 26th of April 2019.
Published @ 02:00 a.m. EST on August 24, 2019..
—
Careful risk management protects your trading account(s).
Follow my two Golden Rules:
1. Always trade with stops.
2. Risk only 1-5% of equity on any one trade.
—
New updates to this analysis are in bold.

Its headlines like this that I DO NOT want to see at the moment when I’m in the midst of opening a short position:
https://www.cnbc.com/2019/08/26/lehman-like-drop-nomuras-masanari-takada-warns-it-could-happen-in-a-week.html
Too many traders are scared of a big correction or “crash” coming soon, in this case as early as next week. Last Friday spooked everyone. Ya’ll know what that usually means… We’re going higher 🙁
The daily ES candle today has a loooooong lower wick, and SPX finished at (very close) to the highs of the day… I think we’re going higher folks, at least to 2900 it seems like.
I’ve been noticing a lot of bearish “news” too and I thought exactly the same thing.
If the apparent consensus is bearish, then a low may be in.
So of course I’ve gone and looked at a monthly chart comparing 08/09 to now. Not much similarity at all! Late 07 and early 08 the market fell hard through the 21 period (monthly) EMA and hit the lower volatility band, moved sideways in a very narrow range for 2 months, then price started collapsing hard.
Here, price did that in late ’18 (busted the 21 period EMA and tagged the lower volatility band). Then took off like a rocked above above the 21 period EMA, where price has been generally up trending and staying above. NOTHING like 07/08. 07/08 the monthly bars were solidly down trend then strong down trend. Here, the monthly trend achieved “up” the prior 2 months, and the August trend reads “neutral”. NOTHING like 07/08.
Maybe he’s talking about some other similarity, because it’s certainly not a chart/price/pattern/trend similarity.
Hourly chart updated:
Am I the only one thinking that we are still in the main wave count?
The action is more similar to the 14th (big down day) & 15th (balanced day) then a gap up
We are one tweet away from not being, I’d say. Monitor your twitter feed. Seriously. This dude drives this market like no other news right now (and maybe ever for a single person, day after day), that’s simply reality. I’m tired of learning about it only from market action, when if I’d just had the feed in front of me, I’d be able to be among the first to react.
Lol, yeah I do follow him & you are correct, one negative tweet and we could be 100 down, one positive we could be 50 up… ?
And he tweets sooo much, it’s crazy
I use Twitter to watch funny cat videos. I have lots of politicians blocked. I find my mental health is improved by this technique 🙂
Lmao! Cheers to Lara 🙂
The ES future overnight made a new low below the August 15 low. Therefore ES cannot be in an ABCDE triangle (D cannot go below B).
If ES makes a new high on the day, there would be 5 clear waves up from the low of Sunday night, which would be highly suspicious.
I would stop any short ES position at 2889
Futures are a different. Triangle is still in play.
It would appear we are at Dec 7 (ominous), 2018, once again. Compare these two hourly charts of SPX. We all know what followed in December.
And today…
Anyone have an opinion about when e starts?
I’m thinking noon tomorrow.
I don’t expect an E myself. The time gap between the (theoretic) C and D leads me to think the first alt is the one. I’m thinking this move up gets no more that 62% of the way and probably less.
Yep!
The FED’s depleted quiver of only a few hundred basis points to tackle the first negative quarter GDP print is the proverbial Sword of Damocles hanging over the U.S. economy. It is so interesting how little discussion of this is taking place at the moment. I used to think the FED was crazy but certainly NOT suicidal. The about sudden about-face and swift capitulation to all the whining and market tantrum leaves me not quite so sure. They could be both! Lol!
The analysis of the August flash Markit PMI report at the theotrade site it quite interesting. Here’s the conclusion:
“In this article, I discussed the strong monthly growth in the leading indicators index and the strong jobless claims report. The weak Markit flash index was seized by the bears as further evidence of a recession. They must be ignoring that even this weak PMI is consistent with 1.5% GDP growth. It’s still early in the quarter, but it looks like GDP growth will be between 1.7% and 2.2%. The trough of this cyclical decline is likely near especially if there is a trade deal. This is the bears’ best chance at a recession; it doesn’t look like it will happen for them.”
I think the key phrase here is “especially if there is a trade deal”. That’s another kettle of fish.
The full report is at theotrade dot com, followed by markit-pmi-consistent-with-just-1-5-q3-gdp-growth.
SPX up +20 and yet VIX is also up / green. All those contemplating going long SPX, be warned. The pro’s are not buying this rally.
Kevin, I admit I am fooliish. But not foolish enough to pet a bison! I am not that fool in the photo below.
Ahh, he looks friendly enough. Kind of like buying into this market right now…looks safe today! Lol!!!!
Yep! Complacent bulls apparently could care less. We are about to register a THIRD live H.O. on the clock simultaneously. Entirely unprecedented in the Omen’s entire history, so far as I know…
By way of analogues, as I see it, the market is most likely at 12/10/18. Ready to tank. The nature of the action now, like then, looks strongly distributive. The economic situation isn’t even very bad yet, there’s very high potential for a stream of worsening news, and there are no signs the drivers of the issues are going to change course anytime soon. But this time it’s actual economic problems, not just a Fed threatening to slowly tighten credit as it was then. The down ward momentum is quite strong, and there’s “time gap” between this down move and the prior up and down swings, which is a structural red flag to me. For all these reasons I’m viewing the alternate (either, though I’d lean toward the first) as the highest probability model going forward. The market mode is in a strong down trend and the edge is to the short side here.
The move down from the highs has very odd (which is to say, none) Fibonacci structure with the current low in place. The next low down that does give it good structure is as shown, about 2776 (/ES). A level to watch closely for a turn back up if approached.
sold my calls for small profit, added to SPXS, and waiting to add some puts …
OK time for my first bite
Nice pick up Kevin on the December 10th analogy. I was just looking at that last night, and hoping for some “market symmetry,” meaning I was hoping to have a counter-trend rally for a good shorting opportunity… and looks like we’re getting that today 🙂
Can it push up to 2900 level, maybe even 2910???
EWO in full agreement with Kevin’s take…
Battle for next round number at 2800 underway in ES…
It is fascinating how persitent market complacency remains in the face of heightened market risk. DJIA 500 point down days barely raise an eyebrow these days. For example, there was a time when a 600 point decline in the DOW would almost certainly be accompanied by some kind of VIX capitulation spike, granted such declines are now taking place from quite elevated levels. No such thing yesterday was seen. As bearish as I tend to be, such complacency does raise a bit of cautiinary ursine fur…! 🙂
Cautionary ursine fur, oh my. Lions and tigers and bears, oh my.
It is nice to have you posting with some regularity once again Verne. I hope it can continue.
Hiya old friend.
Thought I would get back in the trenches with the gang for what looks to be a few exciting weeks.
Hope that shoulder heals speedily! 😉
Going long SPX at this moment is similar in risk and foolishness as the following photo.
dare I ask if that’s you, then?
The lack of such a VIX spike is even more bearish IMO. That would mean we have more downside left in this second wave down. If VIX would have spiked into the 30’s I’d be worried about a rally to start the week.
Meanwhile things in Hong Kong are heating up more unfortunately, adding to more risk and uncertainty. As Kevin posted yesterday September and October sure look more gloomy after yesterday’s action.
Good to see you posting again Verne 🙂
Hiya Ari.
These great VIX trading set-ups are fun to trade.
I particularly like the spikes that allow great entries on third and fifth wave completions with those sneaky sniper “stink” bids when positions go nicely deep in the green shortly after a fill! 🙂
We are truly tweetering on the edge of a bear market!!
Well look who’s numero uno!
🙂
Well you’re #1 in my book ari. But it should be noted, so are all the posters on this forum. Have a great weekend.
Monday, I travel 4 hours one way by car to have 29 staples removed from my shoulder and get a release for the next phase of physical therapy.
Good to see things coming along smoothly 🙂