For the short term, a little more downwards movement was expected. Price has moved sideways in a very small range for the session, which overall fits the Elliott wave count.
Summary: For the very short term, price may move a little more sideways and then lower to about 2,874 (this expectation may be too low). Thereafter, the upwards trend is expected to resume with strength.
The low of December 2018 is expected to most likely remain intact.
The next short-term target is at 3,068. This next upwards wave may exhibit further strength. Look for corrections to continue to be very shallow and brief.
The mid-term target remains at 3,104 for a more time consuming consolidation or pullback, which may also be shallow.
The biggest picture, Grand Super Cycle analysis, is here.
Monthly charts were last published here, with video here. There are two further alternate monthly charts here, with video here.
ELLIOTT WAVE COUNTS
The two Elliott wave counts below will be labelled First and Second. They may be about of even probability. When the fifth wave currently unfolding on weekly charts may be complete, then these two wave counts will diverge on the severity of the expected following bear market. To see an illustration of this future divergence monthly charts should be viewed.
FIRST WAVE COUNT
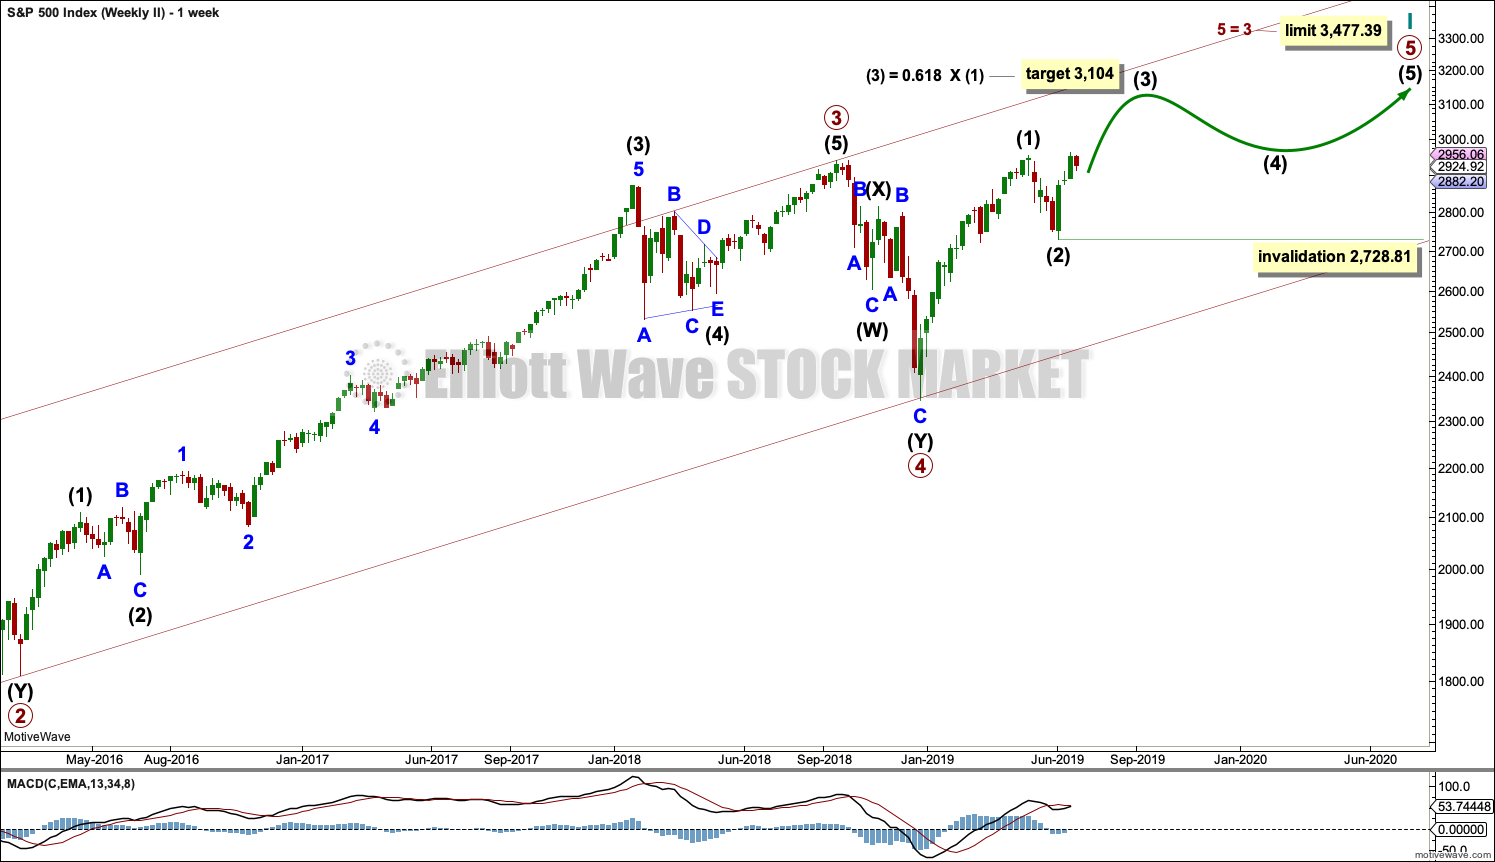
WEEKLY CHART
The basic Elliott wave structure consists of a five wave structure up followed by a three wave structure down (for a bull market). This wave count sees the bull market beginning in March 2009 as an incomplete five wave impulse and now within the last fifth wave, which is labelled cycle wave V. This impulse is best viewed on monthly charts. The weekly chart focusses on the end of it.
Elliott wave is fractal. This fifth wave labelled cycle wave V may end a larger fifth wave labelled Super Cycle wave (V), which may end a larger first wave labelled Grand Super Cycle wave I.
The teal Elliott channel is drawn using Elliott’s first technique about the impulse of Super Cycle wave (V). Draw the first trend line from the end of cycle wave I (off to the left of the chart, the weekly candlestick beginning 30th November 2014) to the end of cycle wave III, then place a parallel copy on the end of cycle wave II. This channel perfectly shows where cycle wave IV ended at support. The strongest portion of cycle wave III, the end of primary wave 3, overshoots the upper edge of the channel. This is a typical look for a third wave and suggests the channel is drawn correctly and the way the impulse is counted is correct.
Within Super Cycle wave (V), cycle wave III is shorter than cycle wave I. A core Elliott wave rule states that a third wave may never be the shortest. For this rule to be met in this instance, cycle wave V may not be longer in length than cycle wave III. This limit is at 3,477.39.
The structure of cycle wave V is focussed on at the daily chart level below.
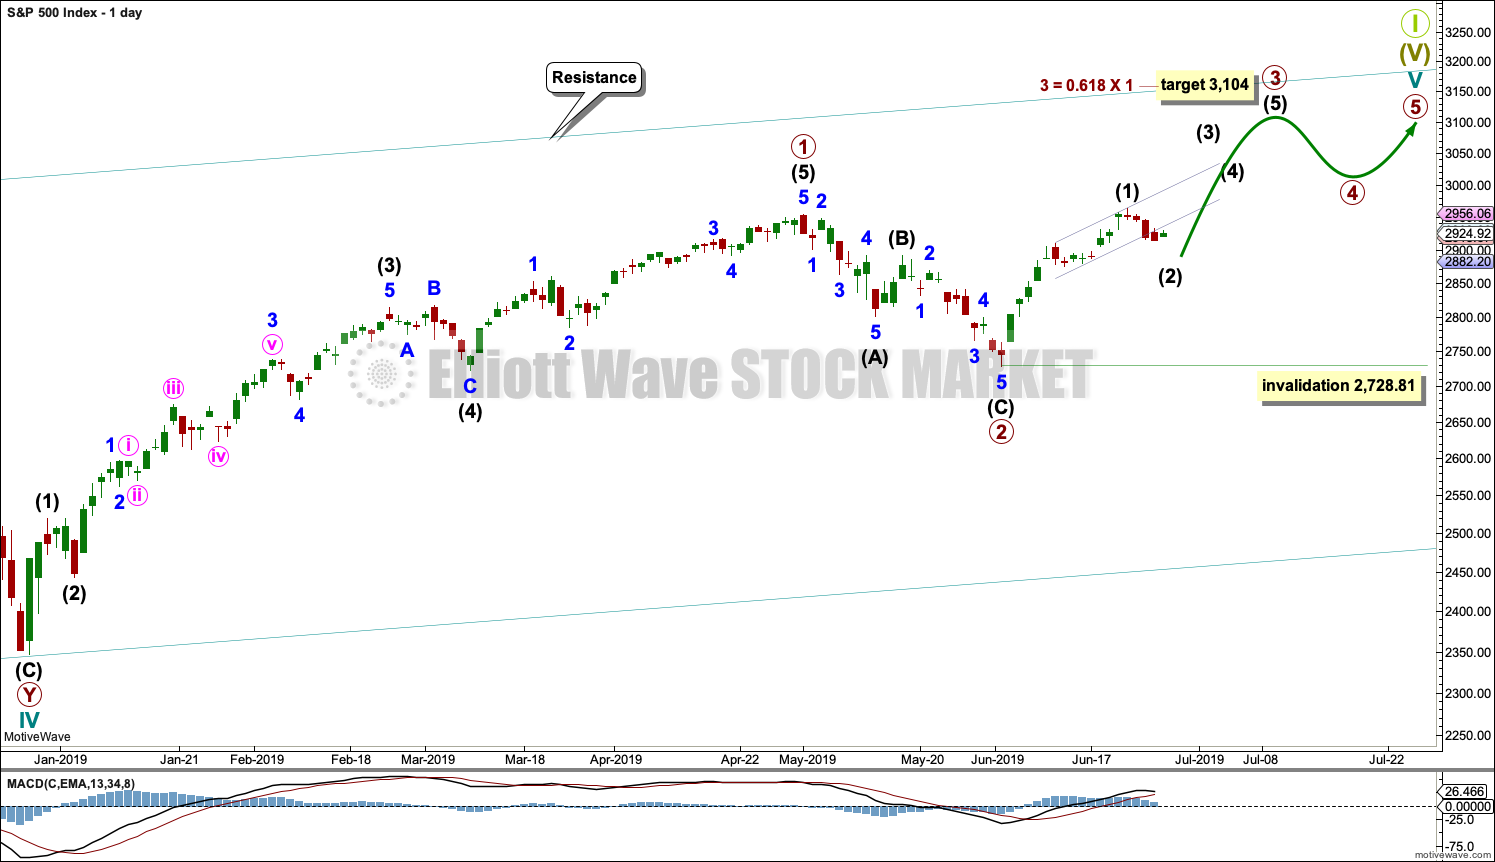
Within cycle wave V, primary waves 1 and 2 may now be complete. Within primary wave 3, no second wave correction may move beyond its start below 2,728.81.
In historic analysis, two further monthly charts have been published that do not have a limit to upwards movement and are more bullish than this wave count. Members are encouraged to consider those possibilities (links below summary) alongside the wave counts presented on a daily and weekly basis.
DAILY CHART
Cycle wave V must subdivide as a five wave motive structure. Within that five wave structure, primary waves 1 and 2 may be complete.
Primary wave 3 must move above the end of primary wave 1 (this rule has now been met). Primary wave 3 may only subdivide as an impulse. Within the impulse, intermediate wave (1) may have been over at the last high. Intermediate wave (2) may now be unfolding and may not move beyond the start of intermediate wave (1) below 2,728.81.
When primary wave 3 is over, then primary wave 4 may be a shallow sideways consolidation.
Thereafter, primary wave 5 should move above the end of primary wave 3 to avoid a truncation.
Primary wave 1 lasted 86 sessions, 3 short of a Fibonacci 89. Primary wave 2 lasted 22 sessions, 1 longer than a Fibonacci 21. Primary wave 3 may end about a Fibonacci 55 sessions, give or take two or three sessions either side. This is a rough guideline only.
So far primary wave 3 has lasted 18 sessions.
HOURLY CHART
This short-term wave count expects that intermediate wave (1) was over at the last high and intermediate wave (2) may be currently unfolding.
Intermediate awe (2) would most likely subdivide as a zigzag. Minor wave A would most likely subdivide as a five wave structure, and it may be a complete impulse. Minor wave B may may not move beyond the start of minor wave A above 2,964.15. Minor wave B may be continuing sideways as a triangle as labelled, although it may yet morph into any one of more than 23 possible Elliott wave corrective structures.
When minor wave B may be complete, then the Fibonacci ratio between minor waves A and C may be used to again calculate a target for minor wave C to end. The target calculated will probably be more shallow than the 0.382 Fibonacci ratio.
The strong upwards pull of intermediate wave (3) within primary wave 3 just ahead may force intermediate wave (2) to be relatively shallow.
SECOND WAVE COUNT
WEEKLY CHART
This weekly chart is almost identical to the first weekly chart, with the sole exception being the degree of labelling.
This weekly chart moves the degree of labelling for the impulse beginning in March 2009 all down one degree. This difference is best viewed on monthly charts.
The impulse is still viewed as nearing an end; a fifth wave is still seen as needing to complete higher. This wave count labels it primary wave 5.
TECHNICAL ANALYSIS
MONTHLY CHART
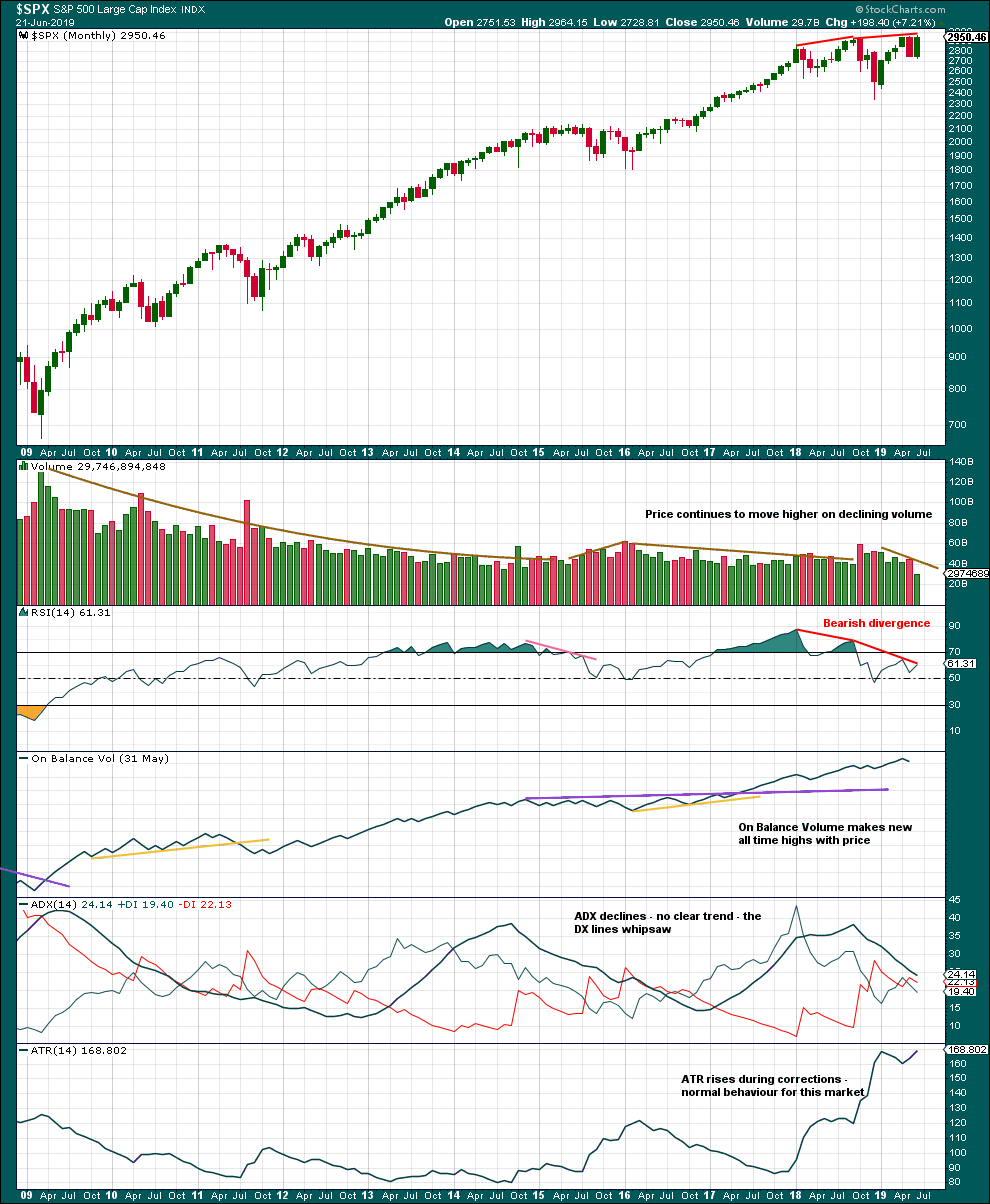
Click chart to enlarge. Chart courtesy of StockCharts.com.
This monthly chart shows the entire bull market from the low in March 2009.
Greatest strength as measured by RSI was in what the Elliott wave count sees as the end of a third wave. This wave count fits with classic technical analysis.
Declining volume persisting for years fits an expectation for a Super Cycle degree fifth wave. This fits the first weekly chart. Although declining volume may also appear within a first wave, this may be less likely.
RSI currently exhibits strong bearish divergence over several months, which is a warning of some underlying weakness developed and persisting. This may continue as a fifth wave comes to an end.
WEEKLY CHART
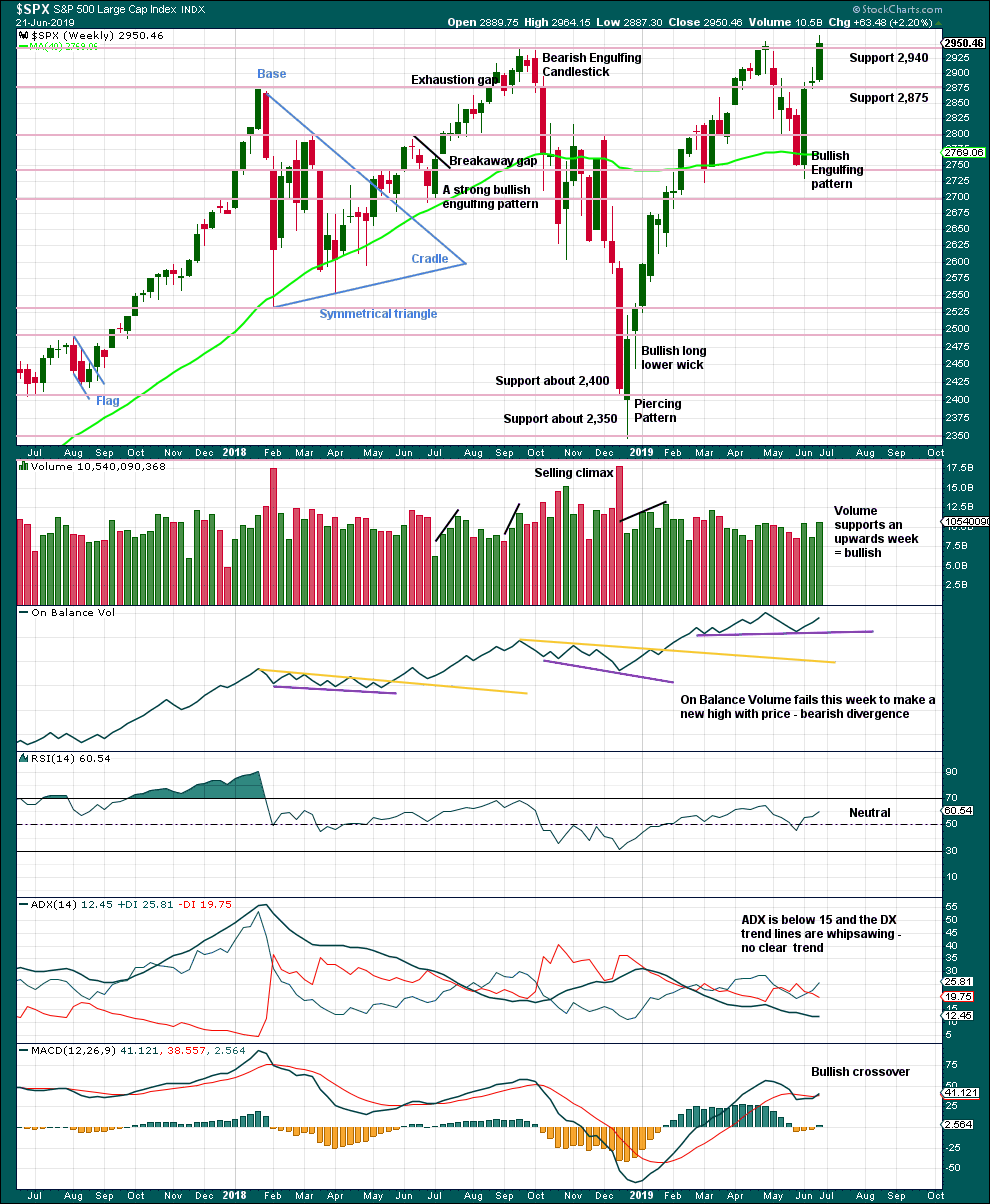
Click chart to enlarge. Chart courtesy of StockCharts.com.
While price has made a new all time high on Friday, it has not closed at a new all time high. However, a strong bullish candlestick with support from volume suggests more upwards movement overall this week.
DAILY CHART
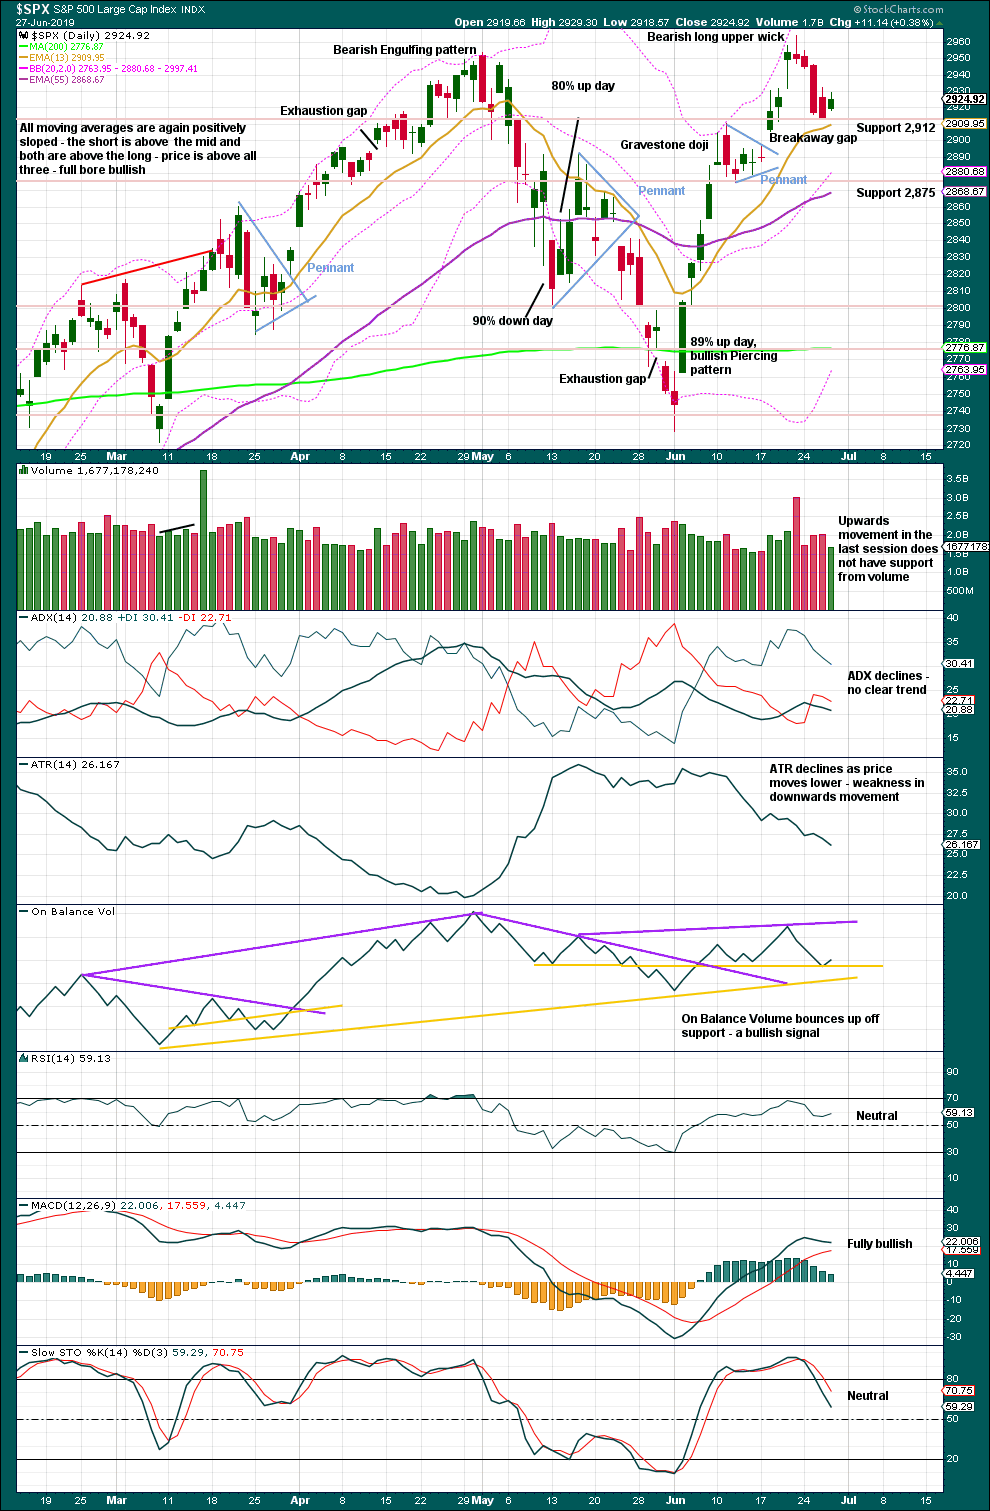
Click chart to enlarge. Chart courtesy of StockCharts.com.
The breakaway gap may offer support at 2,897.27. If this gap is closed, then next support may be about 2,875.
An inside day today with the balance of volume upwards closes green. Upwards movement within this last session lacks support from volume. This fits normal behaviour for a B wave and supports the short-term Elliott wave count.
BREADTH – AD LINE
WEEKLY CHART
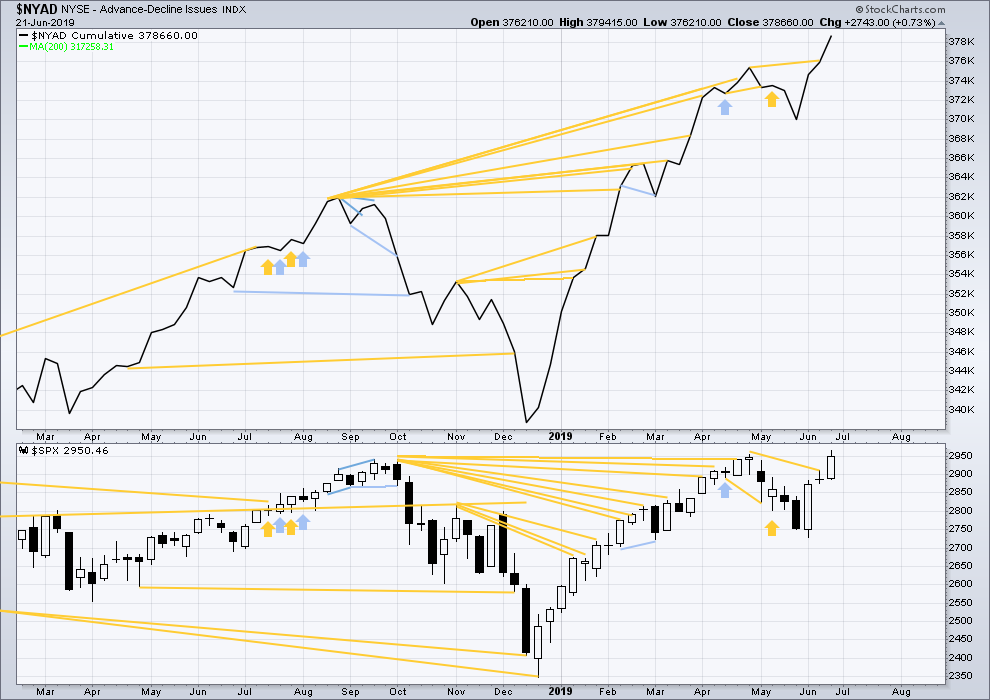
Click chart to enlarge. Chart courtesy of StockCharts.com. So that colour blind members are included, bearish signals
will be noted with blue and bullish signals with yellow.
Bear markets from the Great Depression and onwards have been preceded by an average minimum of 4 months divergence between price and the AD line with only two exceptions in 1946 and 1976. With the AD line making new all time highs last week, the end of this bull market and the start of a new bear market is very likely a minimum of 4 months away, which is mid October 2019.
In all bear markets in the last 90 years there is some positive correlation (0.6022) between the length of bearish divergence and the depth of the following bear market. No to little divergence is correlated with more shallow bear markets. Longer divergence is correlated with deeper bear markets.
If a bear market does develop here, it comes after no bearish divergence. It would therefore more likely be shallow.
Last week large caps have made new all time highs, but mid caps are a little distance off doing so and small caps are lagging far behind. This is normal in the latter stages of an aged bull market.
DAILY CHART
Click chart to enlarge. Chart courtesy of StockCharts.com. So that colour blind members are included, bearish signals
will be noted with blue and bullish signals with yellow.
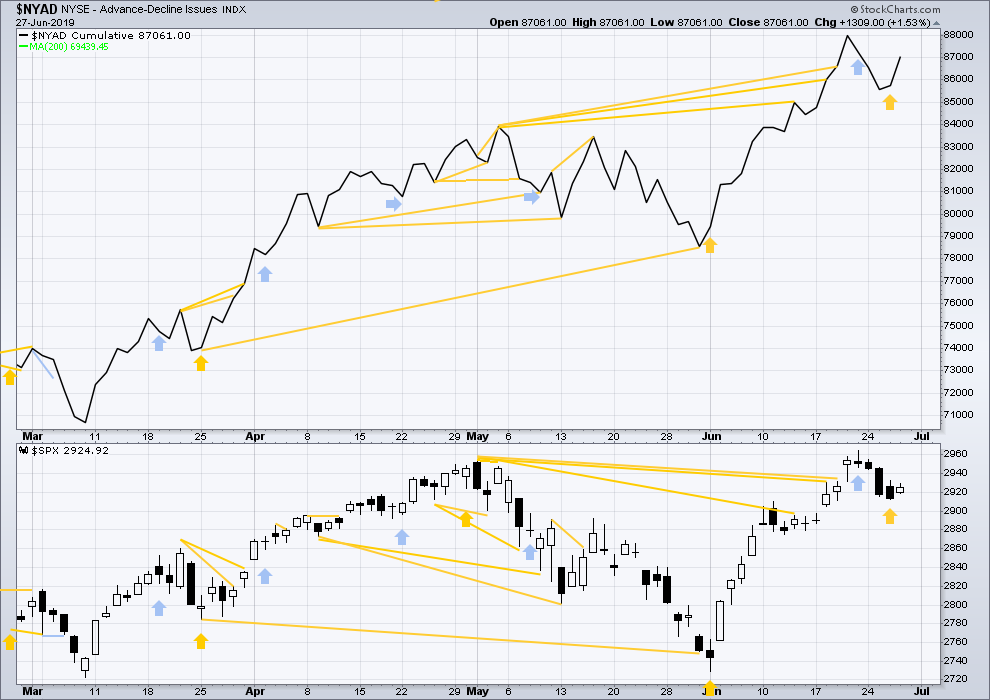
Breadth should be read as a leading indicator.
Bullish divergence noted in last analysis has been followed by a little upwards movement. It may now be resolved, or it may yet be followed by a little more.
Today both the AD line and price have moved higher. Neither have made new highs. There is no divergence.
VOLATILITY – INVERTED VIX CHART
WEEKLY CHART
Click chart to enlarge. Chart courtesy of StockCharts.com. So that colour blind members are included, bearish signals
will be noted with blue and bullish signals with yellow.
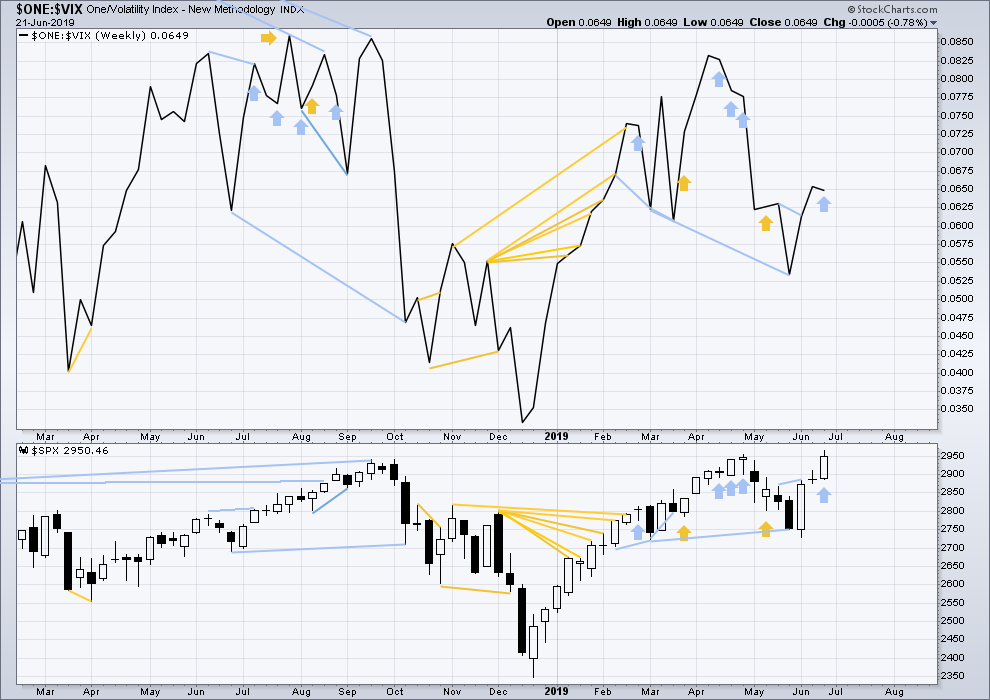
Long-term bearish divergence remains. It may develop further before the upwards trend ends.
This week price moved higher, but inverted VIX has moved slightly lower. This is a single week of bearish divergence. The divergence may yet develop further before it is followed by reasonable downwards movement.
DAILY CHART
Click chart to enlarge. Chart courtesy of StockCharts.com. So that colour blind members are included, bearish signals
will be noted with blue and bullish signals with yellow.
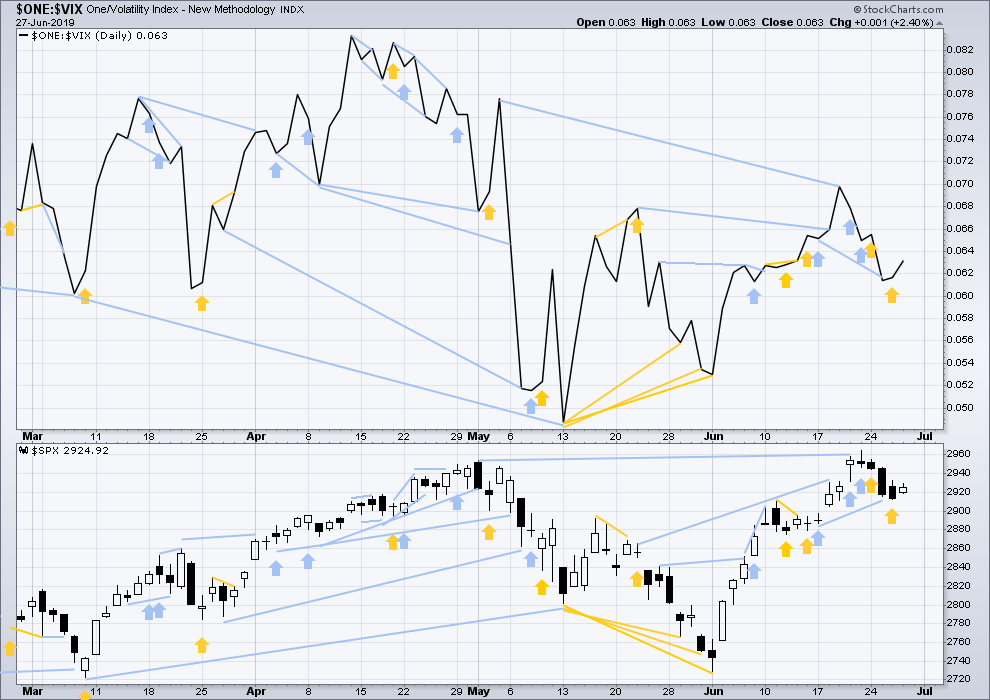
Bullish divergence noted in last analysis has now been followed by a little upwards movement. It may be resolved here, or it may yet be followed by a little more upwards movement.
Today both price and inverted VIX have moved higher. Neither have made new highs. There is no new divergence.
DOW THEORY
Dow Theory confirmed a bear market in December 2018. This does not necessarily mean a bear market at Grand Super Cycle degree though; Dow Theory makes no comment on Elliott wave counts. On the 25th of August 2015 Dow Theory also confirmed a bear market. The Elliott wave count sees that as part of cycle wave II. After Dow Theory confirmation of a bear market in August 2015, price went on to make new all time highs and the bull market continued.
DJIA: 23,344.52 – a close on the 19th of December at 23,284.97 confirms a bear market.
DJT: 9,806.79 – price has closed below this point on the 13th of December.
S&P500: 2,532.69 – a close on the 19th of December at 2,506.96 provides support to a bear market conclusion.
Nasdaq: 6,630.67 – a close on the 19th of December at 6,618.86 provides support to a bear market conclusion.
With all the indices having moved higher following a Dow Theory bear market confirmation, Dow Theory would confirm a bull market if the following highs are made:
DJIA: 26,951.81
DJT: 11,623.58
S&P500: 2,940.91 – a new all time high has been made on the 29th of April 2019.
Nasdaq: 8,133.30 – a new high has been made on 24th of April 2019.
Published @ 05:34 p.m. EST.
—
Careful risk management protects your trading account(s).
Follow my two Golden Rules:
1. Always trade with stops.
2. Risk only 1-5% of equity on any one trade.
—
New updates to this analysis are in bold.

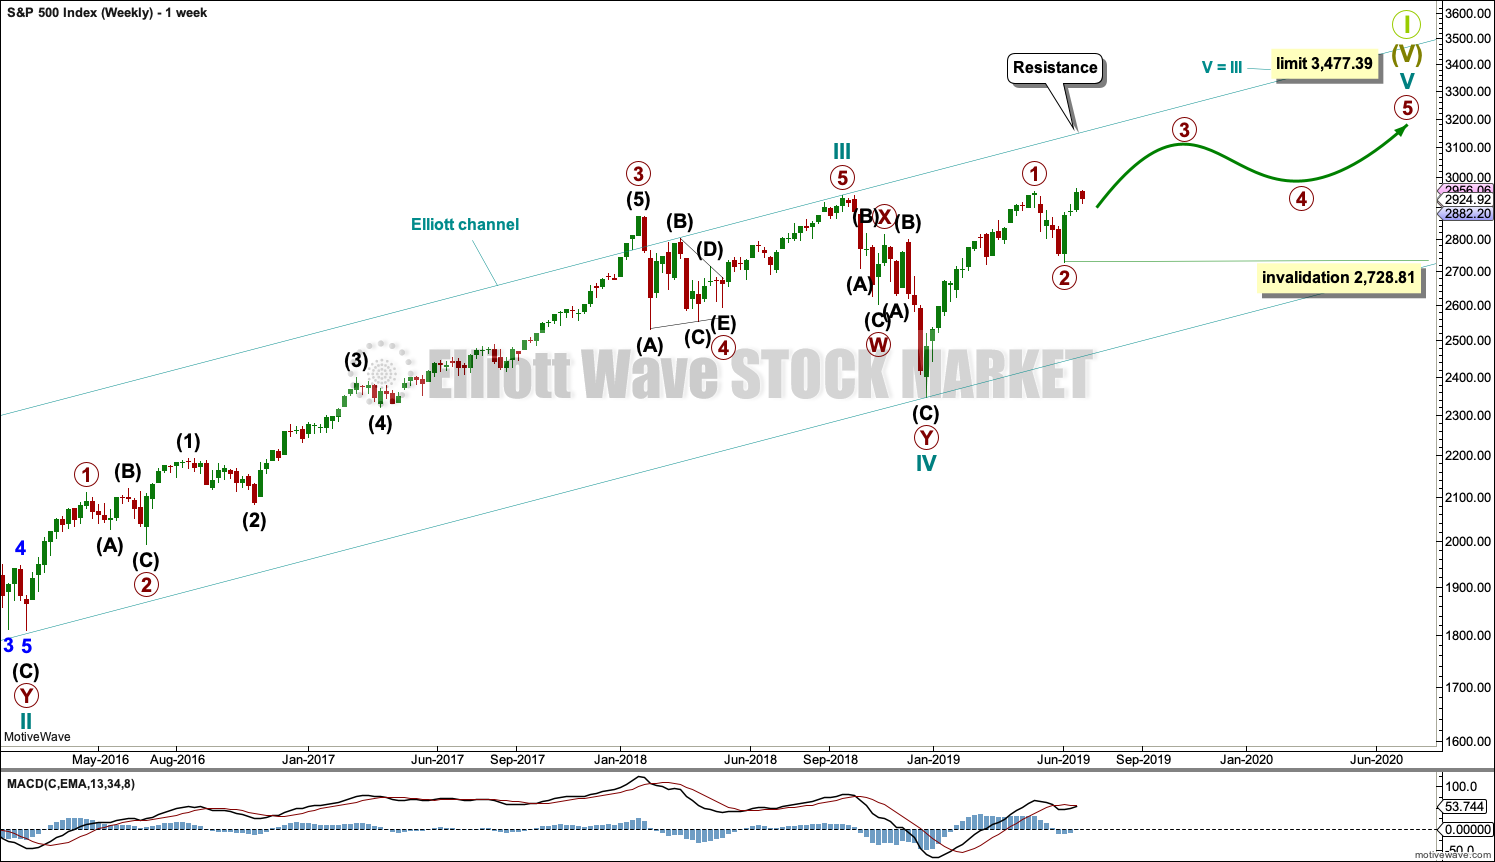
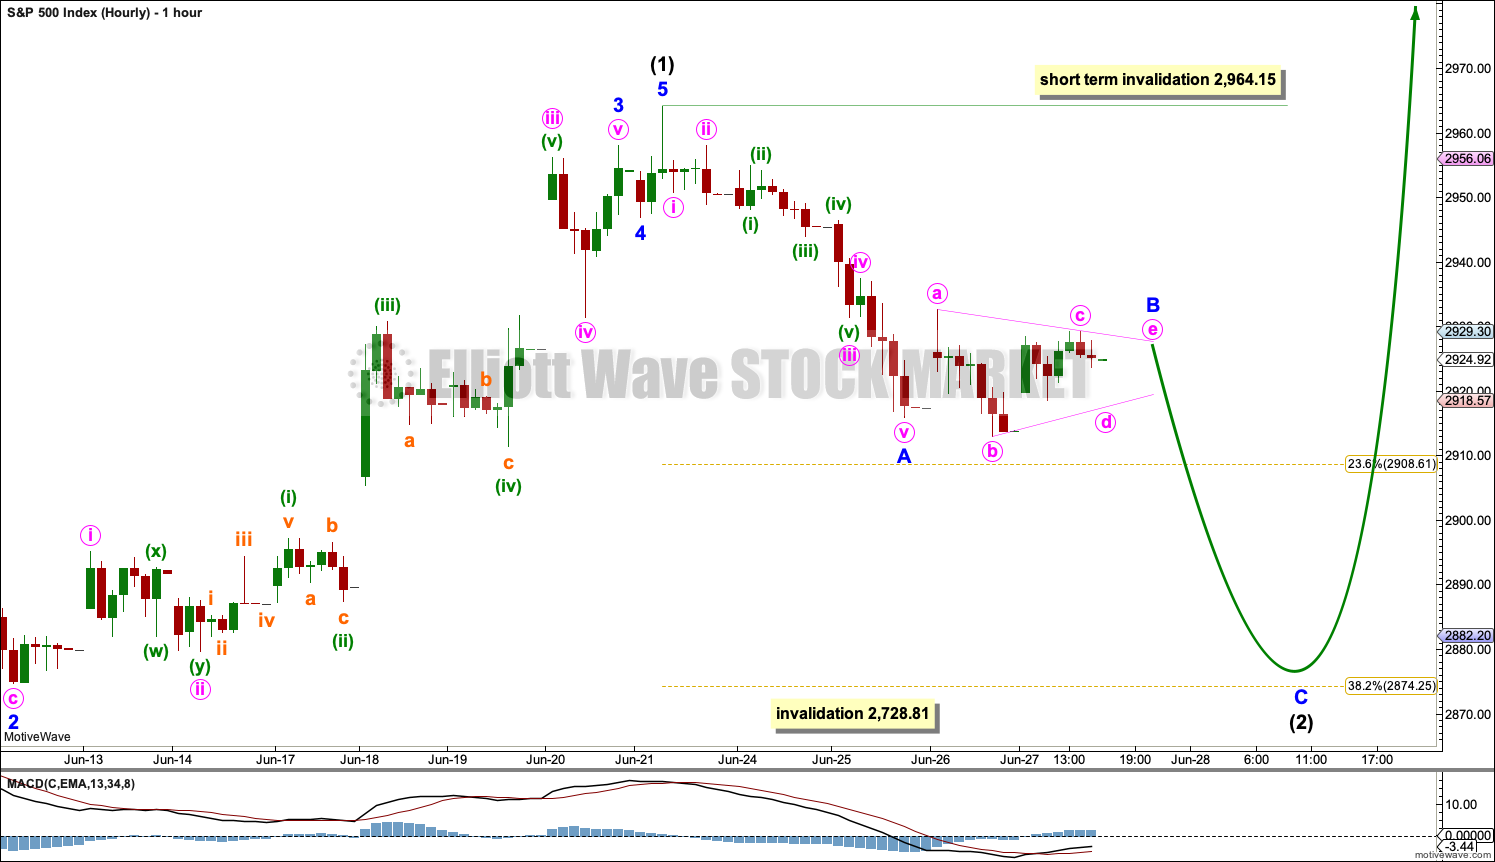
Hourly chart updated:
Minor B may be an almost complete expanded flat. Expanded flats don’t fit neatly into channels, so I’m drawing a channel about minute c of it. When this channel is breached by downwards movement that may be taken as early indication that minor B may be over and minor C downwards may then have begun. At that stage I’ll calculate a new target for minor C which will probably be higher than the 0.302 Fibonacci ratio.
The target for minor B to end may be the 0.618 Fibonacci ratio of minor A.
painful story to share: DRIP had a reverse split so my options were liquidated while my position was underwater….. always learning
maybe this B up is an expanding flat, and now executing the 5 wave minute C up to complete it?
Kevin,
If expanded flat, [c] is currently 1.618 of [a]. Good proportions.
*I use square brackets [ ] to represent circles
Wow, Kevin. I’ve been busy with other things the last couple days. Just now stopped to eye-ball a 30-minute chart and thought to myself, “possibly an expanded flat,” labeled exactly how you have shown it here.
What do we have in common? Only the best EW teacher on the planet!
Thanks Curtis.
Yes, that’s what I see too. An expanded flat.
My “fibonacci fitted” projection of a swing high in GLD nailed it. Now, it’ may very well not retrace deeply or last long. The next level should it be exceeded that I’m projecting using the same technique is slightly over 140.
The concept here is simple: extend fibonacci structure up off a low, and “fit” action to the levels. Frequently, you only find a couple (2-3) of overall levels that “fit”. And those provide high quality targets. So far…I’m finding it works shockingly well. I’m going to create a “Catalogue” of markets and targets using this technique and start trying to really measure it’s accuracy.
Here are my fibo fit based targets for completion of the impulse wave up in TLT.
day starting strong, SP500 at over 5-1 advance/decline. and break up through the 38.2%.
will this gap and fill like all the other days this week? Or…is this a gap and go? That will be very telling to me re: whether this 2 might be over. A gap and go here is mighty strong for a B wave…but it still could be of course.
oops! There went the SPX hourly triangle.
What now? Kevin’s H&S?
Looks like a suckers B wave break out at the moment. I even bought some SPY puts as an additional hedge…I’ve learned if there’s no overwhelming evidence, TRUST LARA’S COUNT. But if this market starts to show strength again today, I’ll bail on that fast. The B wave seems to still be plenty alive…and maybe C down has started.
I KNEW if I bought some SPY puts the market would move “against me”. Which is FINE, because most of my $ is in the long side! Bailed on those SPY puts, the gap didn’t fill and price has now pushed up again over the 38% fibo level in SPX. But /ES is still below the neckline of the inverse H&S. The C down probably lives on here and is probably still the most likely short term scenario. But I won’t accept heat on outright put buys. I’ve just lost too too much over the last year holding in these situations, a very small loss becomes a small loss becomes a moderate loss becomes a big loss; option value disappears FAST! I will consider “trying again” if conditions warrant. But I’d be thrilled to hear the bull roar here. And oh look, the RUT is solidly up again today…leading the way.
Overnight /ES hourly.
The head and shoulders bottom looks complete…pending only a neckline break to the upside.
bullish RUT count
bearish rut count.
both are weekly charts.
You’ll have to relabel the correction for <2> as a double zigzag.
When A subdivides as a three then B must retrace a minimum of 0.9 X A, and in this instance it looks to be more shallow than that.
Unless it’s a triangle, but that’s not possible in a second wave position.
RUT bullish count at the daily level, with confidence building levels and incrementally invalidating (or at least reduce probability) levels.
what have we here?!!