
Last analysis on the 8th of April identified a clear price point at 7,234.83 to differentiate two Elliott wave counts. A new high above 7,234.83 on the 10th of May has switched the balance of probability towards another bubble forming for Bitcoin, which would still be in its relatively early stages.
The focus of this analysis will be on identifying a correction for an entry to purchase Bitcoin at a good price.
Summary: Probability has shifted to a new bubble forming that may take price substantially above 19,870.62 in coming months or years. While price remains now above 4,303.37, this view will be most likely.
For the short term, look for a deep correction to begin. The current rise is parabolic and Bitcoin typically corrects deeply after such a rise.
The data used for this analysis comes from Yahoo Finance BTC-USD.
All charts are on a semi-log scale.
MAIN ELLIOTT WAVE COUNT
MONTHLY
Click chart to enlarge.
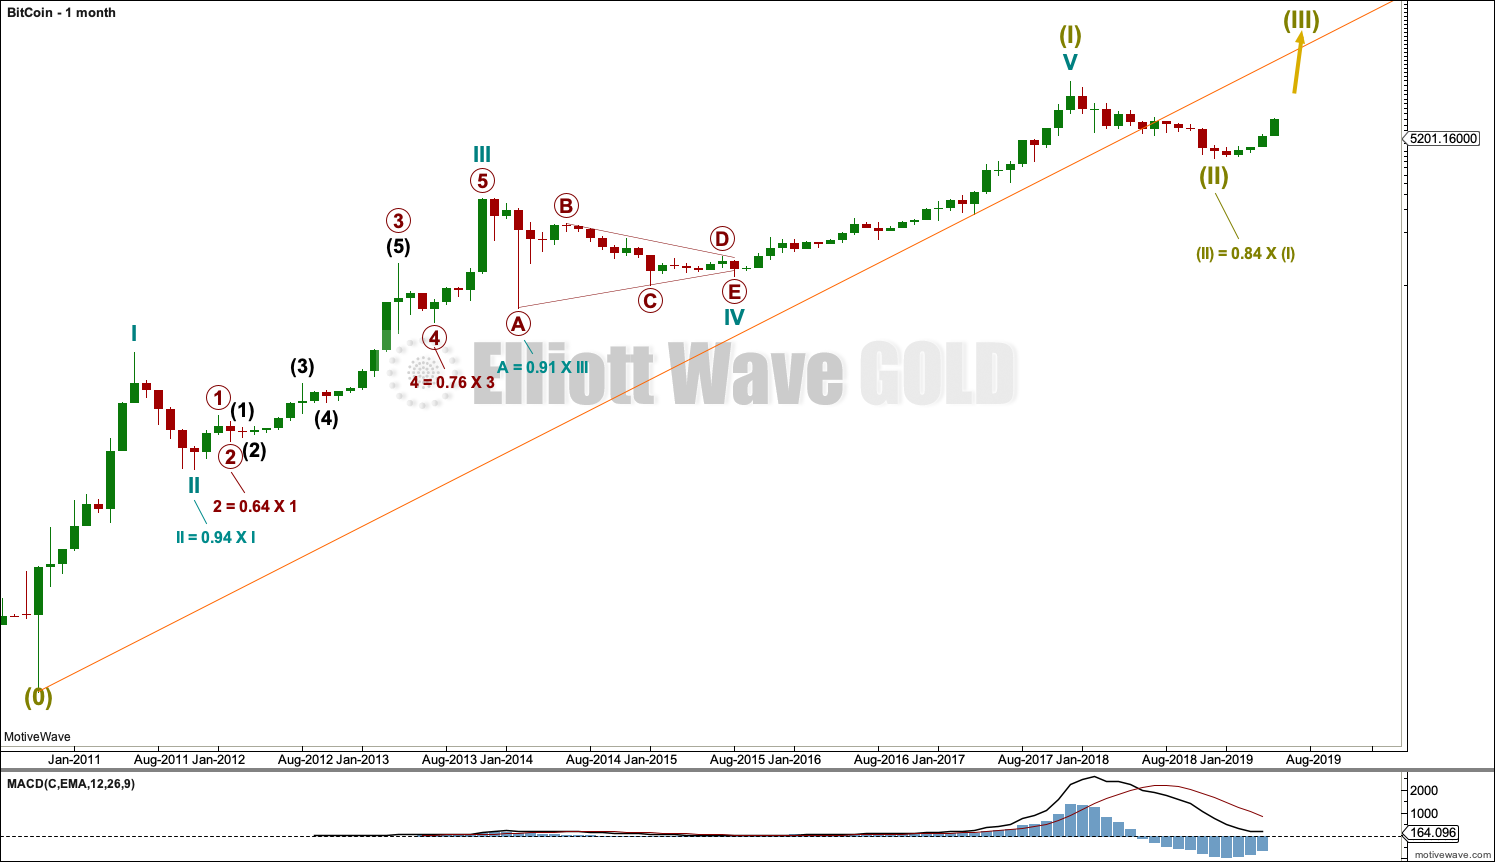
It is possible to see a completed five wave impulse upwards for Bitcoin.
I am unable to find reasonable Fibonacci ratios within this wave count. It appears that Bitcoin may not exhibit Fibonacci ratios very often between its waves, so this makes target calculation impossible. Classic technical analysis was used to identify a high in place on December 23, 2017.
What is very clear from this chart is that Bitcoin forms classic bubbles. It has done so now several times and may now be doing so again. This looks like an even larger bubble than the Tulip Mania. So far each bubble has popped and Bitcoin has collapsed, to then thereafter form a new bubble. Each bubble is larger than the one prior; so if another Bitcoin bubble is forming, it may be expected to take price substantially above the all time high.
WEEKLY
Click chart to enlarge.
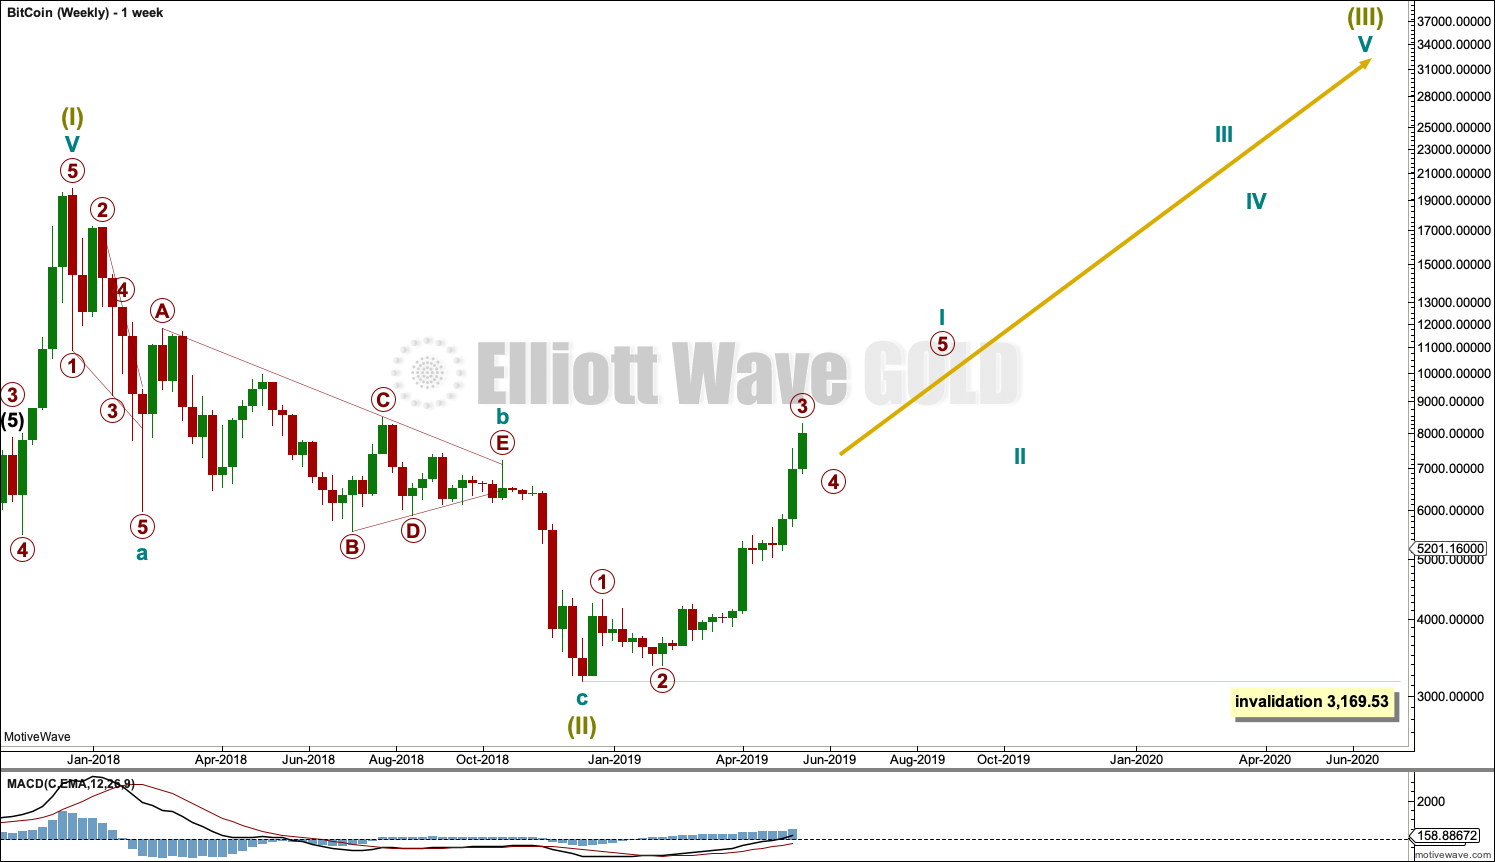
Bitcoin tends to behave like an extreme commodity: price moves upwards for about 2 – 4 weeks in a near vertical movement at the end of its rises. Following this vertical movement the resulting downwards movement is very deep (in percentage terms) and often very quick.
The next rise begins slowly with basing action over weeks or months, and then as the rise nears its end another vertical movement completes it. Also, there are volume spikes just before or at the end, which is another feature typical of commodity like behaviour.
This has happened now several times. The most notable instances are the rise up to the week ending 24th November, 2013, and the week ending 5th June, 2011. The following sharp drops were 94% and 93% respectively.
The last instance was the rise up to the last all time high for Bitcoin at 19,870.62 on the 17th of December 2017. The drop thereafter may now be considered as fairly likely to be complete; although this is not certain, so an alternate Elliott wave count is published below. If the drop is complete, it was only an 84% drop.
Super Cycle wave (II) may be a complete zigzag.
Super Cycle wave (III) must move above the end of Super Cycle wave (I) at 19,870.62. It must move far enough above this point to allow room for Super Cycle wave (IV) to unfold and remain above Super Cycle wave (I) price territory.
Super Cycle wave (I) lasted 7.2 years and Super Cycle wave (II) may have been over within just under one year. It would be reasonable to expect Super Cycle wave (III) to last well over 7 years, possibly a Fibonacci 8 or 13 years.
Super Cycle wave (III) must unfold as a simple five wave impulse, and within this impulse there should be two large corrections for cycle waves II and IV. So far cycle wave I may be incomplete. When cycle wave I may be complete, then cycle wave II may offer a good entry to purchase Bitcoin at a very good price. Cycle wave II may correct to about 0.80 to 0.95 of cycle wave I.
DAILY
Click chart to enlarge.
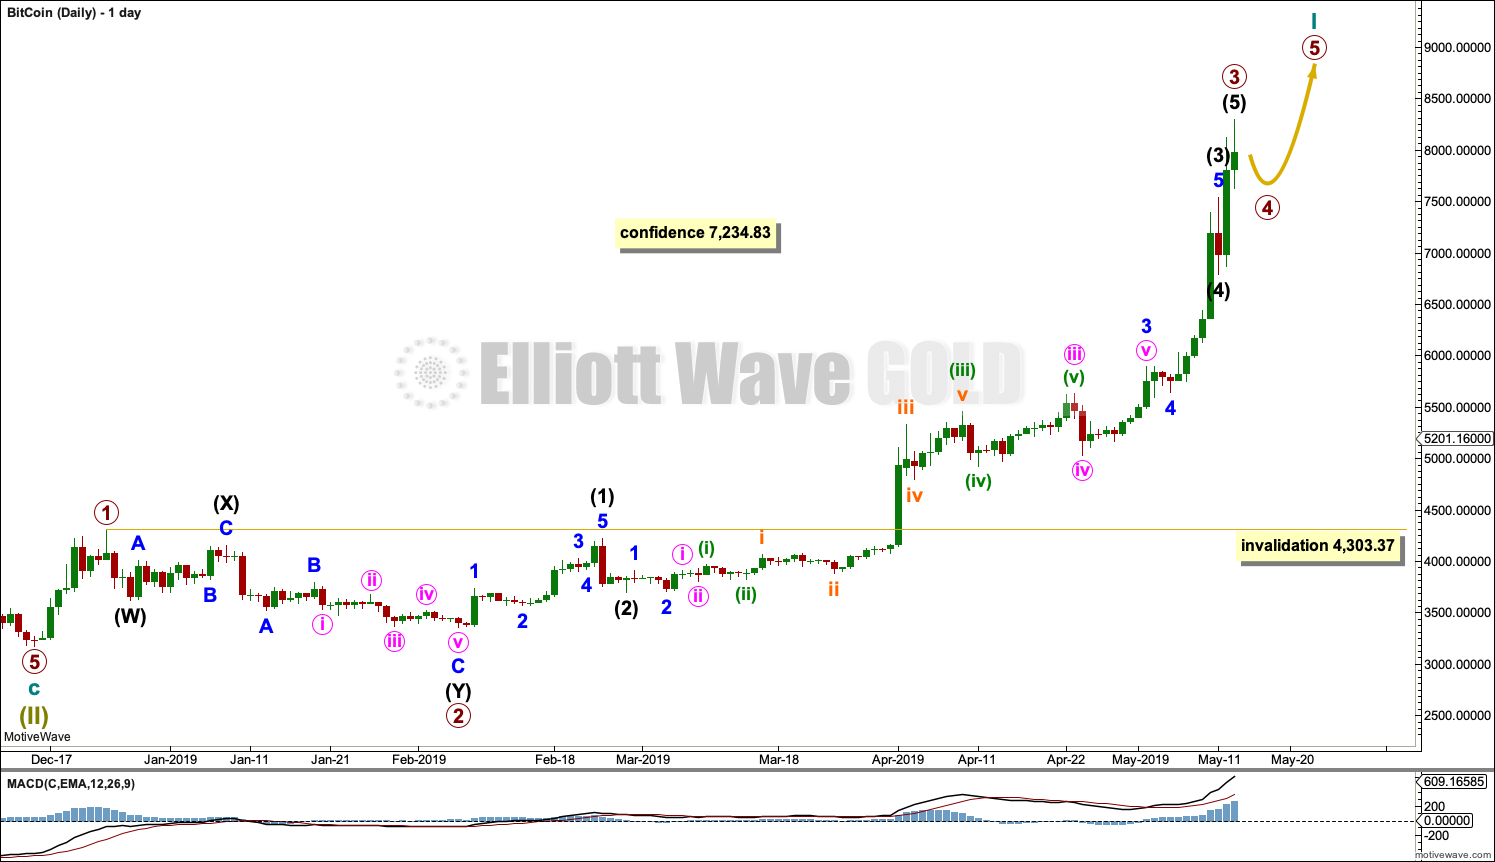
Bitcoin typically forms curved first wave impulses with time consuming and deep second wave corrections, then accelerates through to the end of its third waves, has brief and more shallow fourth wave corrections, and then finishes with explosive fifth waves. This is an extreme behaviour most typically seen in commodities.
So far this wave count sees primary wave 3 complete. Primary wave 4 may be relatively brief and shallow. Primary wave 5 may be explosive.
Primary wave 4 may not move into primary wave 1 price territory below 4,303.37.
ALTERNATE WAVE COUNT
WEEKLY
Click chart to enlarge.
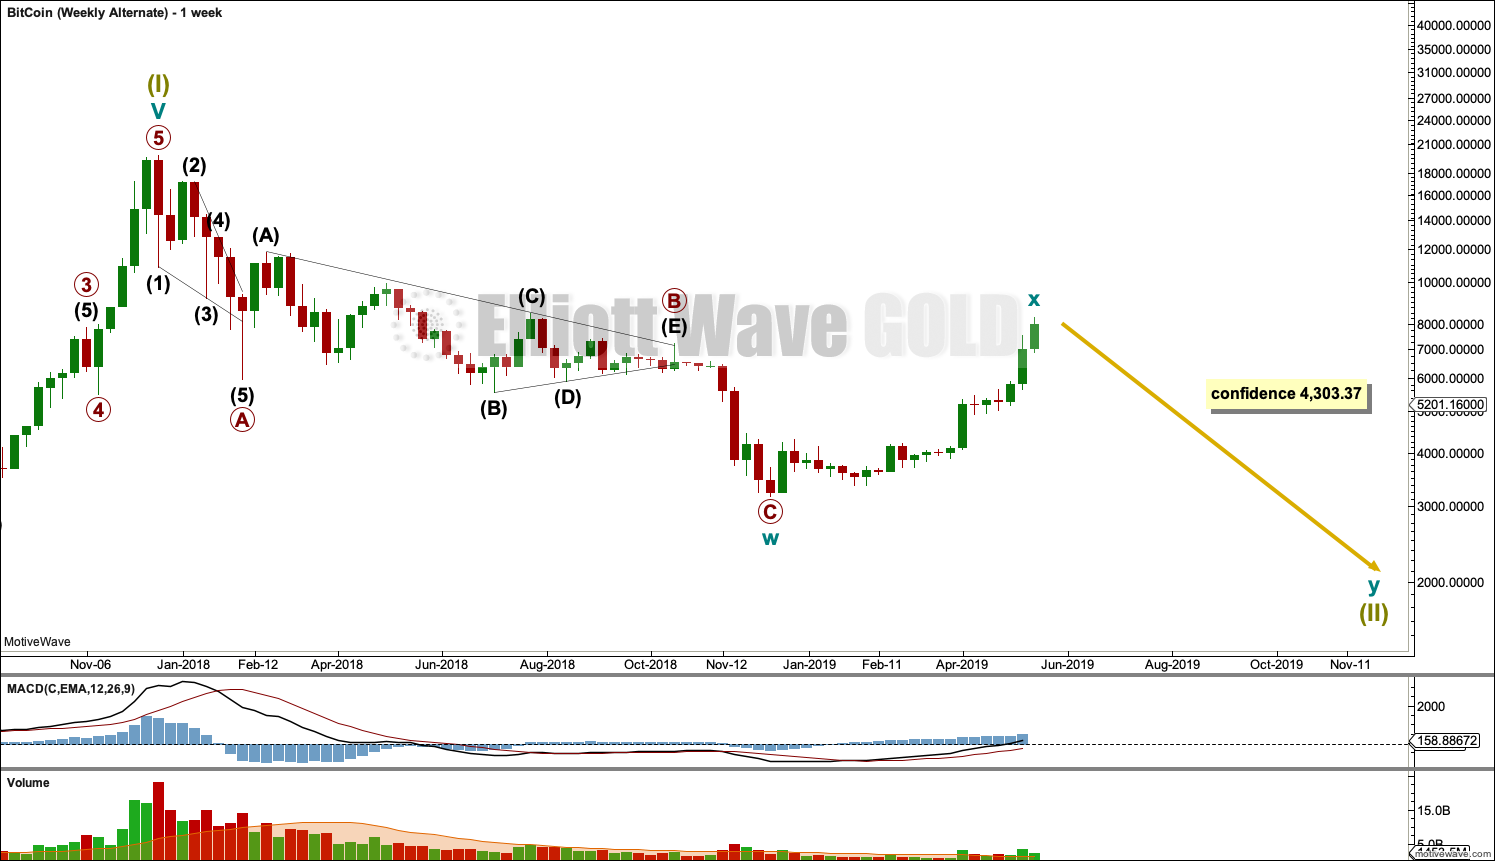
This wave count is identical to the main wave count up to the all time high for Bitcoin. Thereafter, it moves the degree of labelling within Super Cycle wave (II) all down one degree. It is possible that Super Cycle wave (II) may not be complete and may continue lower as a double zigzag. Double zigzags are fairly common Elliott wave corrective structures.
Within the double zigzag, cycle wave x may now be complete. Cycle wave y may begin.
The purpose of a second zigzag in a double is to deepen the correction when the first zigzag does not move price deep enough. To achieve this purpose cycle wave y may be expected to move reasonably below the end of cycle wave w at 3,169.53.
Within multiples, there is no rule stating a limit for X waves. There can be no Elliott wave rule to apply to cycle wave x to determine when this wave count would be invalidated.
DAILY
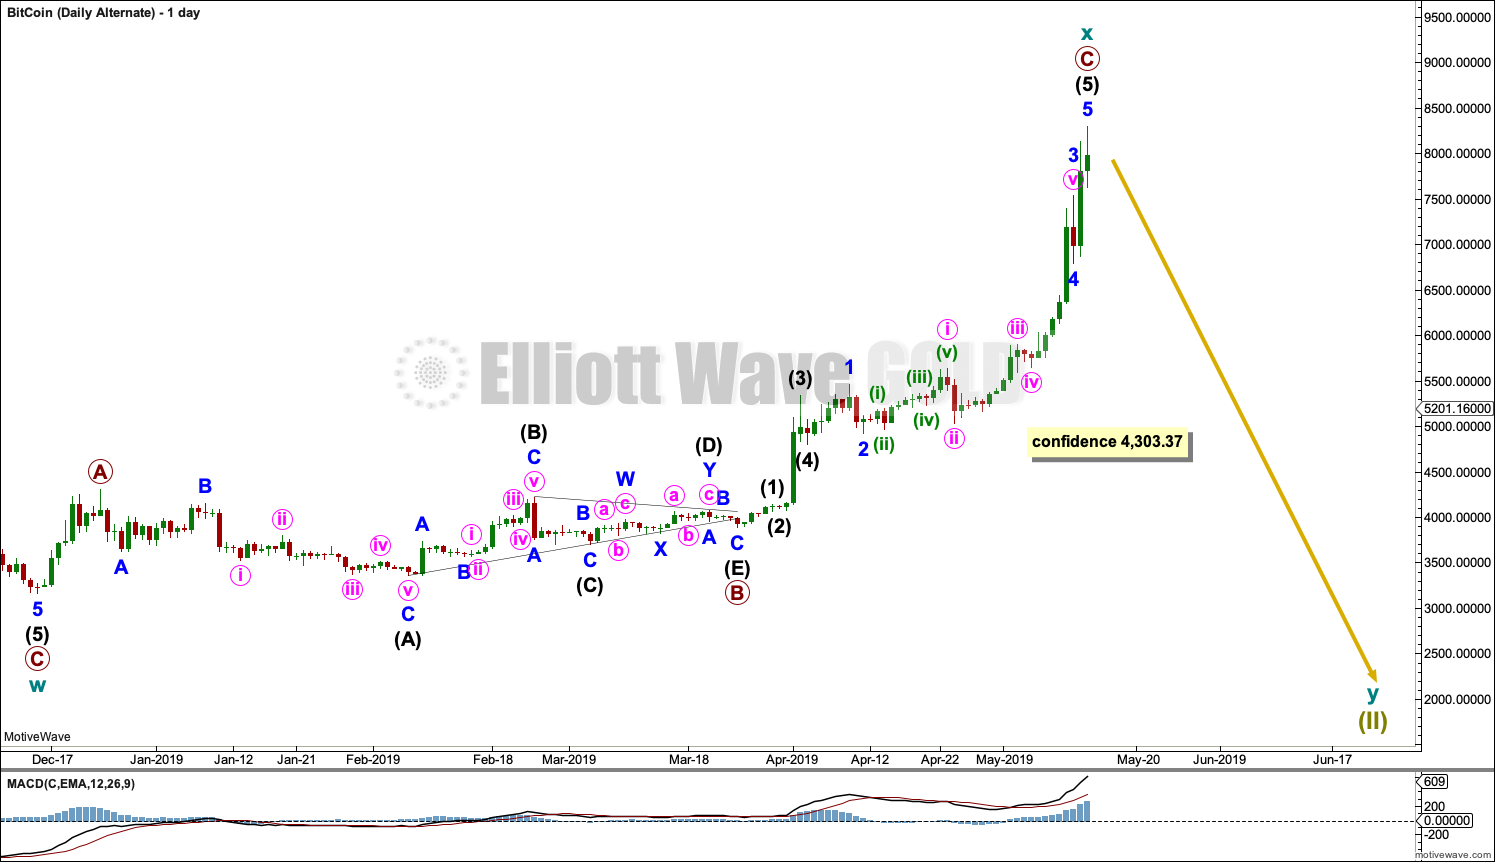
Click chart to enlarge.
Cycle wave x may now subdivide as a completed zigzag.
This wave count now requires a new low below 4,303.37 for confidence.
TECHNICAL ANALYSIS
WEEKLY
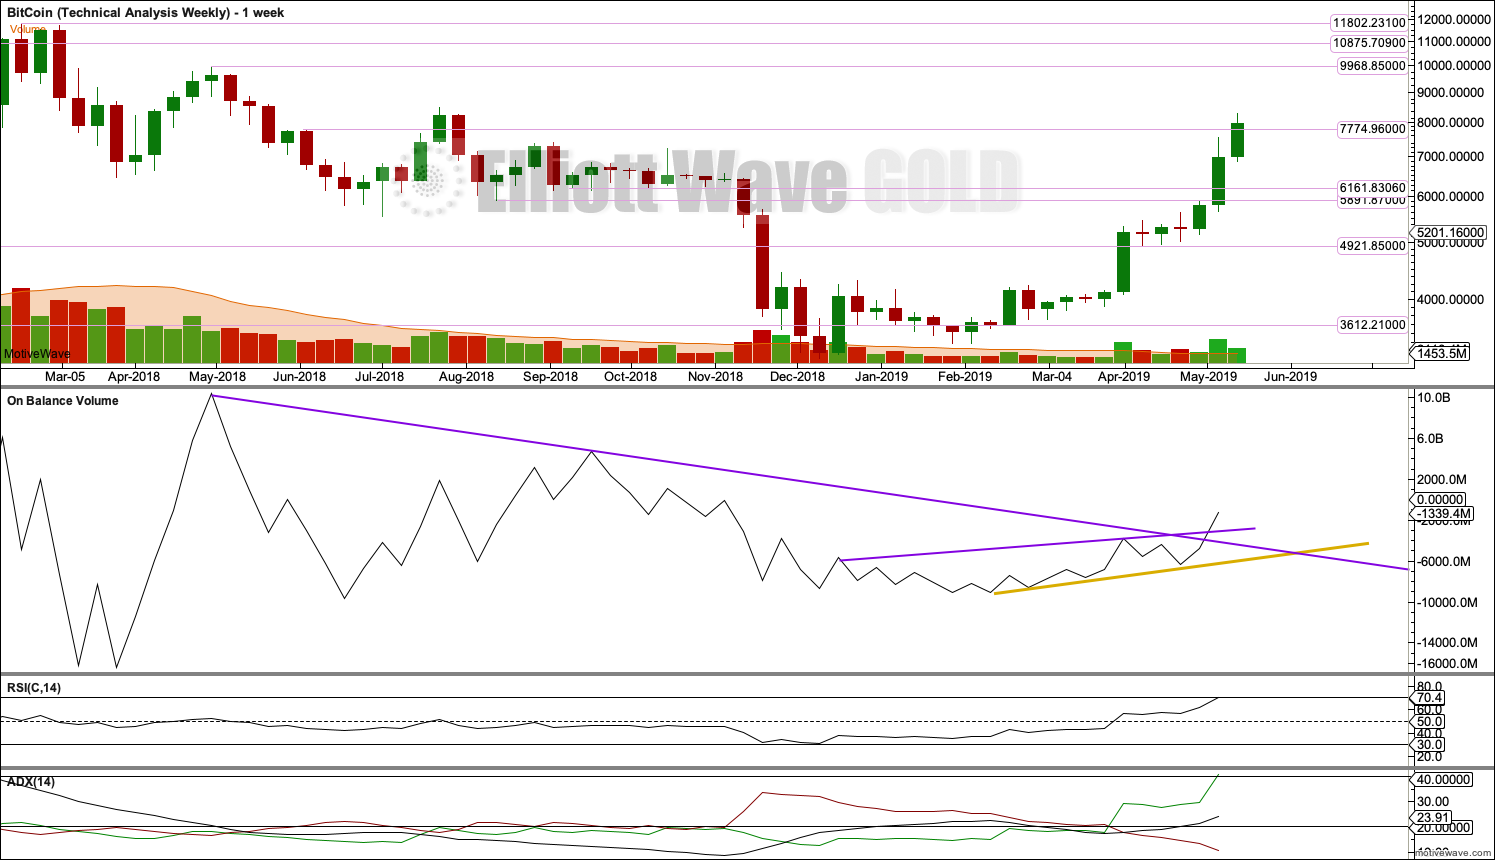
Click chart to enlarge.
The following characteristics can be noted at the end of prior major highs for Bitcoin:
The first sharp rise to the week beginning 5th June 2011: near vertical movement for several weeks, a sharp volume spike for a blow off top on the final week, and no candlestick reversal pattern on the weekly chart but an Evening Doji Star on the daily chart. The following correction was 0.94.
The next sharp rise to the week beginning 7th April 2013: near vertical movement for three weeks, a sharp volume spike on the final week that closed red and formed a Bearish Engulfing pattern on the weekly chart, a Bearish Engulfing pattern on the daily chart, ADX remained very extreme for most of the rise, and single week bearish divergence between price and RSI at the end. The following correction was 0.82.
The next sharp rise to the week beginning 24th November 2013: vertical movement for four weeks, a strong rise in volume until the last week (which saw volume fall), a Bearish Engulfing pattern on the weekly chart, an Evening Doji Star on the daily chart (the third candlestick of which had strong support from volume), ADX reached very extreme for many days, and RSI reached extreme overbought and there exhibited single bearish divergence. The following correction was 0.93.
The last sharp rise to the all time high at 19,870.62 on the 17th of December 2018: vertical movement for three weeks, a strong increase in volume up to the last week (which saw a fall in volume), a Bearish Engulfing pattern on the weekly chart that had support from volume; on the daily chart, ADX reached very extreme for a coupe of weeks or so, RSI reached overbought and there exhibited single bearish divergence, and early downwards movement from the high had support from volume. The following correction was 0.84.
Some conclusions may be drawn about how to identify a major high in Bitcoin:
– Look for vertical movement on the weekly chart for at least two weeks, and possibly up to several (although when it is more than three the movement may be interspaced with a small pause).
– Look for either a sharp volume spike for a blow off top, or a strong increase in volume then followed by a single week of lighter volume at the possible high.
– A bearish candlestick reversal pattern has been seen so far at every major high for Bitcoin, so an absence of any candlestick reversal pattern at a potential high should be viewed very suspiciously.
– ADX is of no use as it may remain very extreme for long periods of time.
– RSI may also remain very extreme for long periods of time and may not exhibit any divergence, but it may add a little confidence in the high if it does exhibit bearish divergence in conjunction with other indicators being bearish.
Price has been rising vertically for two weeks and now possibly three. Volume supports the rise in price, although on the weekly chart no conclusion may be drawn today for the last weekly volume bar as this week is incomplete. On Balance Volume has given two bullish signals in recent weeks.
At this time, it is reasonable to expect Bitcoin to continue rising, but with a vertical rise like this there is a heightened risk of a sharp fall.
There is a cluster of resistance above about 9,970 to 11,800.
DAILY
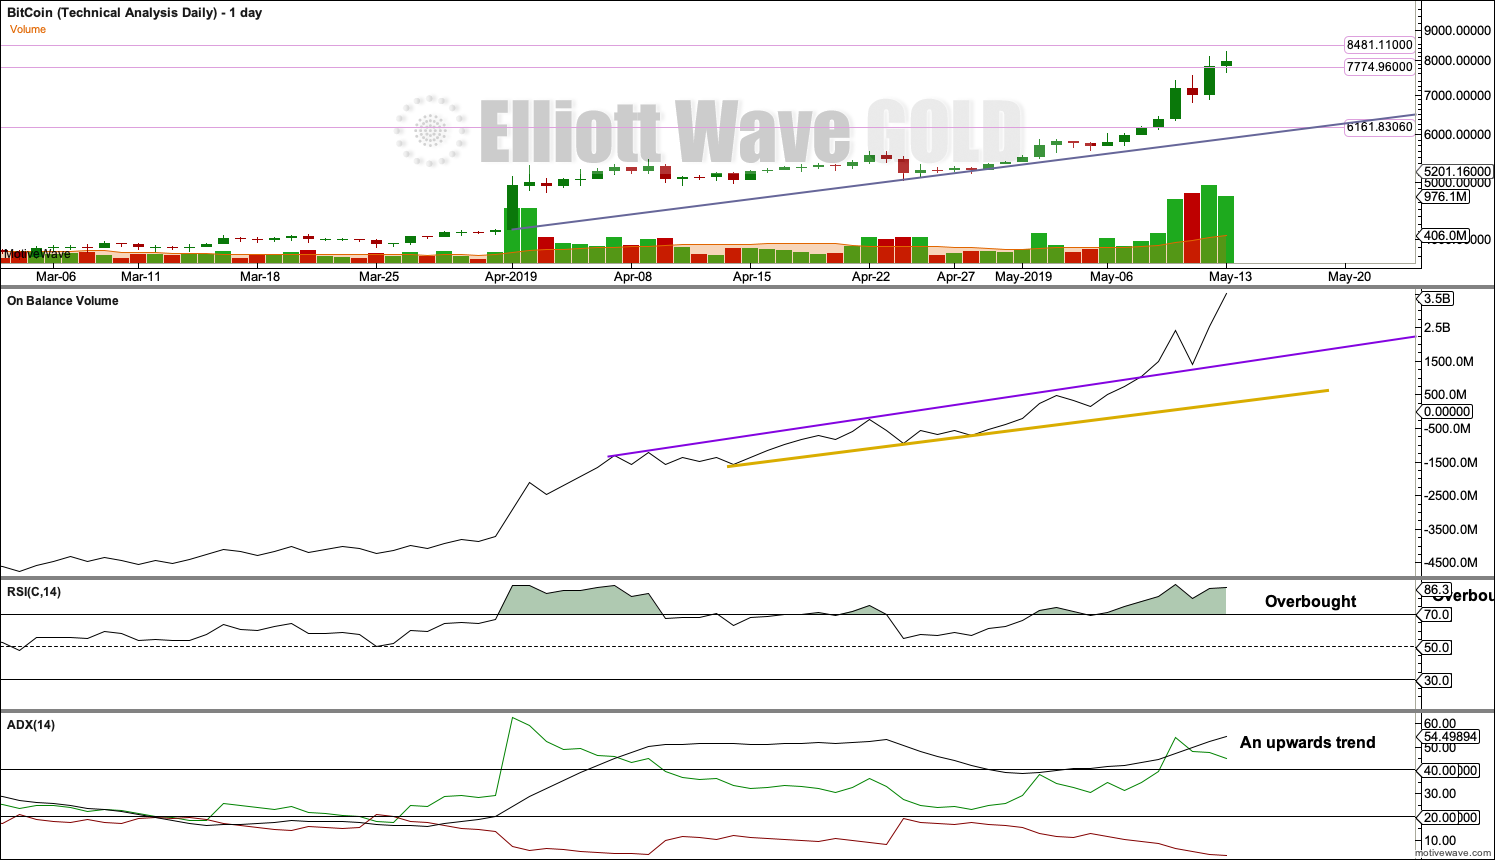
Click chart to enlarge.
There is no bearish candlestick reversal pattern yet on the daily chart. Assume the trend remains the same, upwards, until proven otherwise.
A support line is drawn for price. While price remains above this line, assume the trend remains upwards.
Original analysis published @ 02:06 a.m. EST on Elliott Wave Gold.
—
Careful risk management protects your trading account(s).
Follow my two Golden Rules:
1. Always trade with stops.
2. Risk only 1-5% of equity on any one trade.
—
New updates to this analysis are in bold.
Hi,
Looking for the S&P 500 review for May 16.
S&P 500 analysis for May 16 just published.
ABSOULTLEY INCREDIBLE ANALYSIS- Thank you for the road map Lara!
Oh… thanks!
Nice to have some positive feedback.
I’m looking forward to throwing some $$ at this when the opportunity is right
I agree, Lara. Thank you! I appreciate these little extras from time to time. Not sure I want to trade BTC, but it’s really good to see your analysis of it.