
Summary: Currently, there is a high risk of either a deeper pullback or a large time consuming consolidation. Conditions are extreme and there is some weakness.
However, there is an upwards trend that should be assumed to remain intact while the last swing low at 6,181.10 remains intact. If price makes a new low below this point, then this analysis would shift from tentatively bearish to fully bearish.
ELLIOTT WAVE COUNTS
FIRST WAVE COUNT
MONTHLY CHART
Click chart to enlarge.
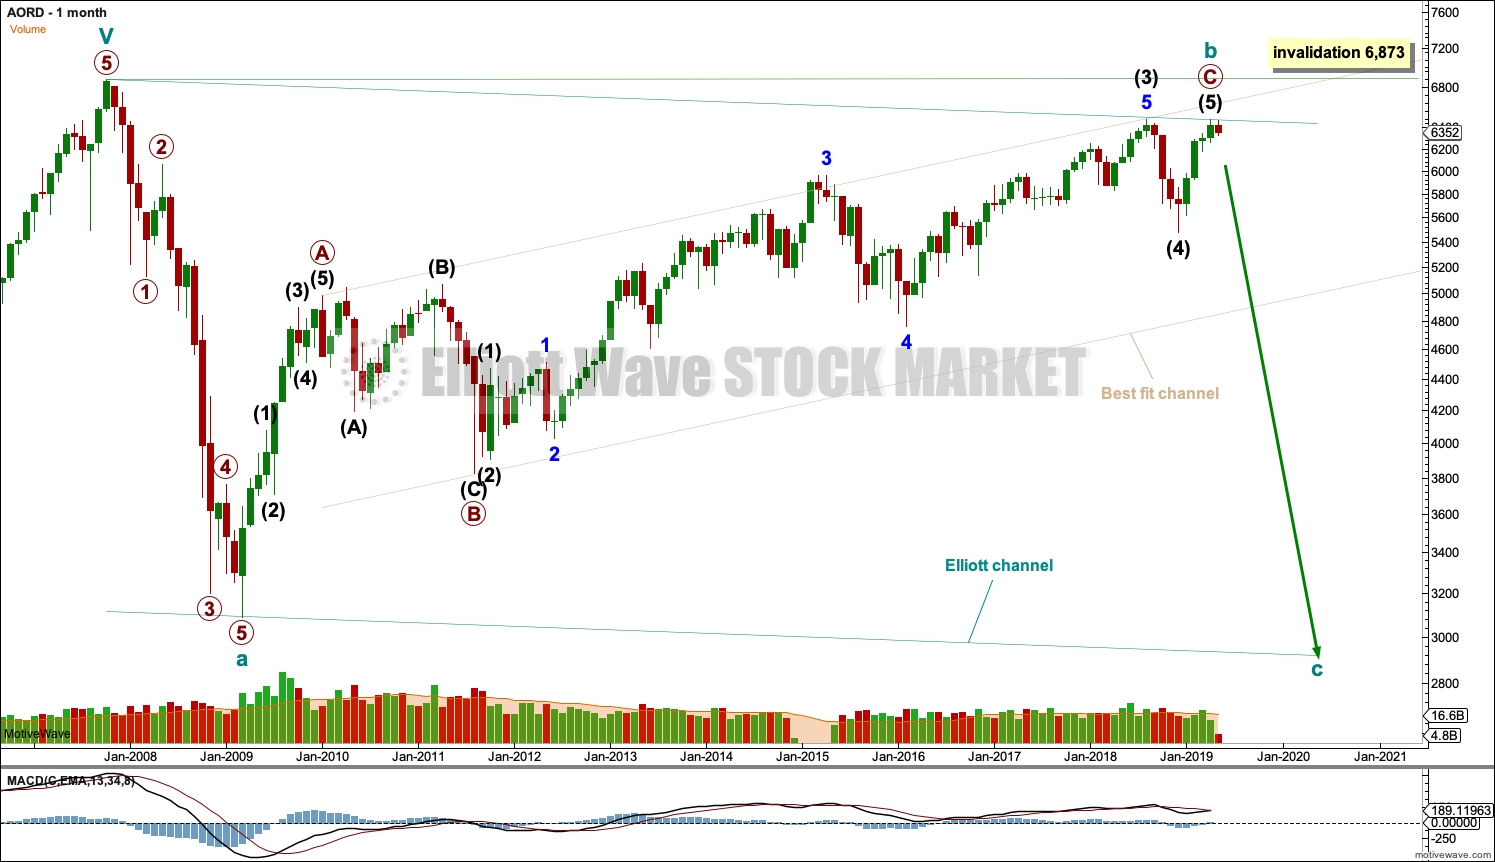
The basic Elliott wave structure (in a bull market) is five waves up followed by three waves back.
This first wave count sees the larger picture as five waves up complete at the high in October 2007 and now price may be within a very large three waves back.
Within the three back, waves a and b may be complete. Wave c at cycle degree may unfold and would most likely make at least a slight new low below wave a at 3,091 to avoid a truncation.
The Elliott wave corrective structure here is a zigzag, which subdivides 5-3-5 and is the most common type of Elliott wave correction. Within the zigzag, cycle wave b may not move beyond the start of cycle wave a above 6,873.
SECOND WAVE COUNT
MONTHLY CHART
Click chart to enlarge.
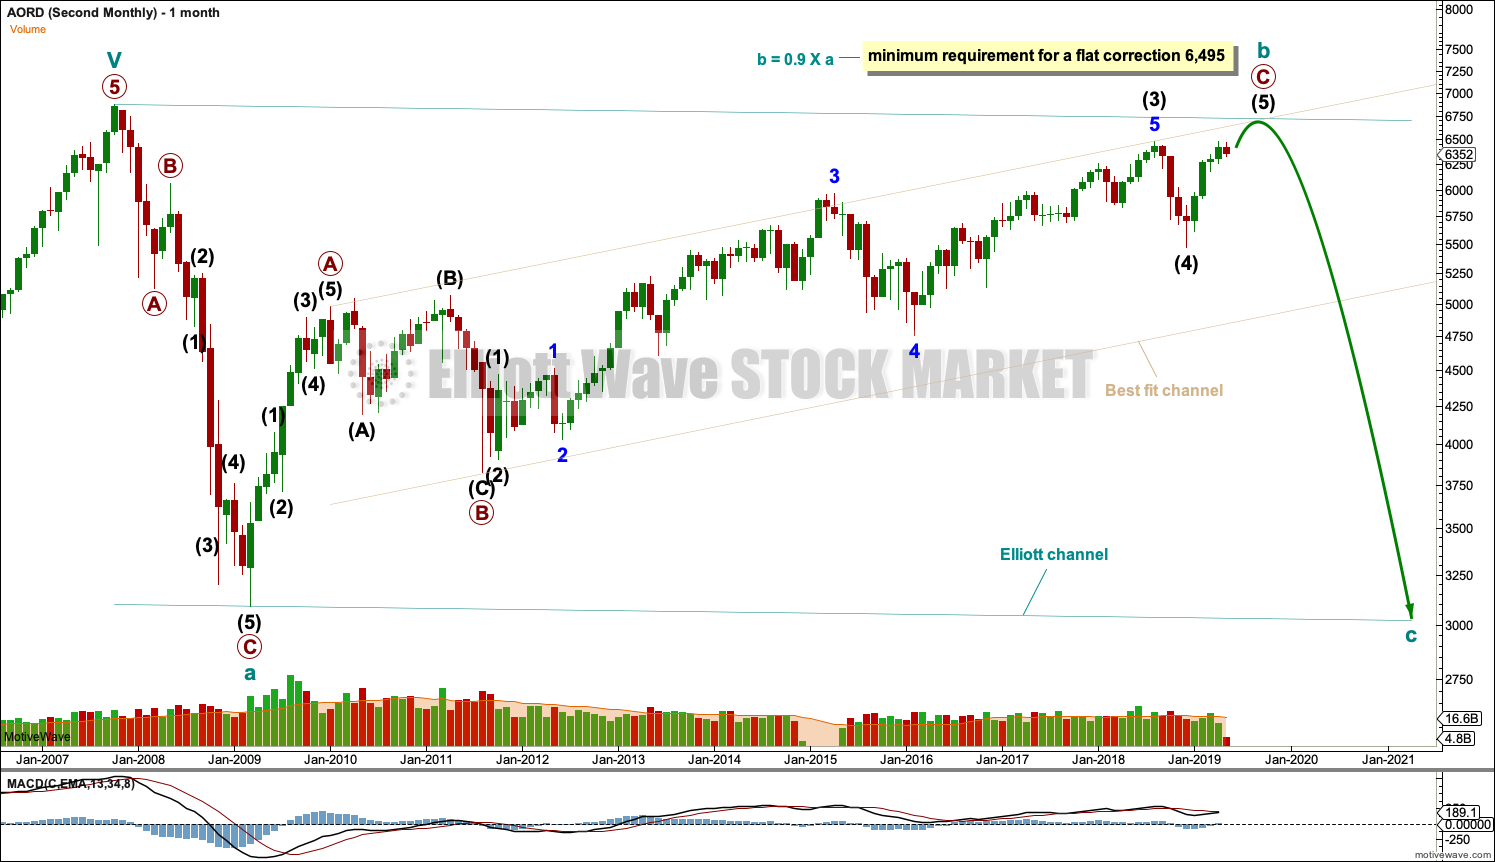
This wave count also sees price currently in a three wave corrective structure, but the structure is different. This wave count considers the possibility of a large flat correction unfolding.
Within a flat correction, wave a subdivides as a three and wave b must retrace a minimum 0.9 length of wave a. Wave b may make a new price extreme beyond the start of wave a as in an expanded flat. There is no upper invalidation point for this wave count for this reason.
When wave b is complete, then wave c would be very likely to make at least a slight new low below the end of wave a at 3,091 to avoid a truncation.
THIRD WAVE COUNT
MONTHLY CHART

Click chart to enlarge.
This wave count moves the degree of labelling all up one degree within the large fall in price from October 2007 to March 2009, and considers the possibility that it was a completed three steps back.
If a bull market is continuing for AORD, then it may be unfolding as an impulse. Within the impulse, cycle waves I, II and III may be complete. Cycle wave IV may not move into cycle wave I price territory below 4,984.
The channel is drawn using Elliott’s technique. If cycle wave IV continues sideways, then it may find support about the lower edge of the channel.
TECHNICAL ANALYSIS
VOLUME – DAILY CHART
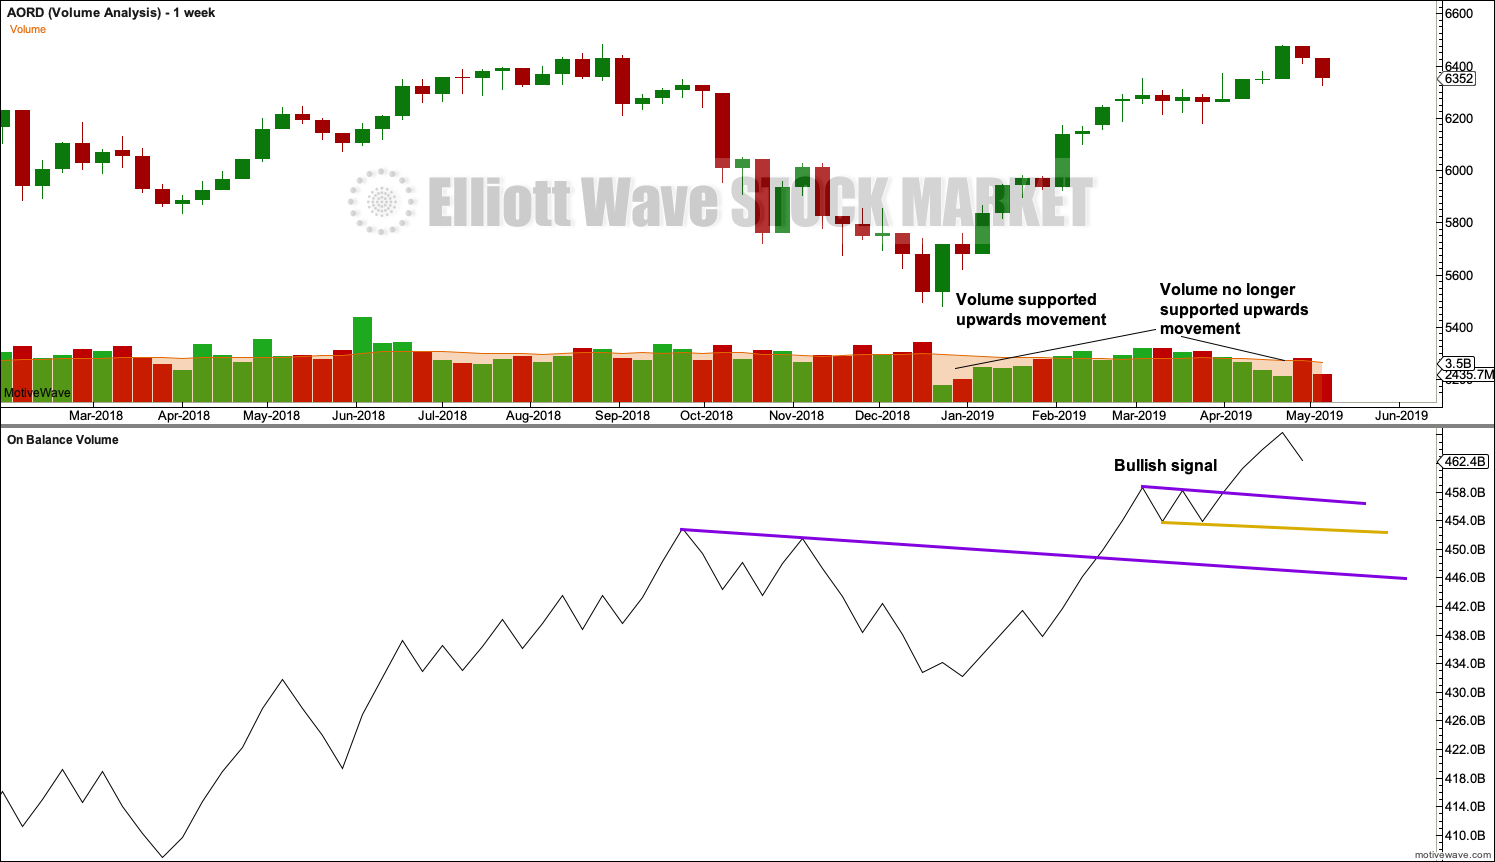
Click chart to enlarge.
The short-term volume profile is bearish.
DAILY CHART
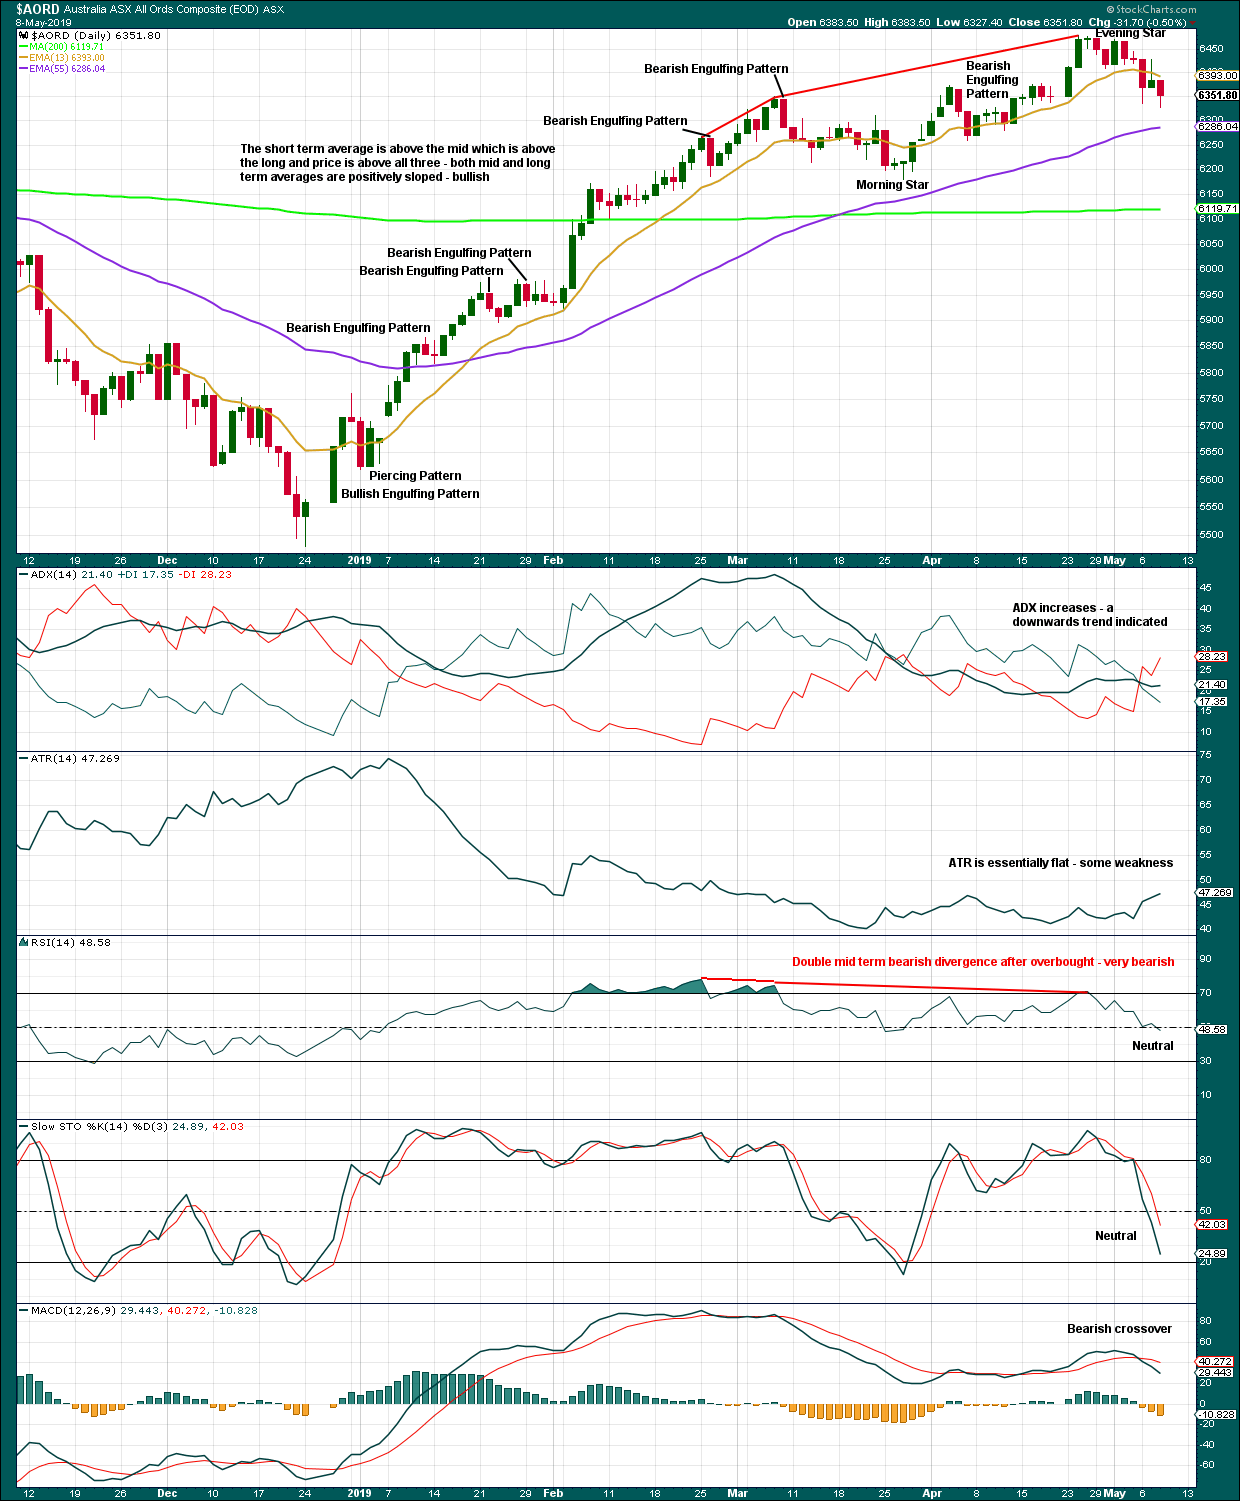
Click chart to enlarge. Chart courtesy of et=”_blank”>StockCharts.com.
From the low on 24th December 2018, price has made a series of higher highs and higher lows. This upwards trend may be assumed to remain intact until a lower low is seen. The last swing low that would need to be exceeded in this view would be the low at 6,181.10 on the 27th of March 2019.
This trend reached very extreme on the 13th of February as ADX moved above both directional lines. Thereafter, the trend continued as very extreme while RSI reached overbought and then exhibited double clear bearish divergence with price. This taken together is very bearish. There may currently be a high risk of a deeper pullback.
This view could fit either Elliott wave count: It could fit the first two very bearish wave counts, or extreme conditions may be relieved by a large consolidation which may last several months for the third wave count.
Published @ 4:48 a.m. EST.
—
Careful risk management protects your trading account(s).
Follow my two Golden Rules:
1. Always trade with stops.
2. Risk only 1-5% of equity on any one trade.
—
New updates to this analysis are in bold.
This is pretty cool, thanks for this. A family member has a super fund in Oz which is quite restrictive in what you can buy (basically just long ASX stocks), so it’s good to know what state the AORD is in.
Lara,
You posted the wrong file, AORD?
I don’t know what you mean.
The Elliott wave analysis uses AORD data from Yahoo Finance, and the technical analysis uses AORD data from StockCharts.
I chose to use AORD data rather than ASX200 because StockCharts don’t have ASX200.
Looking for the S&P 500 (US) file for May 9th.
Okay… it’s not here. It’s in the post for the S&P500.