
The very short-term analysis on the hourly chart expected a little downwards movement for Thursday, which is what has happened.
Summary: The upwards trend remains intact and there is underlying strength in this market still. The next mid-term target is at 3,010. However, some near-term caution may be warranted due to strong resistance and now a cluster of bearish signals from VIX.
The final target remains the same at 3,045. Alternate monthly wave counts allow for a target as high as 4,119.
New updates to this analysis are in bold.
The biggest picture, Grand Super Cycle analysis, is here.
Monthly charts were last published here. Video is here.
ELLIOTT WAVE COUNTS
MAIN WAVE COUNT
WEEKLY CHART
Click chart to enlarge.
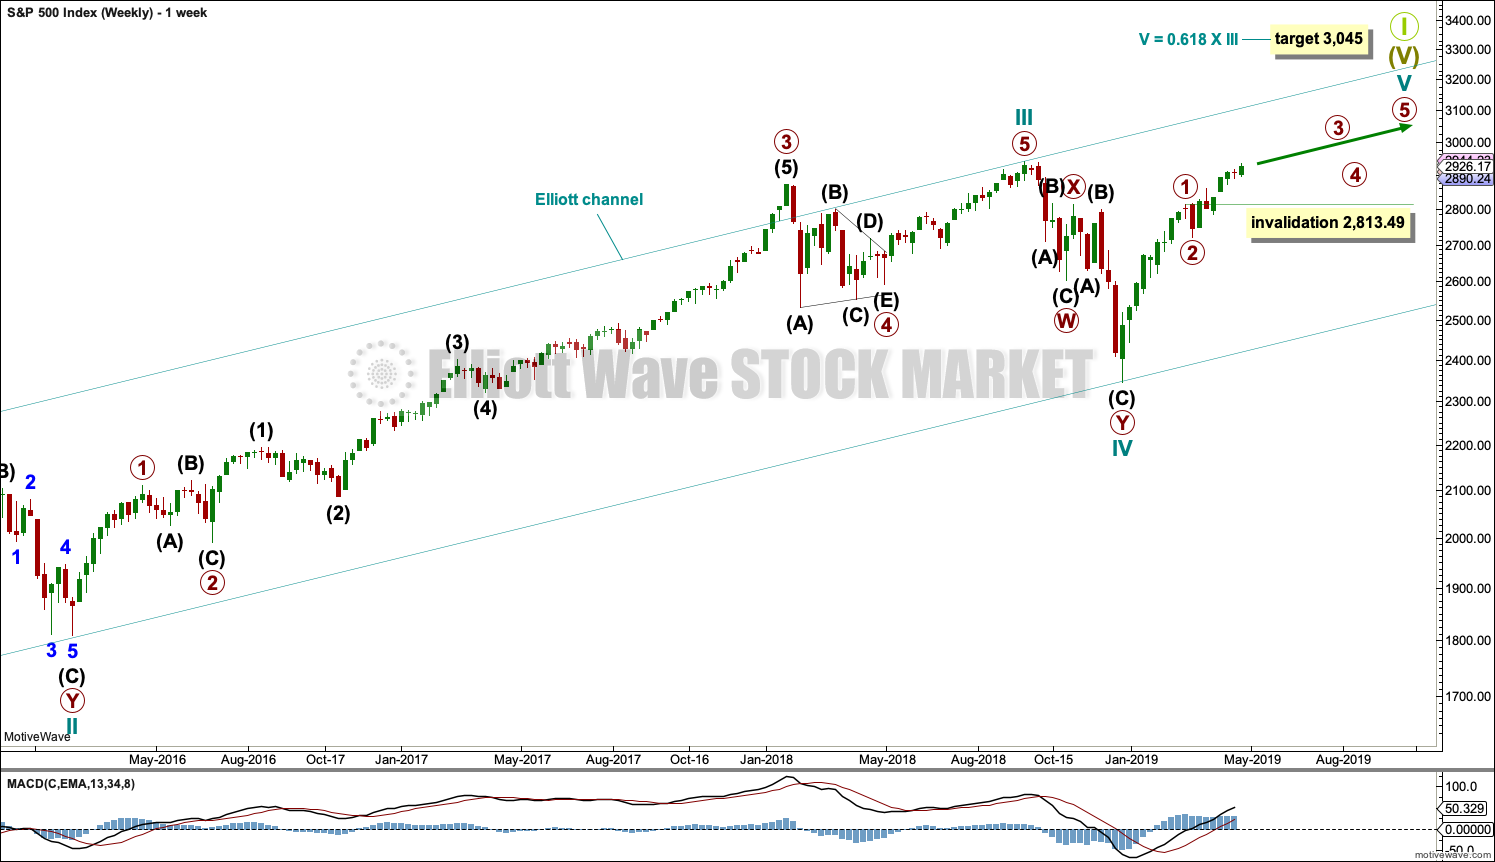
This weekly chart shows all of cycle waves III, IV and V so far.
Cycle wave II fits as a time consuming double combination: flat – X – zigzag. Combinations tend to be more time consuming corrective structures than zigzags. Cycle wave IV has completed as a multiple zigzag that should be expected to be more brief than cycle wave II.
Cycle wave IV may have ended at the lower edge of the Elliott channel.
Within cycle wave V, primary waves 1 and 2 may now be complete. Primary wave 3 has moved above the end of primary wave 1. When it arrives, primary wave 4 may not move into primary wave 1 price territory below 2,813.49.
Although both cycle waves II and IV are labelled W-X-Y, they are different corrective structures. There are two broad groups of Elliott wave corrective structures: the zigzag family, which are sharp corrections, and all the rest, which are sideways corrections. Multiple zigzags belong to the zigzag family and combinations belong to the sideways family. There is perfect alternation between the possible double zigzag of cycle wave IV and the combination of cycle wave II.
Although there is gross disproportion between the duration of cycle waves II and IV, the size of cycle wave IV in terms of price makes these two corrections look like they should be labelled at the same degree. Proportion is a function of either or both of price and time.
Draw the Elliott channel about Super Cycle wave (V) with the first trend line from the end of cycle wave I (at 2,079.46 on the week beginning 30th November 2014) to the high of cycle wave III, then place a parallel copy on the low of cycle wave II. Cycle wave V may find resistance about the upper edge.
It is possible that cycle wave V may end in October 2019. If it does not end there, or if the AD line makes new all time highs during or after June 2019, then the expectation for cycle wave V to end would be pushed out to March 2020 as the next possibility. Thereafter, the next possibility may be October 2020. March and October are considered as likely months for a bull market to end as in the past they have been popular. That does not mean though that this bull market may not end during any other month.
DAILY CHART
Click chart to enlarge.
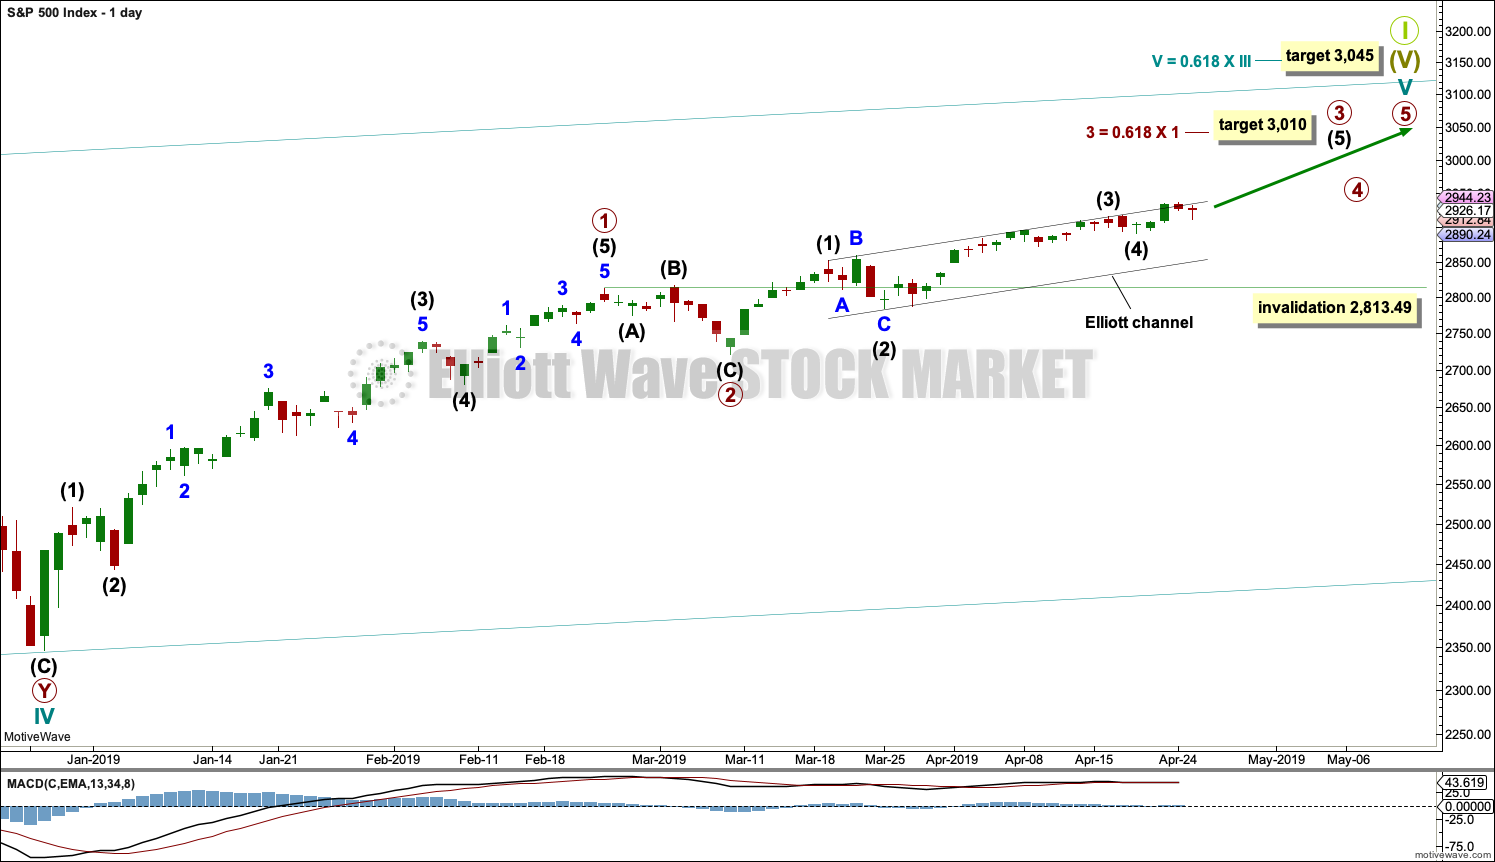
The daily chart will focus on the structure of cycle wave V.
Cycle wave V must subdivide as a five wave motive structure, either an impulse or an ending diagonal. An impulse is much more common and that will be how it is labelled. A diagonal would be considered if overlapping suggests it.
Primary wave 2 may have been a very brief and shallow expanded flat correction.
Within primary wave 3, intermediate waves (1) through to (4) may be complete. Intermediate wave (5) to end primary wave 3 may end soon or may yet continue to extend. When it is complete, then primary wave 3 may be complete.
Primary wave 4 may not move into primary wave 1 price territory below 2,813.49.
HOURLY CHART
Click chart to enlarge.
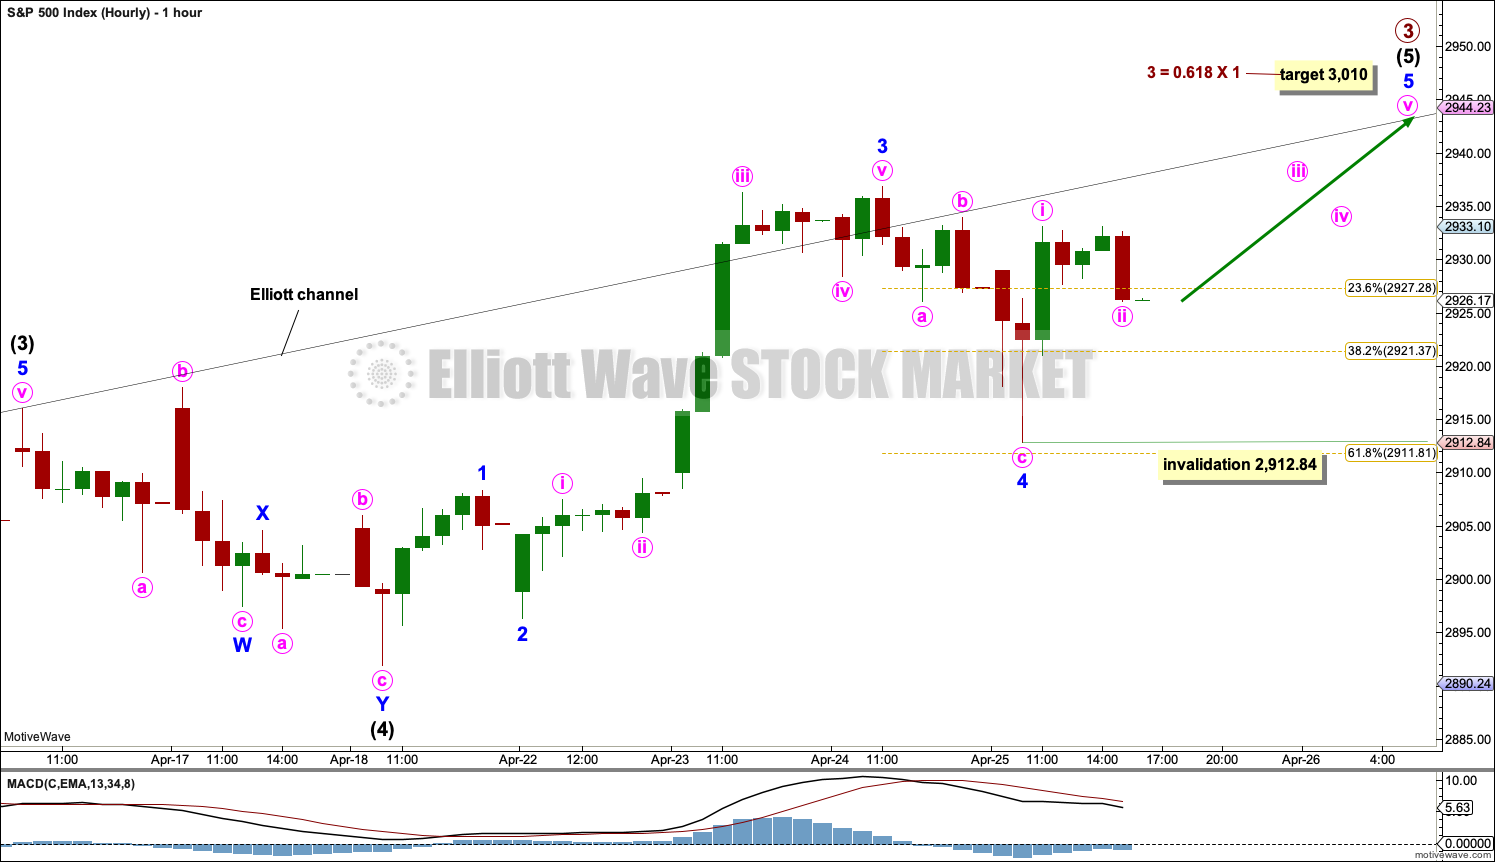
Intermediate wave (5) may be unfolding as an impulse, which is the most common structure for a fifth wave.
It is also possible to move the degree of labelling within intermediate wave (5) all down one degree. It is possible that only minor wave 1 within intermediate wave (5) is near an end.
However, the strength of upwards movement that overshot the upper edge of the black Elliott channel looks very much like a third wave, so this labelling looks most likely.
So far minor waves 1 through to 4 within intermediate wave (5) may all be complete. Minor wave 3 is just 2.7 points short of 2.618 the length of minor wave 1. With a Fibonacci ratio already between two of the three actionary waves within intermediate wave (5), minor wave 5 may not exhibit a Fibonacci ratio to either of minor waves 1 or 3. The target calculation will be left at primary degree.
Minor wave 5 may be an extension. So far minute wave ii within minor wave 5 shows up clearly on the hourly chart, suggesting a more time consuming impulse for minor wave 5. Within minor wave 5, minute wave ii may not move beyond the start of minute wave i below 2,912.84.
FIRST ALTERNATE WAVE COUNT
WEEKLY CHART
Click chart to enlarge.
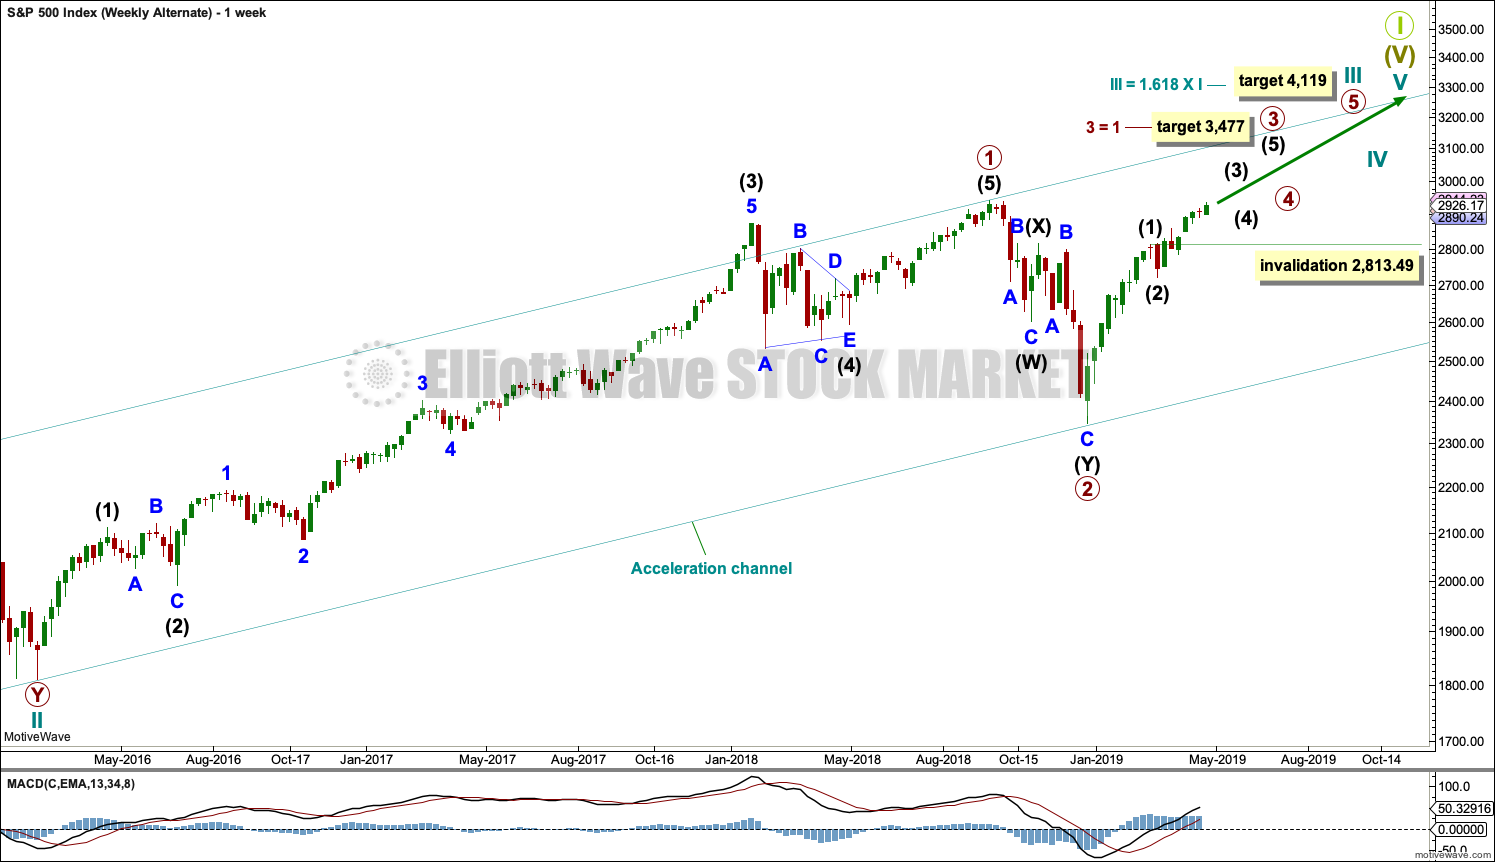
This weekly chart is identical to the main wave count up to the end of cycle wave II. Thereafter, the degree of labelling is moved down one degree.
Cycle wave III may be an incomplete impulse.
The target for cycle wave III expects it to exhibit the most common Fibonacci ratio to cycle wave I.
Within cycle wave III, only primary waves 1 and 2 may be complete.
Within primary wave 3, only intermediate waves (1) and (2) may be complete. Intermediate wave (3) has now moved beyond the end of intermediate wave (1). When it arrives, intermediate wave (4) may not move into intermediate wave (1) price territory below 2,813.49.
This wave count now expects very strong upwards movement just ahead as a third wave at three large degrees unfolds.
TECHNICAL ANALYSIS
WEEKLY CHART
Click chart to enlarge. Chart courtesy of et=”_blank”>StockCharts.com.
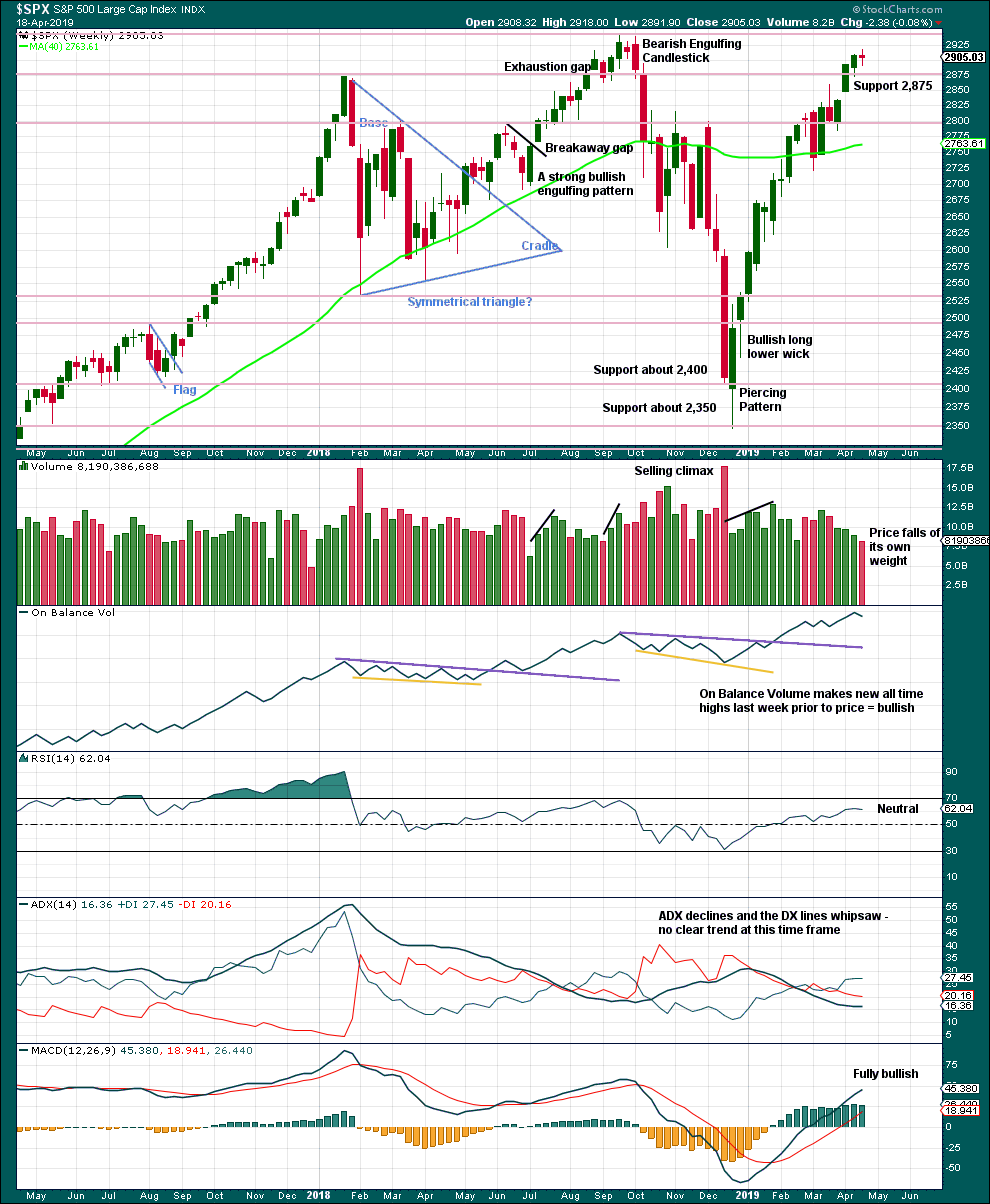
Resistance about 2,880 has been overcome. Next resistance is about the prior all time high about 2,940.
On Balance Volume makes another new all two weeks ago strongly supporting the Elliott wave count.
A decline in volume while price moves higher is not of concern given current market conditions. This has been a feature of this market for a long time and yet price continues higher.
Last week moved price higher, but the candlestick closed red and the balance of volume was downwards. With a short trading week, it would be best to look inside the week at daily volume bars to judge the short-term volume profile. Overall, this chart remains bullish and supports the Elliott wave count.
DAILY CHART
Click chart to enlarge. Chart courtesy of StockCharts.com.
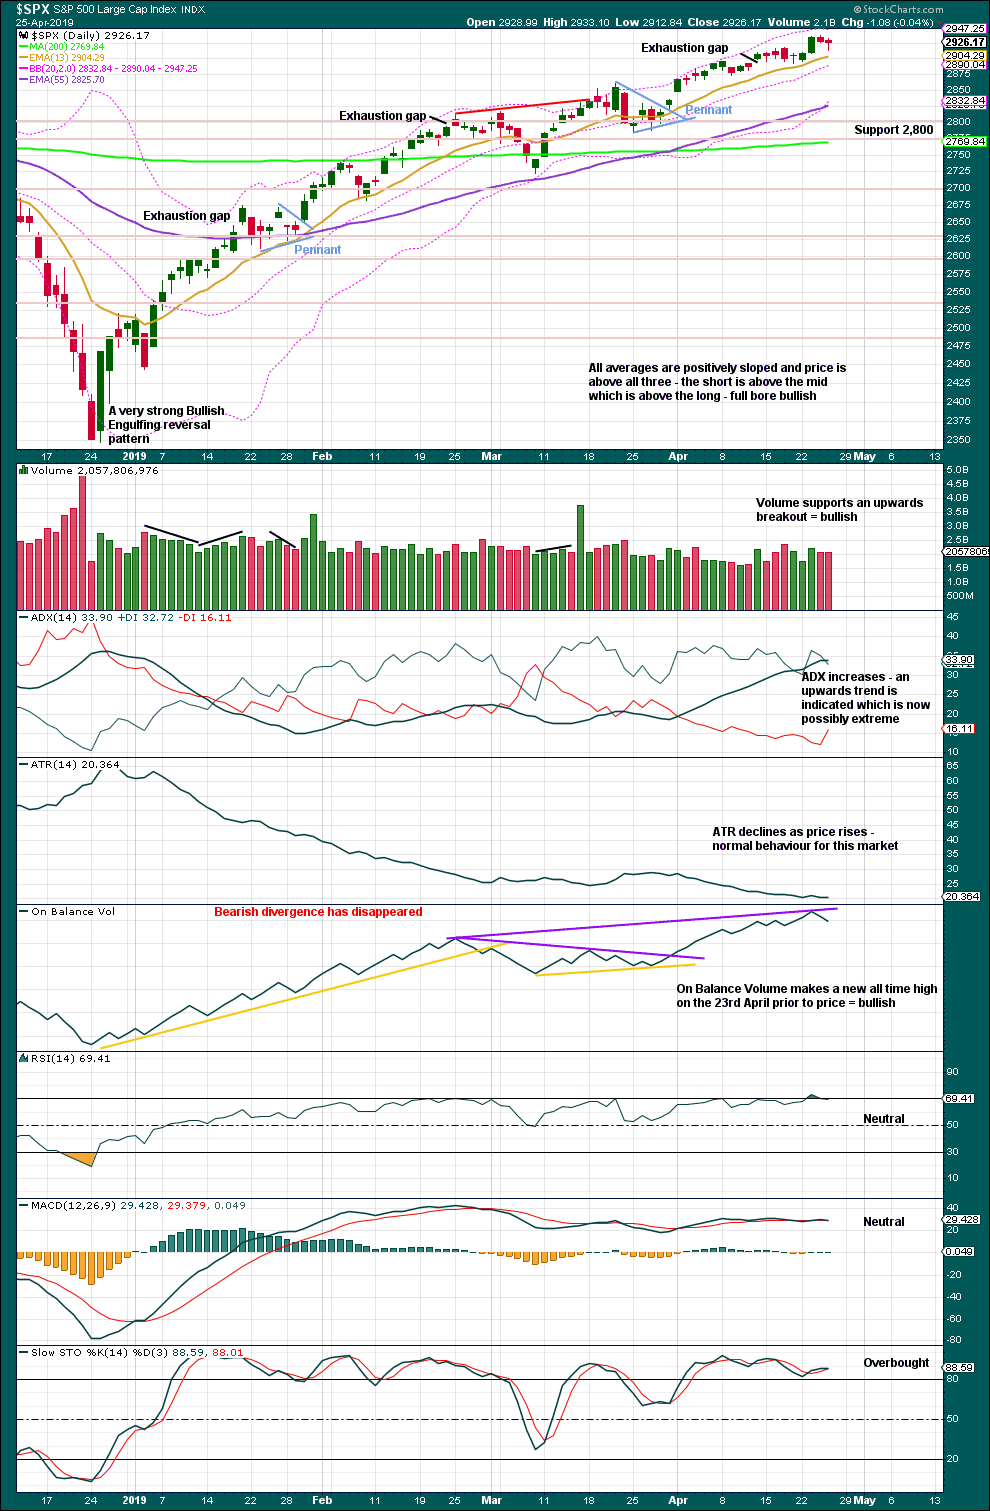
The December 2018 low is expected to remain intact. The two 90% upwards days on 26th December 2018 and 6th January 2019 indicate this upwards trend has internal strength.
Lowry’s data shows that on the 8th of April Selling Pressure has reached another new low for this bull market, and Buying Power has reached a new high for this rally. This indicates an expansion in demand and a contraction in supply, which has historically been associated with strong phases of bull markets. This strongly supports the Elliott wave count, which expects new all time highs to come this year.
While the last swing low of the 25th of March remains intact, there exists a series of higher highs and higher lows from the major low in December 2018. It would be safest to assume the upwards trend remains intact. ADX agrees.
Overall, this chart remains very bullish. The trend again today now possibly extreme and RSI has only just reached into overbought yesterday. There is still room for price to continue higher. Some strong resistance about the last all time high at 2,940.91 may be expected; this may be about where a more time consuming consolidation or deeper pullback may arrive.
The resistance line on On Balance Volume has been redrawn. It was no longer showing where On Balance Volume found resistance or support.
BREADTH – AD LINE
WEEKLY CHART
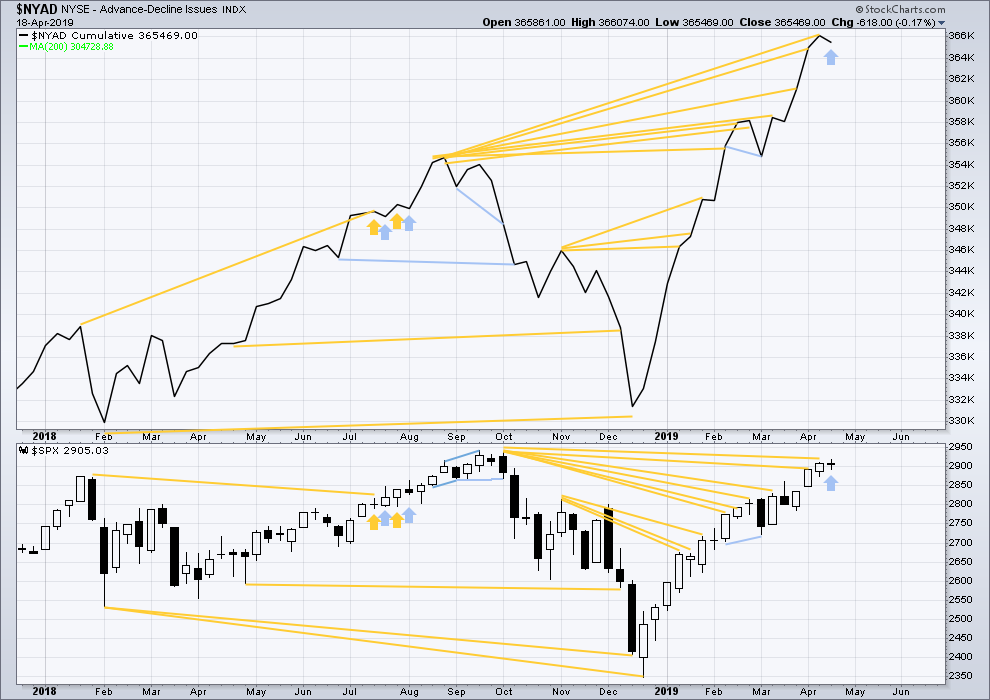
Click chart to enlarge. Chart courtesy of StockCharts.com. So that colour blind members are included, bearish signals
will be noted with blue and bullish signals with yellow.
Every single bear market from the Great Depression and onwards has been preceded by a minimum of 4 months divergence between price and the AD line. With the AD line making a new all time high again in April, the end of this bull market and the start of a new bear market must be a minimum of 4 months away, which is the end of August 2019 at this time.
Last week the AD line moves lower while price moves higher. This divergence is bearish for the short term.
Mid and large caps have both made new highs above the swing high of the 25th of February, but small caps have not. However, small caps AD line has made a new all time high on the 12th of April indicating broad strength underlying this market.
DAILY CHART
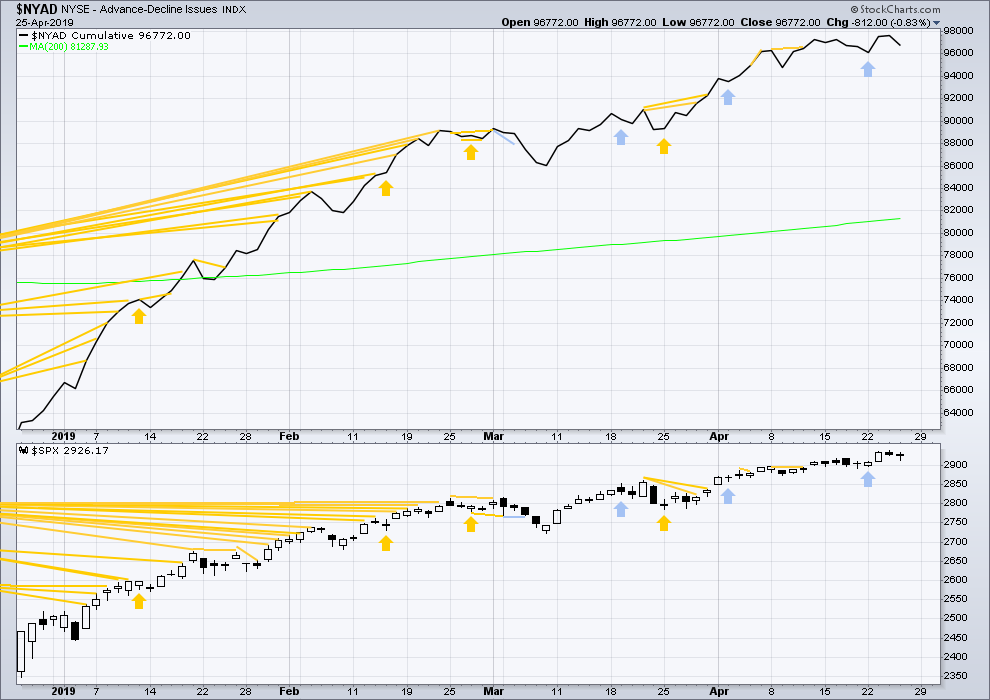
Click chart to enlarge. Chart courtesy of StockCharts.com. So that colour blind members are included, bearish signals
will be noted with blue and bullish signals with yellow.
Breadth should be read as a leading indicator.
Both price and the AD line moved lower today. Downwards movement has support from declining market breadth, but breadth is not declining any faster than price. There is no short-term divergence.
VOLATILITY – INVERTED VIX CHART
WEEKLY CHART
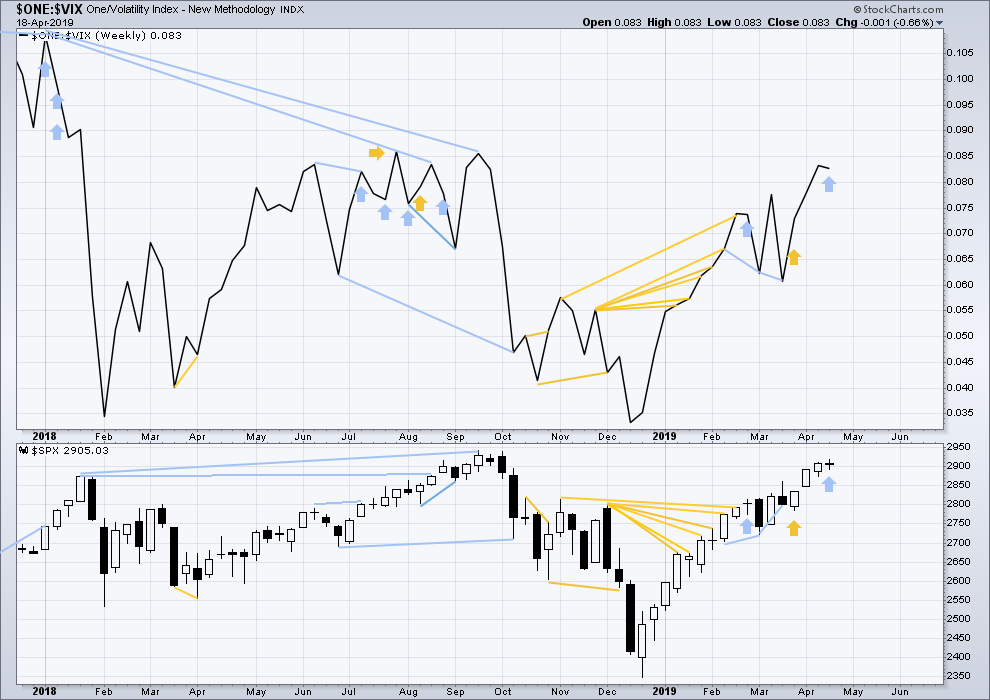
Click chart to enlarge. Chart courtesy of StockCharts.com. So that colour blind members are included, bearish signals
will be noted with blue and bullish signals with yellow.
Last week price moved higher, but inverted VIX moved lower. Upwards movement did not come with a normal corresponding decline in VIX. With VIX increasing, this divergence is bearish.
DAILY CHART
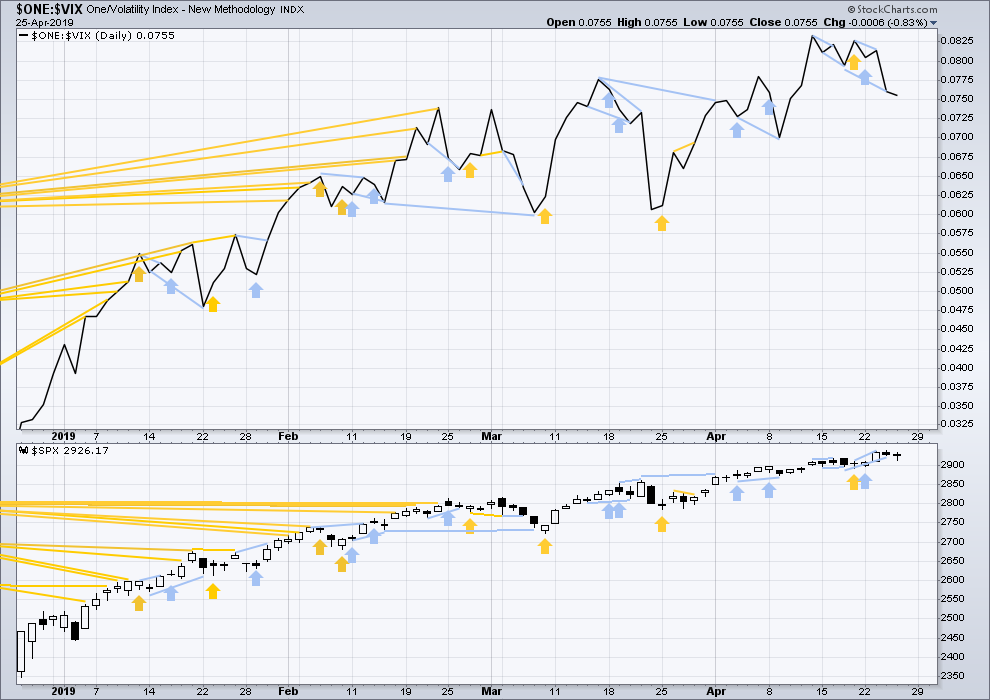
Click chart to enlarge. Chart courtesy of StockCharts.com. So that colour blind members are included, bearish signals
will be noted with blue and bullish signals with yellow.
Inverted VIX has moved lower to make another new swing low below the prior low of the 17th / 18th of April, although today the decline in inverted VIX as not as steep as yesterday. There is now a cluster of bearish signals from inverted VIX suggesting near-term caution is warranted.
DOW THEORY
Dow Theory confirmed a bear market in December 2018. This does not necessarily mean a bear market at Grand Super Cycle degree though; Dow Theory makes no comment on Elliott wave counts. On the 25th of August 2015 Dow Theory also confirmed a bear market. The Elliott wave count sees that as part of cycle wave II. After Dow Theory confirmation of a bear market in August 2015, price went on to make new all time highs and the bull market continued.
DJIA: 23,344.52 – a close on the 19th of December at 23,284.97 confirms a bear market.
DJT: 9,806.79 – price has closed below this point on the 13th of December.
S&P500: 2,532.69 – a close on the 19th of December at 2,506.96 provides support to a bear market conclusion.
Nasdaq: 6,630.67 – a close on the 19th of December at 6,618.86 provides support to a bear market conclusion.
With all the indices moving now higher, Dow Theory would confirm a bull market if the following highs are made:
DJIA: 26,951.81
DJT: 11,623.58
S&P500: 2,940.91
Nasdaq: 8,133.30.
Published @ 06:26 p.m. EST.
—
Careful risk management protects your trading account(s).
Follow my two Golden Rules:
1. Always trade with stops.
2. Risk only 1-5% of equity on any one trade.
Hourly chart updated:
The middle of a little third wave may have created the new high today. Still not quite a new all time high, that may now have to wait until next week.
Looking for SPX to break out of this multi-hour Darvas box, just like the break from a very similar price box earlier this week (Monday -> Tuesday). Hourly chart here.
Market internals are rather consistently strong today (SPX), but not much price movement upward. Giving more weight to the potential of a surge upward if 2932.5 (high of the day/top of that darvas box) is broken through.
…AND if our short term count is correct, price should be getting real close to iii up action here…but maaaaaaaaybe the iv isn’t over?
With oil companies crashing today, can it happen?
what a drag!
oil turning
S&p going like ol orville redenbocker with or without crude support
It broke through…now retesting…
As I said…wham bam, breakthough!!! And a pretty big shove up.
Wed I went short oil…… anyone have a destination?
Good play Peter S. If you are on Lara’s weekly or Gold/Oil service, you will know that as the current up wave concludes, it has a long way to fall especially long term. I certainly would welcome lower gasoline prices soon. I need to fill up the 80 gallon tank on my motorhome!
I was watching earlier, price was still in the big up channel.
But not now. I have it busting through at about 63.2.
First question is, does price (a) drop away fast, or (b) consolidate under the lower channel line, then drop away, or (c) move back up and into the channel?
Given the strength overall of this multi-month up move, I’m not hot to trot to the short side here yet. The daily chart shows price just now moving on top of the 21 period EMA. There have been multiple tags and turns of that in this run up. Then just a little ways below is a strong combination of resistance elements: there’s a confluence of the variance band (the lower purple line, based on Bollinger bands and Keltner channels), and the 200 day MA (red line). That support is around 60.8 (/CL). The daily trend is only at neutral (any lower it will move to down though).
I also not that price broke the big 62% retrace level to the up side, but hasn’t reached the 78.6% area (69.5). That increases my suspicion about this as a change in monthly/weekly trend. Maybe nyet.
So in my current view, that 60.8 area might be a good place to start consider longs, on appropriate buy triggers.
I will consider this 5 month uptrend definitely over when the last significant swing low is busted at 54.5. I can convince myself that I’d rather wait for a trend to clearly assert itself, then buy/sell the pullbacks, rather than try to guess if a strong trend in one direct has no changed. “Assume the trend remains the same…” which implies a general recommendation of “trade established trends”. Vs. possible changes in trend.
Just some Friday thoughts flowing out my fingers, I could be full of the proverbial stuff.
Here’s the chart, CL daily at 1:41pm EDT.
I revise one thing there: there’s a higher swing low on the daily at 58.14. If that falls, I would say definitively the multi-month up move is complete and a down leg is underway.
And to answer your question Peter, I’d say a likely “destination” where you might want to cash some (or all) is any price under 61.
I took the profits and ran.. like Verne says, never give it back
The May TASC magazine is out with my article in it (starting to get some email inquiries from readers). The only place in my area that carries it is Barnes and Noble, buried in their massive magazine rack. If anyone wants it and doesn’t want to pay $8…write me at zinc1024 at the gmail place and I’ll send you a pdf, but warning, working back and forth between charts and text in a PDF isn’t a very good UI experience! It’s actually easier with paper.
Congratulations Kevin. That is awesome. It is really neat to be a friend of a famous author, not to mention musician!
And a very hearty Congratulations from me too Kevin.
Printing the article out would be pretty easy, and agreed, easier to read through on paper.
And a very clever article and method it is you’ve developed there.
To members: I do highly recommend reading it, you’ll then be able to visually see on the charts Kevin posts what the indicator is showing.
This is /RTY, the Russell 2000 futures market data, 4 hour, including overnight.
The ellipses show what I view as very similar structures. After the first one…a week+ of a consistently rising market. This time…we’ll see.
Thanks Kevin. I certainly hope your view materializes into similar results.
They are shadow banning me below…
https://smartgridawareness.org/agenda-21-and-sustainability/planned-extinction-of-the-american-dream/
What does ‘shadow banning’ mean? And who would be ‘They’?
It means I can see what I posted, but no-one else can.
This system!
USA GDP #’s out this morning for the 1st Quarter of 2019…
2.50% or lower were the estimates from Fed, Bankers, Globalists & Economists educated in the last 30 Years!
Actual 3.20%… I will make no further comments! Old timers here know the truth!
Outstanding! I believe we have an economic boom just beginning that will compare favorably to the Reagan economic boom which lasted well into the 90’s. They said it couldn’t be done, that economic principles and conditions had changed. Yet, today we are seeing GDP numbers we haven’t seen in a generation. The US has been economically stuck since 9-11-2001. It feels good. I hope most Americans and world citizens can feel good and positive about it.
GDP measures one thing. GDP can be rising while average living conditions can be falling, poverty can be increasing, the middle class shrinking, medical care can be too costly for most with outcomes that are far worse than the rest of the industrialized world that provides medical care to all citizens without parasitic insurance companies in the middle, debt/deficits can still be soaring, physical infrastructure rotting, and the citizens generally pillaged by unrestrained corporate greed via deregulation enabling gross fraud, pollution, and many other misbehaviors (such as grossly lack security controls). GDP growth is promoted as the be-all end-all economic indicator, and it is far from that IMO. Oh yes, jobless rates can be falling to extreme lows too…except the gov’t can conveniently not count anyone not employed for the last 6 months (they just “disappear”), and the jobs available can be crap super low wage jobs with no benefits. All can be. I don’t want to debate if/to what degree any of these are the situation in the US.
That all said, none of that will impact an “economic boom” that drives GDP up and generally stock prices up. That’s all nice. But it doesn’t really mean per se the country is doing well, is my point.
A continuation of the Economic Policies that have been implemented in last 2 years and to be implemented next 3 years (as Job not done yet due to obstructionists) will eliminate all the issues you describe over 10 years!
What caused the middle class shrinking were the Globalist policies that were put in place over time. The Goal of the Globalists were clearly stated by the UN … To eliminate the Middle Class in the USA!!! The people who helped bring this about should all be thrown out of the USA for good!
This is the Truth… the silent truth… These are the policies to CRUSH the US Middle Class… Wake Up! Follow all the links the Docs have been preserved… the UN took down there Link to the Official Docs…
http://agenda21docs.com/2013/12/agenda-21/
By the way… here is the complete plan through pages of the Agenda 21 Doc… Video Clips and other links to the evidence of the Plan to Crush the US Middle Class and they almost succeeded in doing so except for late 2016, 2017, 2018 2019 and hopefully the next 6 years! Time to CRUSH them for Good! Wake Up!!!
Their Plan CanNOT succeed without eliminating the US Middle Class!
https://smartgridawareness.org/agenda-21-and-sustainability/planned-extinction-of-the-american-dream/
Kevin, you make a point worth considering. Rising GDP and other economic indicators may not necessarily indicate the improvement of life for the average citizen especially the poor and destitute. However, without rising GDP and other economic indicators it is virtually impossible to make the needed changes to help the average citizen, poor and destitute.
As a former businessman the first 25 years of my adult live (I was part owner of four large commercial and industrial construction companies), I found an improvement in general economic conditions to be an improvement in my business. As my business improved, I was able to employ more people and provide more benefits including bonuses etc. I always provided the very best health care and retirement benefits. As a result I had some of the best employees / associates in the industry. I was very proud to help provide for 100’s of families.
The last 20+ years I have been engaged in not-for-profit enterprises providing human helping services especially for the poor and destitute. I have found the same to be true. As economic conditions improve, the opportunity to provide life helping services to those in need also improves. I am pleased that I continue to be able to provides these sort of services. I have been blessed.
So while greed and corruption, unchecked human nature, can prevent and dampen compassion and service, it does not need to be that way. My hope is that as economic conditions improve in the US, it will benefit all US citizens as well as citizens of the world as their economies also improve. The American people have been the most charitable people in the history of the world. I hope that will continue. We should take care of our own first and then as opportunity and ability provides, we can help more.
Bottom line, I am pleased to see dramatically improving GDP numbers for the USA.
I think you’re both right Kevin and Rodney.
I agree that rising GDP tends to see an improvement in economic situations of all classes. But it is not always shared evenly across the wealth divide.
I also agree that it is a reasonable measure of a country’s economic situation, but does not tell the full story and can be a rather crude measure.
In New Zealand our coalition government is introducing a measure of social wellbeing being also to track. The base concept is you can’t work on / focus on what you don’t measure, so if we want to improve well being of our poorest then we need to measure it. I expect it will be revealed in the next budget to come soon. And most NZers think it’s a pretty good idea.
Of course, we still measure GDP and all the usual economic indicators.
I just remembered, the 1st quarter of 2019 includes a month of the US government shut down. If I recall properly, that could have decreased the quarterly GDP by 0.1% to 0.25%.
Cheers!
If I were not having diverticulitis this week, I’d raise a glass to you Peter S. (BTW, I am healing well.) And, had I not been adding some last minute comments on yesterday’s forum (4-24), I may have been able to snatch the poll position from you. Good job.
I am glad you are healing Rodney. I am hoping you get fully well very soon and feel better.