
A small range day closes with price range bound. This meets the overall expectation for the Elliott wave count for the short term.
Summary: A consolidation may unfold here that may be shallow and short lived. It may now end in another one or two sessions about 2,890. Thereafter, the upwards trend may continue to new all time highs.
The upwards trend remains intact and there is underlying strength in this market still.
The final target remains the same at 3,045. Alternate monthly wave counts allow for a target as high as 4,119.
New updates to this analysis are in bold.
The biggest picture, Grand Super Cycle analysis, is here.
Monthly charts were last published here. Video is here.
ELLIOTT WAVE COUNTS
MAIN WAVE COUNT
WEEKLY CHART
Click chart to enlarge.
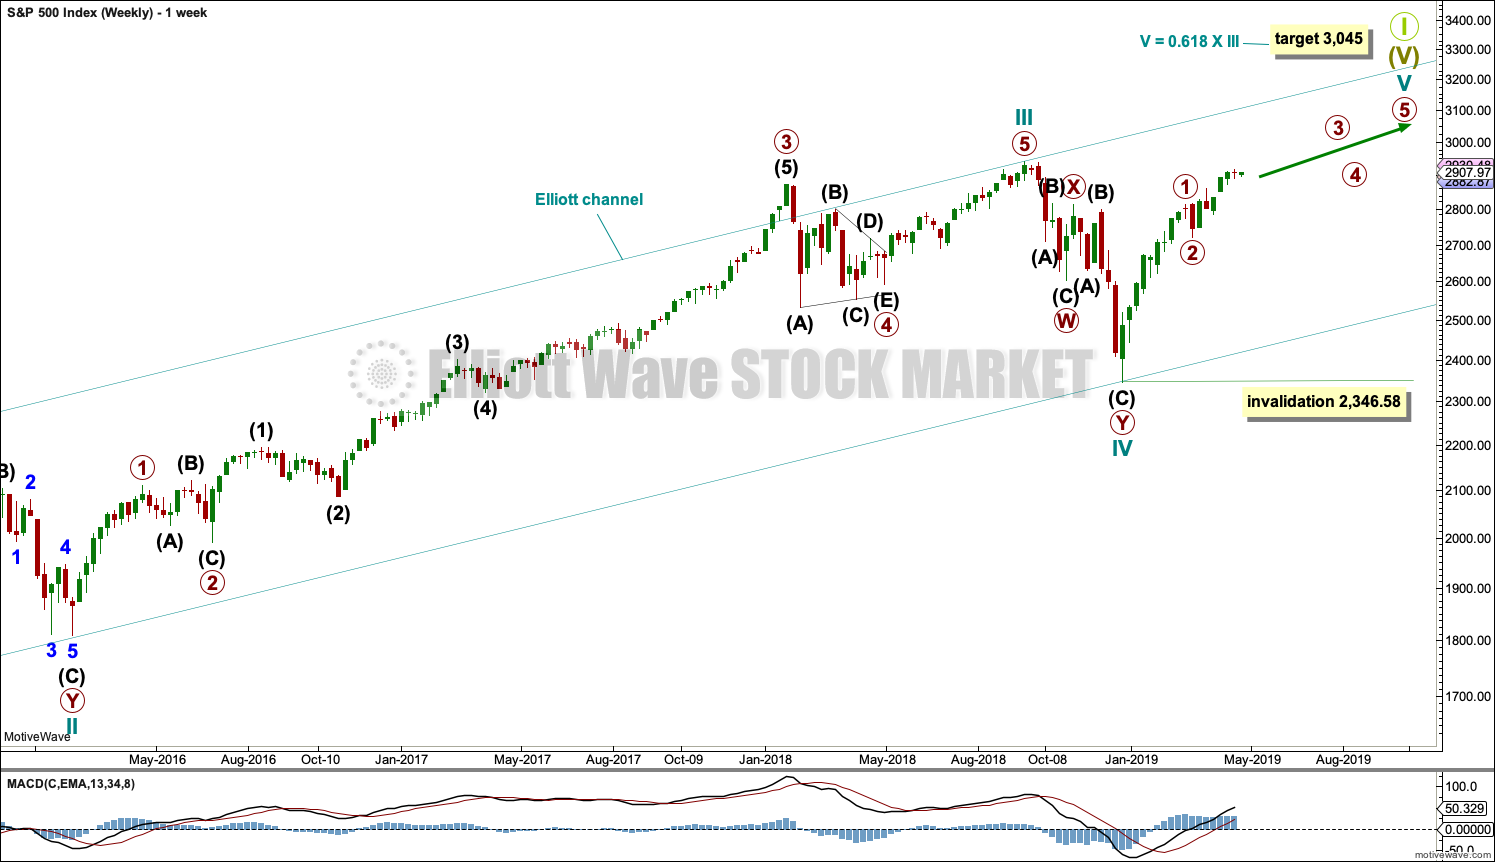
This weekly chart shows all of cycle waves III, IV and V so far.
Cycle wave II fits as a time consuming double combination: flat – X – zigzag. Combinations tend to be more time consuming corrective structures than zigzags. Cycle wave IV has completed as a multiple zigzag that should be expected to be more brief than cycle wave II.
Cycle wave IV may have ended at the lower edge of the Elliott channel.
Within cycle wave V, no second wave correction may move beyond the start of its first wave below 2,346.58.
Although both cycle waves II and IV are labelled W-X-Y, they are different corrective structures. There are two broad groups of Elliott wave corrective structures: the zigzag family, which are sharp corrections, and all the rest, which are sideways corrections. Multiple zigzags belong to the zigzag family and combinations belong to the sideways family. There is perfect alternation between the possible double zigzag of cycle wave IV and the combination of cycle wave II.
Although there is gross disproportion between the duration of cycle waves II and IV, the size of cycle wave IV in terms of price makes these two corrections look like they should be labelled at the same degree. Proportion is a function of either or both of price and time.
Draw the Elliott channel about Super Cycle wave (V) with the first trend line from the end of cycle wave I (at 2,079.46 on the week beginning 30th November 2014) to the high of cycle wave III, then place a parallel copy on the low of cycle wave II. Cycle wave V may find resistance about the upper edge.
It is possible that cycle wave V may end in October 2019. If it does not end there, or if the AD line makes new all time highs during or after June 2019, then the expectation for cycle wave V to end would be pushed out to March 2020 as the next possibility. Thereafter, the next possibility may be October 2020. March and October are considered as likely months for a bull market to end as in the past they have been popular. That does not mean though that this bull market may not end during any other month.
DAILY CHART
Click chart to enlarge.
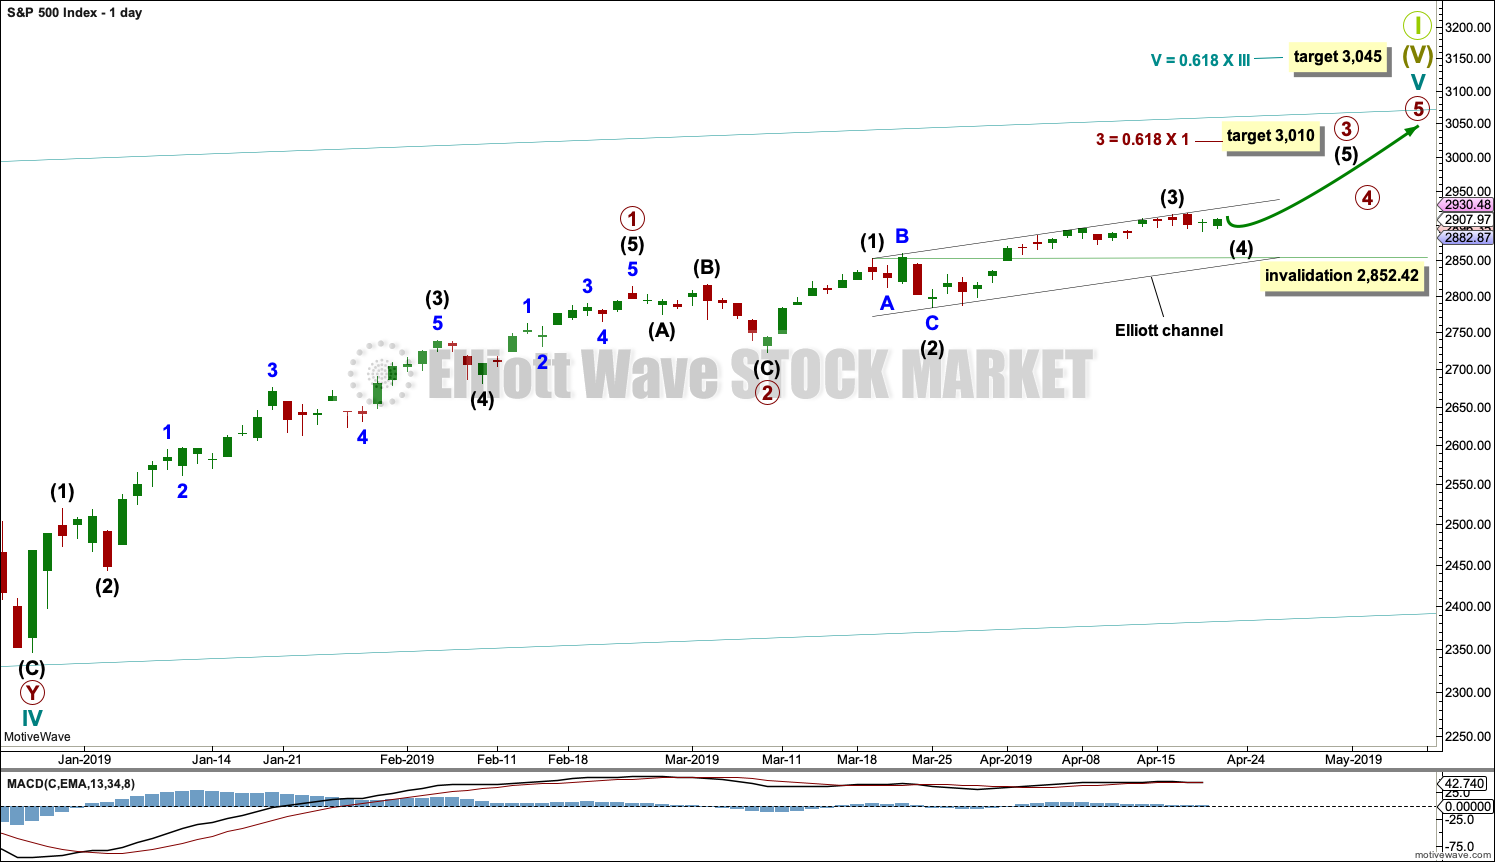
The daily chart will focus on the structure of cycle wave V.
Cycle wave V must subdivide as a five wave motive structure, either an impulse or an ending diagonal. An impulse is much more common and that will be how it is labelled. A diagonal would be considered if overlapping suggests it.
Primary wave 2 may have been a very brief and shallow expanded flat correction.
Within primary wave 3, intermediate waves (1) and (2) may be complete. It is possible that intermediate wave (3) may be complete. It is also possible that minor wave 5 within it may extend higher.
Intermediate wave (4) may not move into intermediate wave (1) price territory below 2,852.42.
A channel is drawn using Elliott’s first technique about the impulse of primary wave 3. Intermediate wave (4) may find support about the lower edge of the channel, or it may end about mid way within the channel. Intermediate wave (5) may find resistance about the upper edge.
HOURLY CHART
Click chart to enlarge.
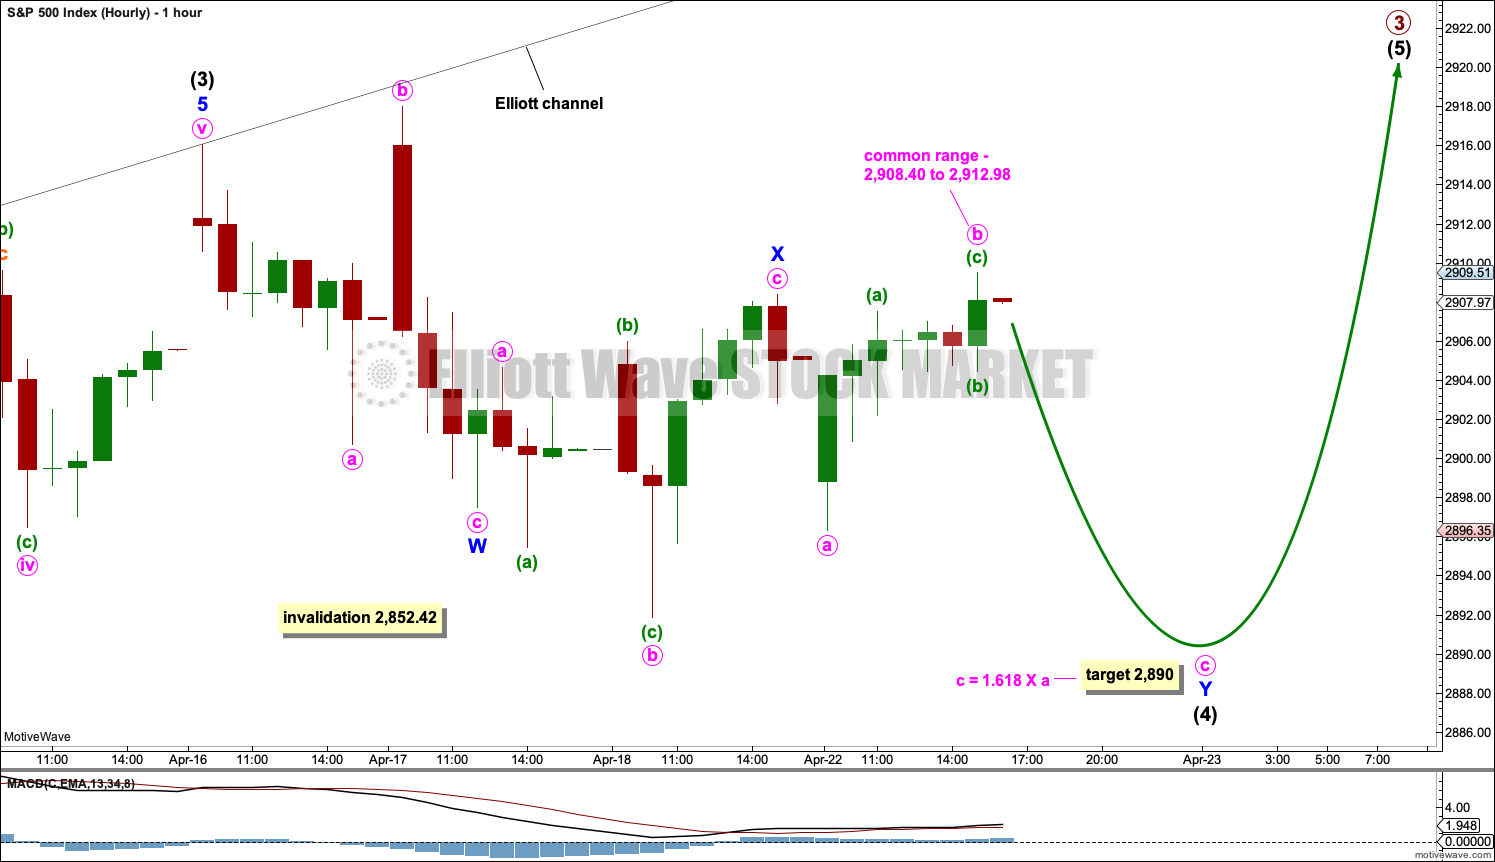
Intermediate wave (2) was a shallow expanded flat correction lasting four sessions. Given the guideline of alternation, intermediate wave (4) may be expected to most likely unfold as a single or multiple zigzag, or a triangle or combination.
Intermediate wave (4) is labelled as an incomplete double flat correction. The first completed flat in the double is an expanded flat labelled minor wave W. The double is joined by a three in the opposite direction, a complete expanded flat labelled minor wave X. The second structure in the double may be unfolding as another expanded flat correction labelled minor wave Y, which may be incomplete.
It is still impossible to know which structure intermediate wave (4) may be. Labelling within it may change again as it unfolds.
If this wave count is wrong, it may be in expecting intermediate wave (4) is incomplete. It may have been over at the last low. A new high on an upwards day that has support from volume would be a classic upwards breakout from this consolidation, and would indicate the consolidation should be considered over and the upwards trend should have resumed.
TECHNICAL ANALYSIS
WEEKLY CHART
Click chart to enlarge. Chart courtesy of et=”_blank”>StockCharts.com.
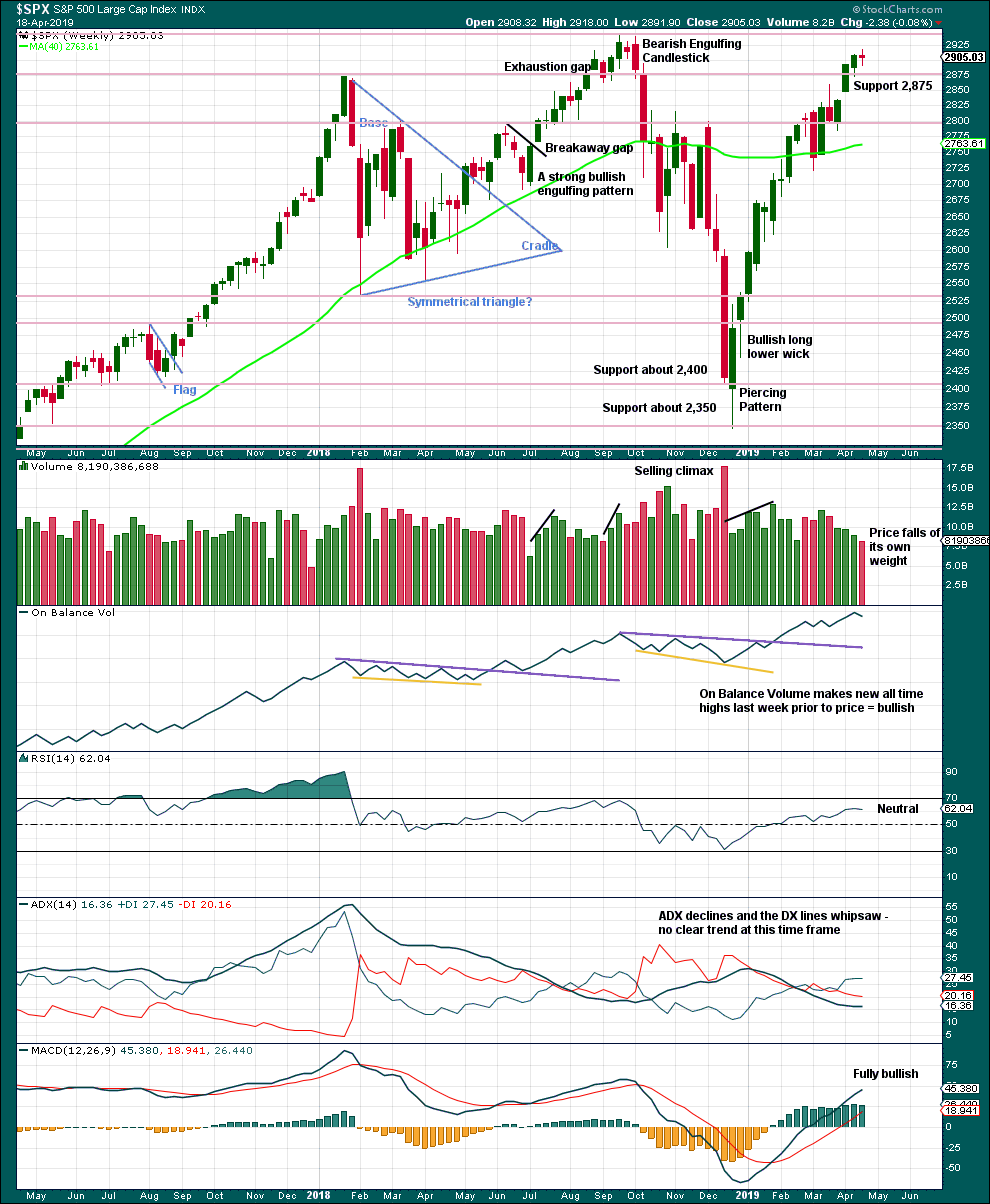
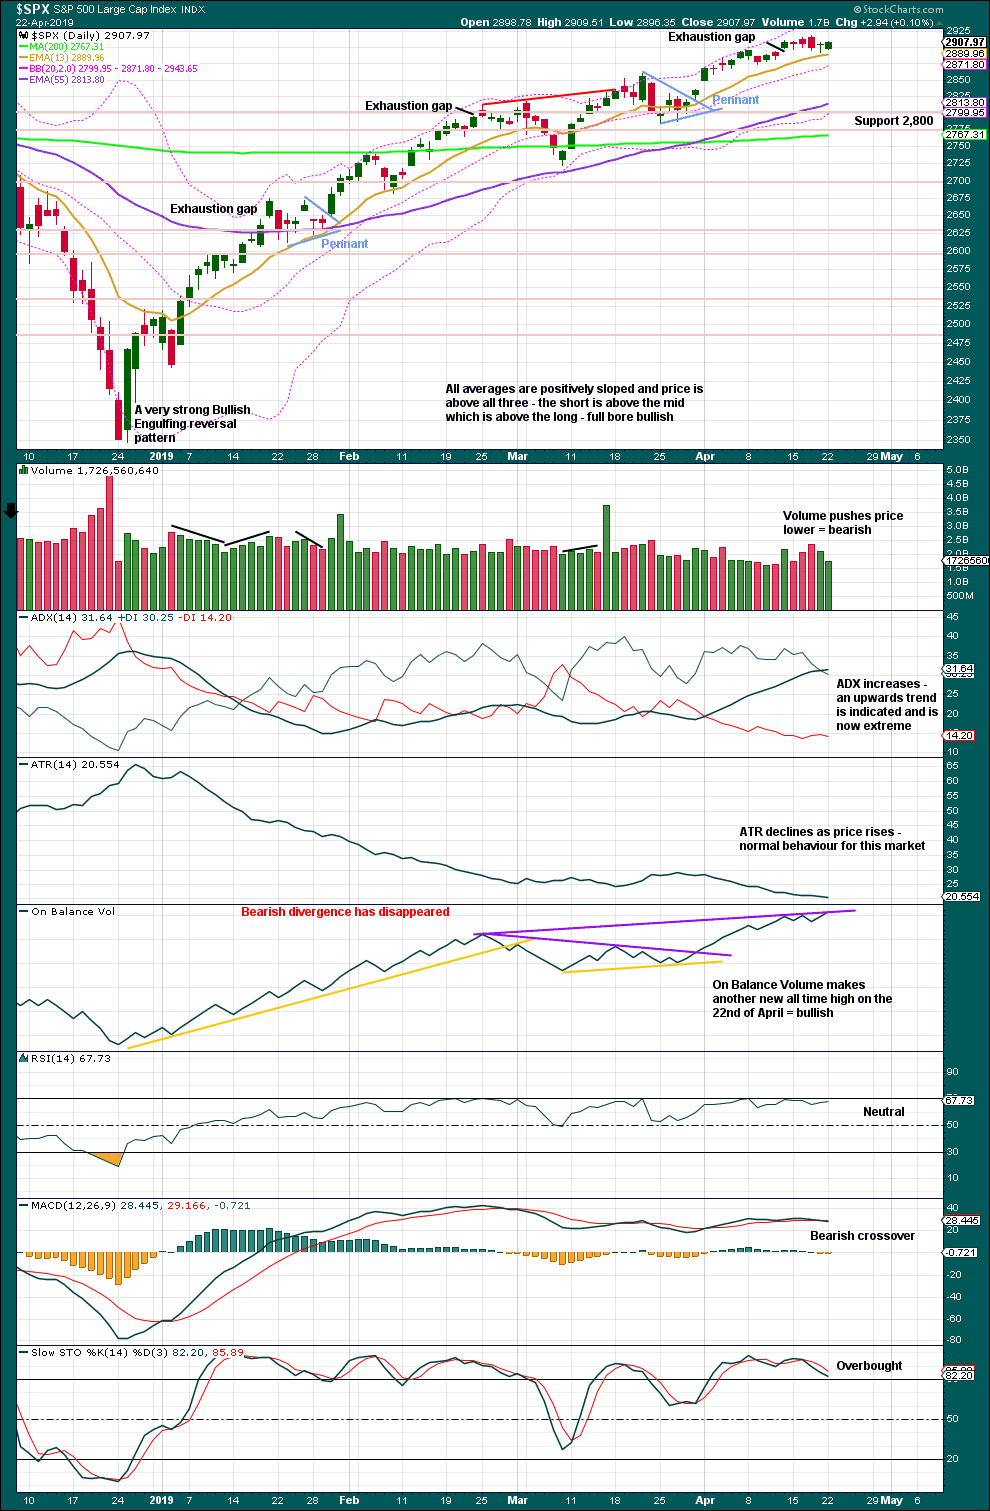
Resistance about 2,880 has been overcome. Next resistance is about the prior all time high about 2,940.
On Balance Volume makes another new all two weeks ago strongly supporting the Elliott wave count.
A decline in volume while price moves higher is not of concern given current market conditions. This has been a feature of this market for a long time and yet price continues higher.
Last week moved price higher, but the candlestick closed red and the balance of volume was downwards. With a short trading week, it would be best to look inside the week at daily volume bars to judge the short-term volume profile. Overall, this chart remains bullish and supports the Elliott wave count.
DAILY CHART
Click chart to enlarge. Chart courtesy of StockCharts.com.
The December 2018 low is expected to remain intact. The two 90% upwards days on 26th December 2018 and 6th January 2019 indicate this upwards trend has internal strength.
Lowry’s data shows that on the 8th of April Selling Pressure has reached another new low for this bull market, and Buying Power has reached a new high for this rally. This indicates an expansion in demand and a contraction in supply, which has historically been associated with strong phases of bull markets. This strongly supports the Elliott wave count, which expects new all time highs to come this year.
While the last swing low of the 25th of March remains intact, there exists a series of higher highs and higher lows from the major low in December 2018. It would be safest to assume the upwards trend remains intact. ADX agrees.
The last gap is now closed and is relabelled as an exhaustion gap. The risk of a near-term pullback or consolidation is heightened. This fits the Elliott wave count expectation.
The new all time high from On Balance Volume today on the daily chart is bullish. But volume did not support upwards movement today.
BREADTH – AD LINE
WEEKLY CHART
Click chart to enlarge. Chart courtesy of StockCharts.com. So that colour blind members are included, bearish signals
will be noted with blue and bullish signals with yellow.
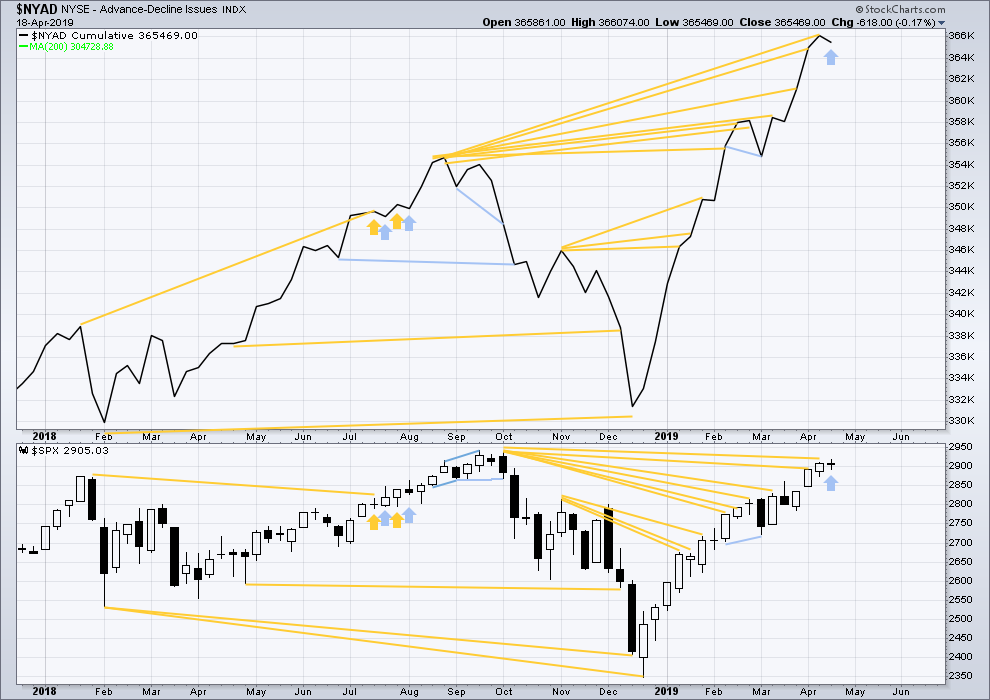
Every single bear market from the Great Depression and onwards has been preceded by a minimum of 4 months divergence between price and the AD line. With the AD line making a new all time high again in April, the end of this bull market and the start of a new bear market must be a minimum of 4 months away, which is the beginning of August 2019 at this time.
Last week the AD line moves lower while price moves higher. This divergence is bearish for the short term.
Mid and large caps have both made new highs above the swing high of the 25th of February, but small caps have not. However, small caps AD line has made a new all time high on the 12th of April indicating broad strength underlying this market.
DAILY CHART
Click chart to enlarge. Chart courtesy of StockCharts.com. So that colour blind members are included, bearish signals
will be noted with blue and bullish signals with yellow.
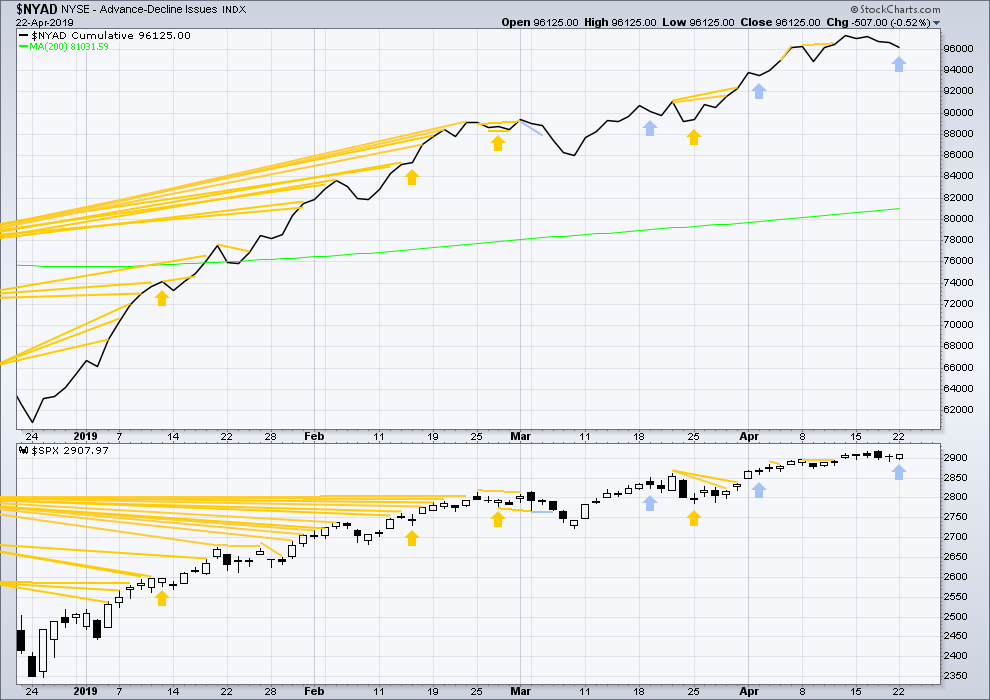
Breadth should be read as a leading indicator.
Today price has moved slightly higher, but the AD line has moved lower. Upwards movement today does not have support from rising market breadth. This divergence is bearish for the short term.
VOLATILITY – INVERTED VIX CHART
WEEKLY CHART
Click chart to enlarge. Chart courtesy of StockCharts.com. So that colour blind members are included, bearish signals
will be noted with blue and bullish signals with yellow.
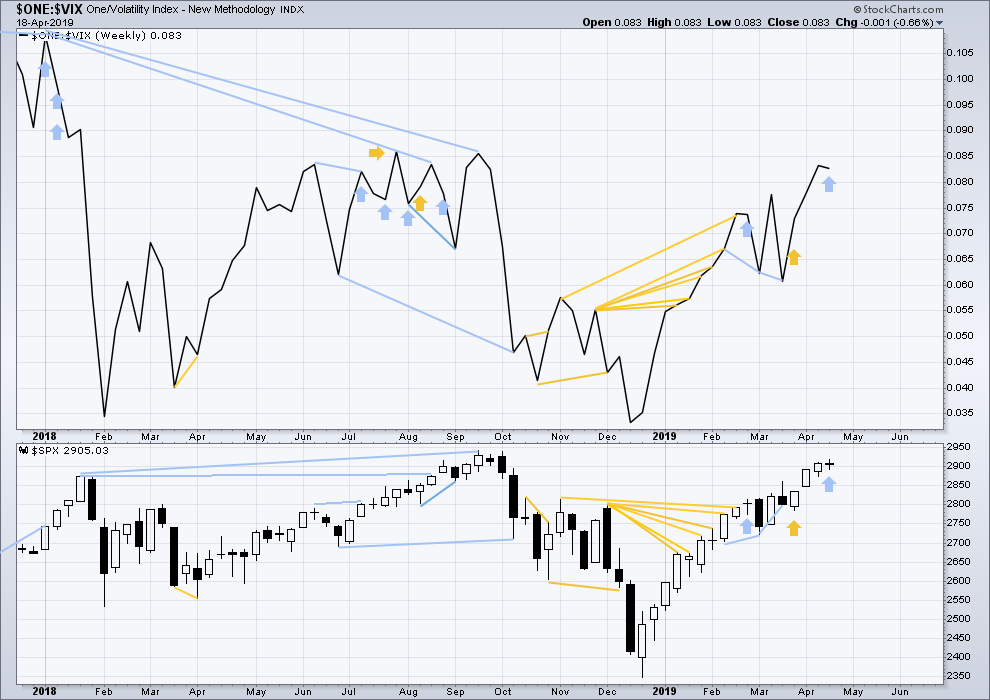
Last week price moved higher, but inverted VIX moved lower. Upwards movement did not come with a normal corresponding decline in VIX. With VIX increasing, this divergence is bearish.
DAILY CHART
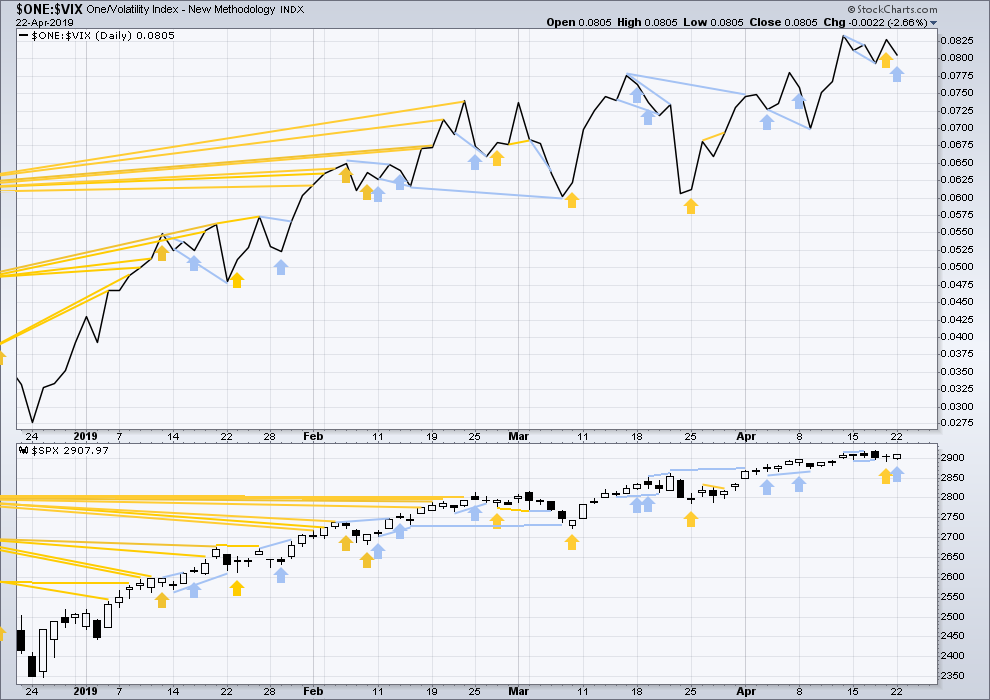
Click chart to enlarge. Chart courtesy of StockCharts.com. So that colour blind members are included, bearish signals
will be noted with blue and bullish signals with yellow.
Short-term bullish divergence on the last trading day last week has now been followed by an upwards day. It may be resolved now.
Today price moved slightly higher, but inverted VIX has moved lower. Upwards movement does not come with a normal corresponding decline in VIX. This divergence is bearish for the short term.
DOW THEORY
Dow Theory confirmed a bear market in December 2018. This does not necessarily mean a bear market at Grand Super Cycle degree though; Dow Theory makes no comment on Elliott wave counts. On the 25th of August 2015 Dow Theory also confirmed a bear market. The Elliott wave count sees that as part of cycle wave II. After Dow Theory confirmation of a bear market in August 2015, price went on to make new all time highs and the bull market continued.
DJIA: 23,344.52 – a close on the 19th of December at 23,284.97 confirms a bear market.
DJT: 9,806.79 – price has closed below this point on the 13th of December.
S&P500: 2,532.69 – a close on the 19th of December at 2,506.96 provides support to a bear market conclusion.
Nasdaq: 6,630.67 – a close on the 19th of December at 6,618.86 provides support to a bear market conclusion.
With all the indices moving now higher, Dow Theory would confirm a bull market if the following highs are made:
DJIA: 26,951.81
DJT: 11,623.58
S&P500: 2,940.91
Nasdaq: 8,133.30.
Published @ 09:30 p.m. EST.
—
Careful risk management protects your trading account(s).
Follow my two Golden Rules:
1. Always trade with stops.
2. Risk only 1-5% of equity on any one trade.
Hourly chart updated:
This move up is too strong to be a continuation of intermediate (4).
Primary 3 may end quite strongly, like primary 3 within cycle III did (see that on the weekly chart).
Look out for any further surprises to the upside now. If my targets are wrong they may not be high enough.
And of course, if we move the degree of labelling within all of cycle V down one degree, it may be only primary 1 nearing an end. This labelling would fit for either of the alternate monthly wave counts.
Anyone here think we might still be in Primary 1 of Cycle V? I don’t like the look of this wave up right now. Looks like a 3 to me. Perhaps this will morph into a large ending diagonal, but too soon to tell.
Yes, I think it’s very possible price is still in primary 1 of cycle V. I think Lara’s acknowledged that as possible. What is shown as a primary 2 down on the daily is extremely small (price and time) for a primary, as I see it.
I don’t know what you mean by “I don’t like the look of this wave”. Looking at the daily chart, the “3 period” of the move off the December lows appears to be in the late January period when MACD momentum was highest. At the hourly, we’ve pretty clearly just executed a iii move. So…what’s not to like? Yes, price overall is getting into a more “iv’s and v’s” kind of period here; the choppiness and size of chop is likely to increase, and that’s consistent with price getting up to the ATH area and hitting significant resistance, too.
This is essentially what the monthly alternates call for.
I may need to publish at least one of those on a weekly chart each day. Would that help everybody?
Not looking very X-of-iv wave ish. Looking more like a small iii after a smaller i-ii to me.
BOOM
I was feeling the same way yesterday, loaded up on cheap calls, been selling them on the way up, next stop for me SPY 292.80
wow this train is full steam ahead
It’s a iii. A iv should be initiating fairly soon.
quick little 4, now up to 293.7
This could be the start of the following iv…but is more likely the iv of the iii itself. A final v up of this iii, and THEN a iv wave back down to perhaps 2924 zone.
Then the push up to/beyond the ATH (which should then fail for a bit with consolidation, but that’s in the future).
My best guess. Just a possible model.
Agreed!
I’ll add that in this model I haven’t tried to position the waves accurately in time. Just the basic structure based on what’s happened since the key swing low a few days ago. This is hourly with overnight data (wide gray areas) for /ES.
#1 on a very slow day. The only exciting thing that happened to me is an attack of diverticulitis. I would not wish that on my worst enemy.
ATH on daily OBV is good support for the next move in price to go to new ATHs above 2940 towards the target of 3010. Until then, I am still in my 100% long position.
Sorry about that Rodney. Are you on antibiotics?
Yes. I started yesterday. Ironically, I already had an appointment to prepare for a colonoscopy just because I am turning 65 this year. It is all more of a nuisance than anything else. However, let me tell you, the diverticulitis pains can be severe.
If trading causes all these medical problems, I might be convinced to quit!
Speedy recovery!
Thanks Peter. It is not trading / investing that causes medical problems. It is getting old. After having been an athlete all my life (including a triathlon) my body beginning to show its signs of long term wearing out is not something to which I am accustomed. So, my suggestion to you is to not get old.
Yeah other than antibiotics and a liquid/soft diet is all you can do until it calms down.
Hope you feel better soon. If it gets too severe go the hospital. These things can potentially perforate the colon, and surgery might be needed. Hopefully it’ll calm down with the abx though.
Best wishes mister!
Slow day eh?
May we have many such slow days! Though SPX is only up 0.83%, it feels like “alot” relative to the slow zig-zag upward of price action recently.
The slow day was yesterday. Today I am up very nice in my positions again, including DUST which I post about on Lara’s weekly.