
A short-term target for a pullback or consolidation was 2,918. Today’s high at 2,916.06 is just 1.94 points short of the target.
Summary: The upwards trend remains intact. A consolidation may unfold here that may be shallow and short lived.
The final target remains the same at 3,045. Alternate monthly wave counts allow for a target as high as 4,119.
New updates to this analysis are in bold.
The biggest picture, Grand Super Cycle analysis, is here.
Monthly charts were last published here. Video is here.
ELLIOTT WAVE COUNTS
MAIN WAVE COUNT
WEEKLY CHART

Click chart to enlarge.
This weekly chart shows all of cycle waves III, IV and V so far.
Cycle wave II fits as a time consuming double combination: flat – X – zigzag. Combinations tend to be more time consuming corrective structures than zigzags. Cycle wave IV has completed as a multiple zigzag that should be expected to be more brief than cycle wave II.
Cycle wave IV may have ended at the lower edge of the Elliott channel.
Within cycle wave V, no second wave correction may move beyond the start of its first wave below 2,346.58.
Although both cycle waves II and IV are labelled W-X-Y, they are different corrective structures. There are two broad groups of Elliott wave corrective structures: the zigzag family, which are sharp corrections, and all the rest, which are sideways corrections. Multiple zigzags belong to the zigzag family and combinations belong to the sideways family. There is perfect alternation between the possible double zigzag of cycle wave IV and the combination of cycle wave II.
Although there is gross disproportion between the duration of cycle waves II and IV, the size of cycle wave IV in terms of price makes these two corrections look like they should be labelled at the same degree. Proportion is a function of either or both of price and time.
Draw the Elliott channel about Super Cycle wave (V) with the first trend line from the end of cycle wave I (at 2,079.46 on the week beginning 30th November 2014) to the high of cycle wave III, then place a parallel copy on the low of cycle wave II. Cycle wave V may find resistance about the upper edge.
It is possible that cycle wave V may end in October 2019. If it does not end there, or if the AD line makes new all time highs during or after June 2019, then the expectation for cycle wave V to end would be pushed out to March 2020 as the next possibility. Thereafter, the next possibility may be October 2020. March and October are considered as likely months for a bull market to end as in the past they have been popular. That does not mean though that this bull market may not end during any other month.
DAILY CHART

Click chart to enlarge.
The daily chart will focus on the structure of cycle wave V.
Cycle wave V must subdivide as a five wave motive structure, either an impulse or an ending diagonal. An impulse is much more common and that will be how it is labelled. A diagonal would be considered if overlapping suggests it.
Primary wave 2 may have been a very brief and shallow expanded flat correction.
Within primary wave 3, intermediate waves (1) and (2) may be complete. It is possible today that intermediate wave (3) may be complete. It is also possible that minor wave 5 within it may extend higher.
Intermediate wave (4) may not move into intermediate wave (1) price territory below 2,852.42.
The channel shows where small pullbacks are finding support. It may continue to do so, but the S&P does not always fit well within channels. It is possible that the channel may be breached and price may continue higher to find resistance at the lower edge of the channel.
HOURLY CHART

Click chart to enlarge.
So far within intermediate wave (3) there are Fibonacci ratios between all of minor waves 1, 3 and 5. If minor wave 5 has ended at today’s high, then it exhibits the most common Fibonacci ratio for a fifth wave. This wave count agrees with MACD.
Intermediate wave (2) was a shallow expanded flat correction lasting four sessions. Given the guideline of alternation, intermediate wave (4) may be expected to most likely unfold as a single or multiple zigzag, or a triangle or combination. Intermediate wave (4) may be very shallow if the last open gap continues to provide support at 2,893.42.
Today intermediate wave (4) is labelled as a possible regular contracting triangle. At this stage, it is impossible to know which structure intermediate wave (4) may be; labelling within it may change as it unfolds.
It is also possible that only minute wave i within minor wave 5 is complete at today’s high. Minor wave 5 may be incomplete; it may be extending.
If this wave count is wrong, it may be in expecting intermediate wave (3) is complete. It may continue higher.
TECHNICAL ANALYSIS
WEEKLY CHART
Click chart to enlarge. Chart courtesy of et=”_blank”>StockCharts.com.
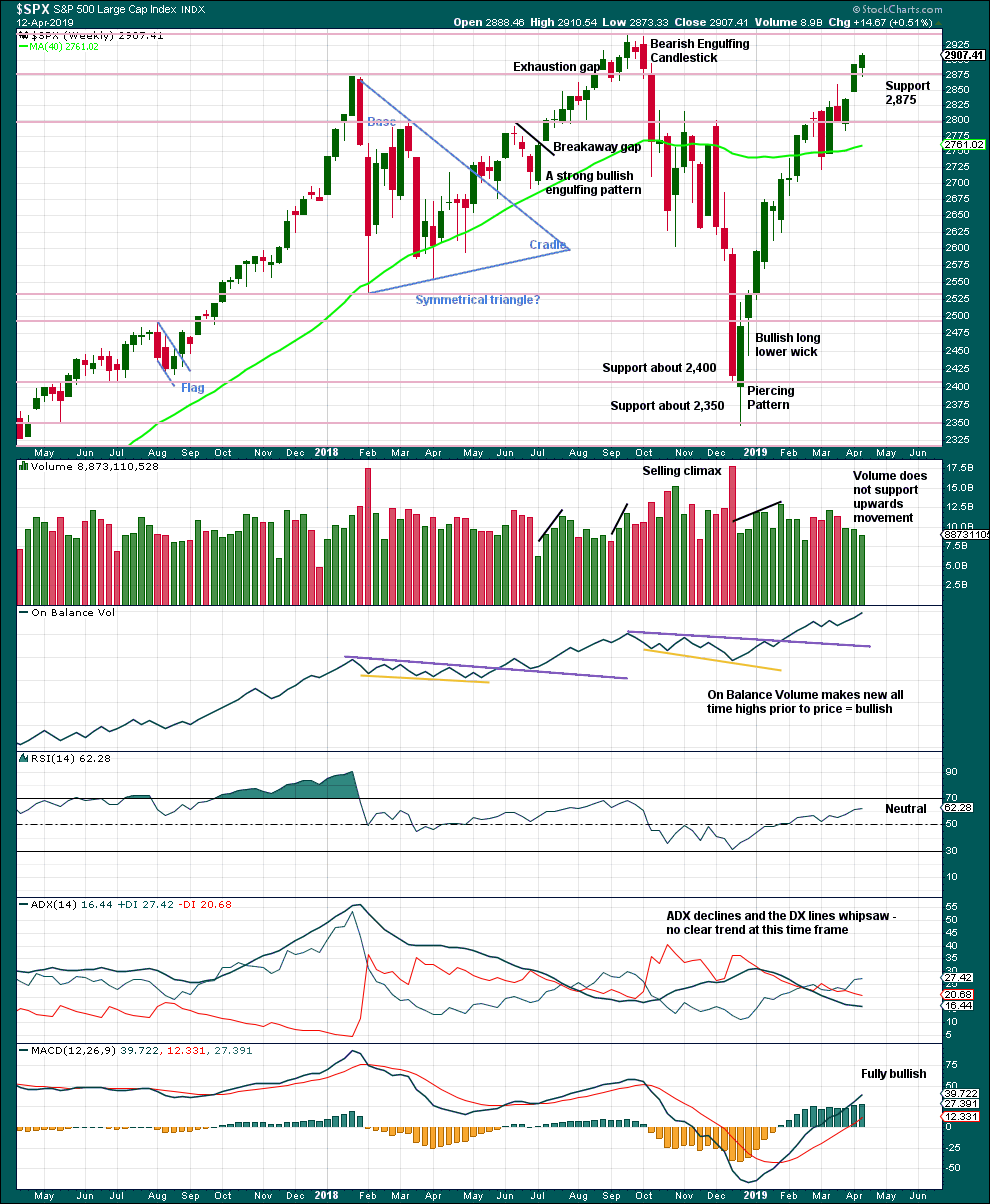
Resistance about 2,880 has been overcome. Next resistance is about the prior all time high about 2,940.
On Balance Volume makes another new all time high last week strongly supporting the Elliott wave count.
A decline in volume while price moves higher is not of concern given current market conditions. This has been a feature of this market for a long time and yet price continues higher.
DAILY CHART

Click chart to enlarge. Chart courtesy of StockCharts.com.
The December 2018 low is expected to remain intact. The two 90% upwards days on 26th December 2018 and 6th January 2019 indicate this upwards trend has internal strength.
Lowry’s data shows that on the 8th of April Selling Pressure has reached another new low for this bull market, and Buying Power has reached a new high for this rally. This indicates an expansion in demand and a contraction in supply, which has historically been associated with strong phases of bull markets. This strongly supports the Elliott wave count, which expects new all time highs to come this year.
While the last swing low of the 25th of March remains intact, there exists a series of higher highs and higher lows from the major low in December 2018. It would be safest to assume the upwards trend remains intact.
The pennant pattern is a reliable short-term continuation pattern. A target calculated using the flag pole is about 2,956.
A gap up on Friday may be another breakaway gap from a very small consolidation. It may provide support at 2,893.42. The breakaway is supported by volume for the short term. Volume also supports today’s upwards movement. This suggests more upwards movement tomorrow.
BREADTH – AD LINE
WEEKLY CHART
Click chart to enlarge. Chart courtesy of StockCharts.com. So that colour blind members are included, bearish signals
will be noted with blue and bullish signals with yellow.
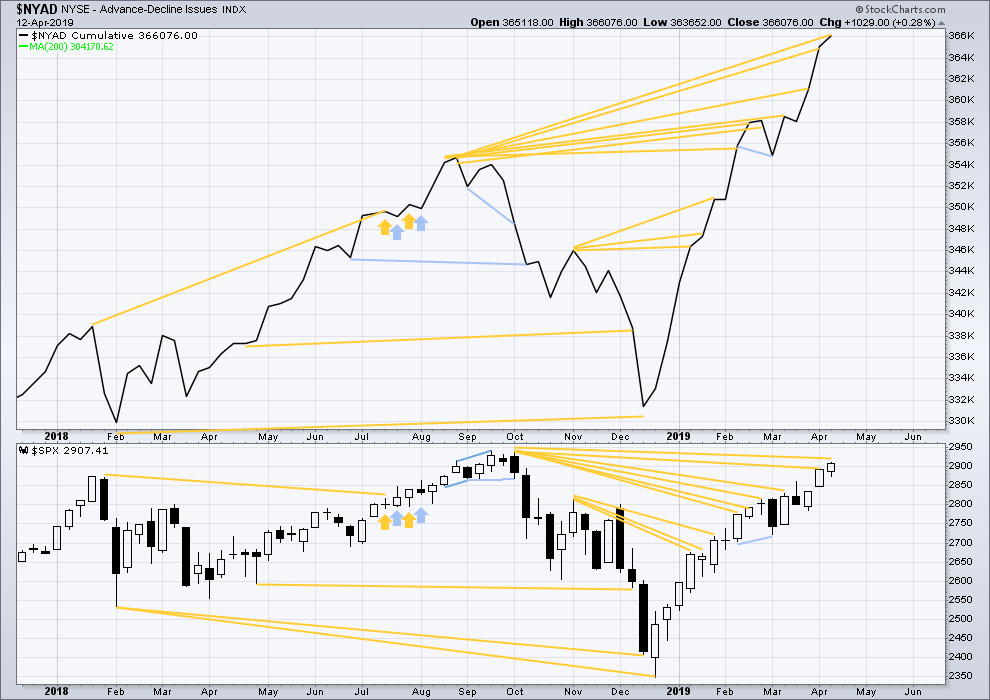
Every single bear market from the Great Depression and onwards has been preceded by a minimum of 4 months divergence between price and the AD line. With the AD line making a new all time high again last week, the end of this bull market and the start of a new bear market must be a minimum of 4 months away, which is the end of July 2019 at this time.
Last week the AD line makes another new all time high. Bullish mid-term divergence continues.
Both mid and large caps have made new swing highs above the prior highs of the 25th of February, but small caps have not. This indicates some selectivity within this upwards trend.
DAILY CHART

Click chart to enlarge. Chart courtesy of StockCharts.com. So that colour blind members are included, bearish signals
will be noted with blue and bullish signals with yellow.
Breadth should be read as a leading indicator.
Today both price and the AD line moved slightly higher. Upwards movement has support from rising market breadth. There is no new short-term divergence.
VOLATILITY – INVERTED VIX CHART
WEEKLY CHART
Click chart to enlarge. Chart courtesy of StockCharts.com. So that colour blind members are included, bearish signals
will be noted with blue and bullish signals with yellow.
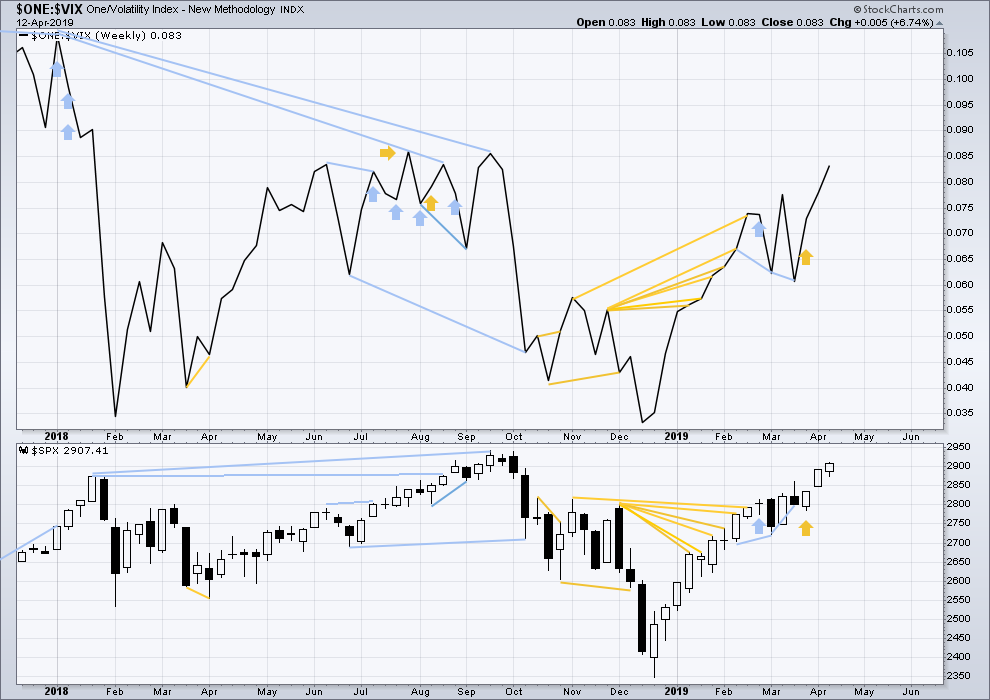
Last week both price and inverted VIX have moved higher. There is no mid or short-term divergence. Long-term divergence between all time highs remains.
DAILY CHART

Click chart to enlarge. Chart courtesy of StockCharts.com. So that colour blind members are included, bearish signals
will be noted with blue and bullish signals with yellow.
Today price has made a slight new high, but inverted VIX has not made a corresponding short-term high. Upwards movement today does not come with a normal corresponding decline in VIX. This divergence is bearish for the short term.
DOW THEORY
Dow Theory confirmed a bear market in December 2018. This does not necessarily mean a bear market at Grand Super Cycle degree though; Dow Theory makes no comment on Elliott wave counts. On the 25th of August 2015 Dow Theory also confirmed a bear market. The Elliott wave count sees that as part of cycle wave II. After Dow Theory confirmation of a bear market in August 2015, price went on to make new all time highs and the bull market continued.
DJIA: 23,344.52 – a close on the 19th of December at 23,284.97 confirms a bear market.
DJT: 9,806.79 – price has closed below this point on the 13th of December.
S&P500: 2,532.69 – a close on the 19th of December at 2,506.96 provides support to a bear market conclusion.
Nasdaq: 6,630.67 – a close on the 19th of December at 6,618.86 provides support to a bear market conclusion.
With all the indices moving now higher, Dow Theory would confirm a bull market if the following highs are made:
DJIA: 26,951.81
DJT: 11,623.58
S&P500: 2,940.91
Nasdaq: 8,133.30.
Published @ 06:18 p.m. EST.
—
Careful risk management protects your trading account(s).
Follow my two Golden Rules:
1. Always trade with stops.
2. Risk only 1-5% of equity on any one trade.
I’m going to tentatively label intermediate (4) as incomplete, continuing sideways as a double combination. This would provide alternation with the flat of intermediate (2), and if it takes up more time the proportion would be better.
Assume that price may find support at the lower edge of the best fit channel, until that line is properly breached. So far it’s holding.
the most bullish thing I could come up with
and the most bearish; a screaming sell signal
If price breaks below Monday’s lows, this looks like a major reversal top on the daily, and we are in for some significant downside action over the next week (or more).
with today’s hourly labeling this is now an expanded flat 4 but there was an expanded flat 2 so that “shouldn’t be”. The overall minor 5 is now looking to me an awful lot like an ending diagonal. By my rough count, if it’s an ending diagonal, it has one final 5 wave up to go? the turn now is pretty clean off the hourly elliott wave channel, supporting that thesis.
I have a vibe about the ES 2900.25 level. It feels like a trigger level for something. It has a force field around it. Wouldn’t be surprised to see ES go up to the 2927 target area (+ 3 maybe) then take the ES 2900.25 level out, on the way down. Maybe that would signal a selloff. Anyway, ES 2900.25 is doing something.
hard to see from this chart, but the only time 2900.25 was touched was on April 12th when price blew through it on the way up
other than that, it has been resistance/support
sold my calls at open, and rode the puts back down, playing it like a triangle…. until it isn’t
291 SPY my next target
OK, C down then…
This daily routine of gap open higher then sell off all day long is getting a little tiresome. Maybe it’s “pre-resistance” in advance of the massive resistance as price gets close to the ATH? I dunno.
NFLX’s day is hilarious, except I hold ROKU which moves in tandem…I think a good buy in ROKU might be setting up here, with a supportive 38% that it turned off early just below at 55.6
Hope everyone is having a good evening!
😉
sneak