A small range day leaves the main Elliott wave count unchanged.
Summary: Targets for a multi-week pullback are 2,637 or 2,526.
However, if price closes above 2,816.88 on an upwards day with support from volume, then that would be a classic upwards breakout and the pullback would then be considered over.
At its end, this pullback may offer an opportunity to join the upwards trend prior to new all time highs.
New updates to this analysis are in bold.
The biggest picture, Grand Super Cycle analysis, is here.
Last published monthly charts are here. Video is here.
ELLIOTT WAVE COUNT
WEEKLY CHART
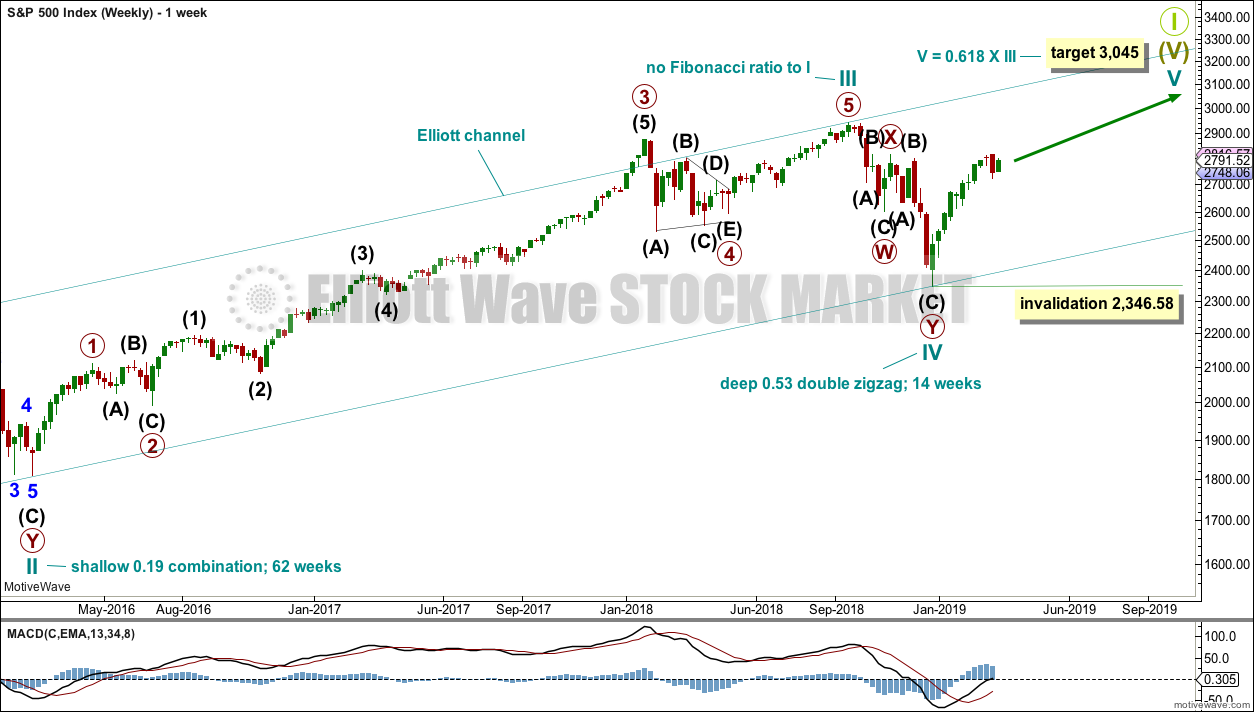
This weekly chart shows all of cycle waves III, IV and V so far.
Cycle wave II fits as a time consuming double combination: flat – X – zigzag. Combinations tend to be more time consuming corrective structures than zigzags. Cycle wave IV has completed as a multiple zigzag that should be expected to be more brief than cycle wave II.
Cycle wave IV may have ended at the lower edge of the Elliott channel.
Within cycle wave V, no second wave correction may move beyond the start of its first wave below 2,346.58.
Although both cycle waves II and IV are labelled W-X-Y, they are different corrective structures. There are two broad groups of Elliott wave corrective structures: the zigzag family, which are sharp corrections, and all the rest, which are sideways corrections. Multiple zigzags belong to the zigzag family and combinations belong to the sideways family. There is perfect alternation between the possible double zigzag of cycle wave IV and the combination of cycle wave II.
Although there is gross disproportion between the duration of cycle waves II and IV, the size of cycle wave IV in terms of price makes these two corrections look like they should be labelled at the same degree. Proportion is a function of either or both of price and time.
Draw the Elliott channel about Super Cycle wave (V) with the first trend line from the end of cycle wave I (at 2,079.46 on the week beginning 30th November 2014) to the high of cycle wave III, then place a parallel copy on the low of cycle wave II. Cycle wave V may find resistance about the upper edge.
It is possible that cycle wave V may end in October 2019. If it does not end there, or if the AD line makes new all time highs during or after June 2019, then the expectation for cycle wave V to end would be pushed out to March 2020 as the next possibility. Thereafter, the next possibility may be October 2020. March and October are considered as likely months for a bull market to end as in the past they have been popular. That does not mean though that this bull market may not end during any other month.
DAILY CHART
The daily chart will focus on the structure of cycle wave V.
Within Super Cycle wave (V), cycle wave III may not be the shortest actionary wave. Because cycle wave III is shorter than cycle wave I, this limits cycle wave V to no longer than equality in length with cycle wave III at 3,477.39. A target is calculated for cycle wave V to end prior to this point.
Cycle wave V must subdivide as a five wave motive structure, either an impulse or an ending diagonal. An impulse is much more common and that will be how it is labelled. A diagonal would be considered if overlapping suggests it.
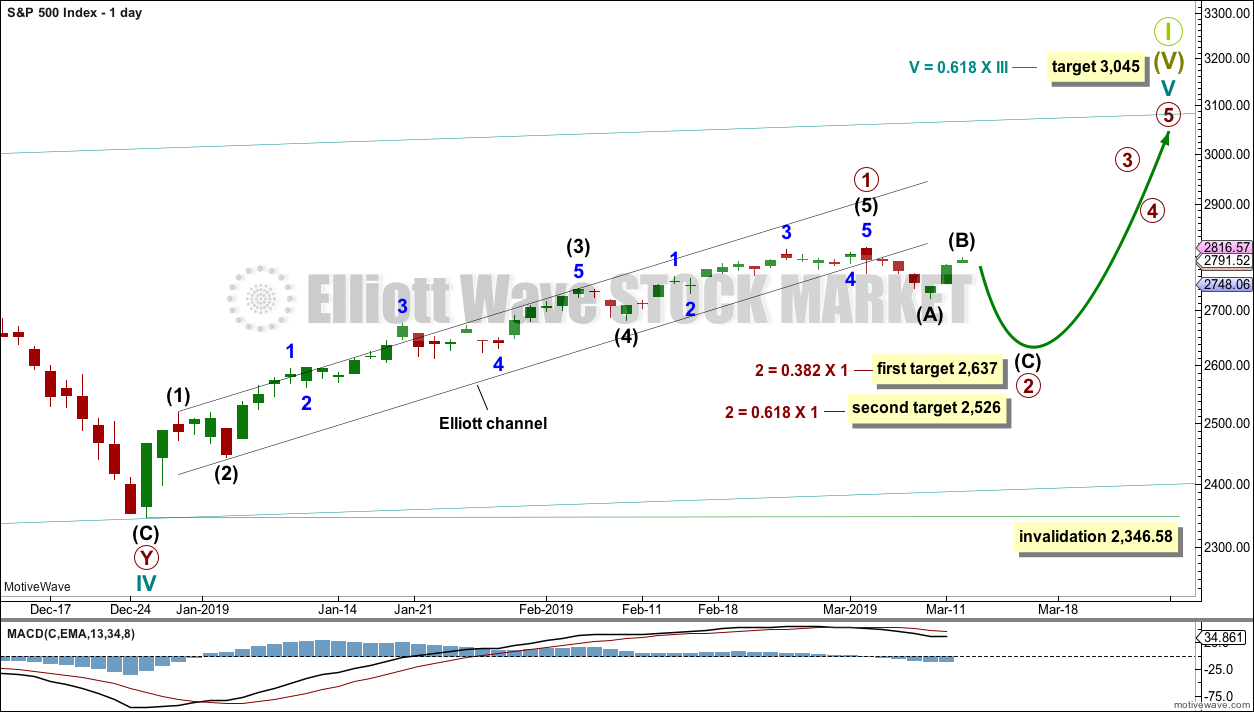
Primary wave 1 is labelled as complete. Two targets are given for primary wave 2. The higher 0.382 Fibonacci ratio may be preferred in the first instance. If price keeps dropping through this target or if it gets there and the structure of primary wave 2 is incomplete, then the second lower target may be used.
Primary wave 2 may not move beyond the start of primary wave 1 below 2,346.58.
Primary wave 2 would most likely subdivide as a zigzag, but it may subdivide as any corrective structure except a triangle. The focus is currently on identifying when a complete structure for primary wave 2 may be seen.
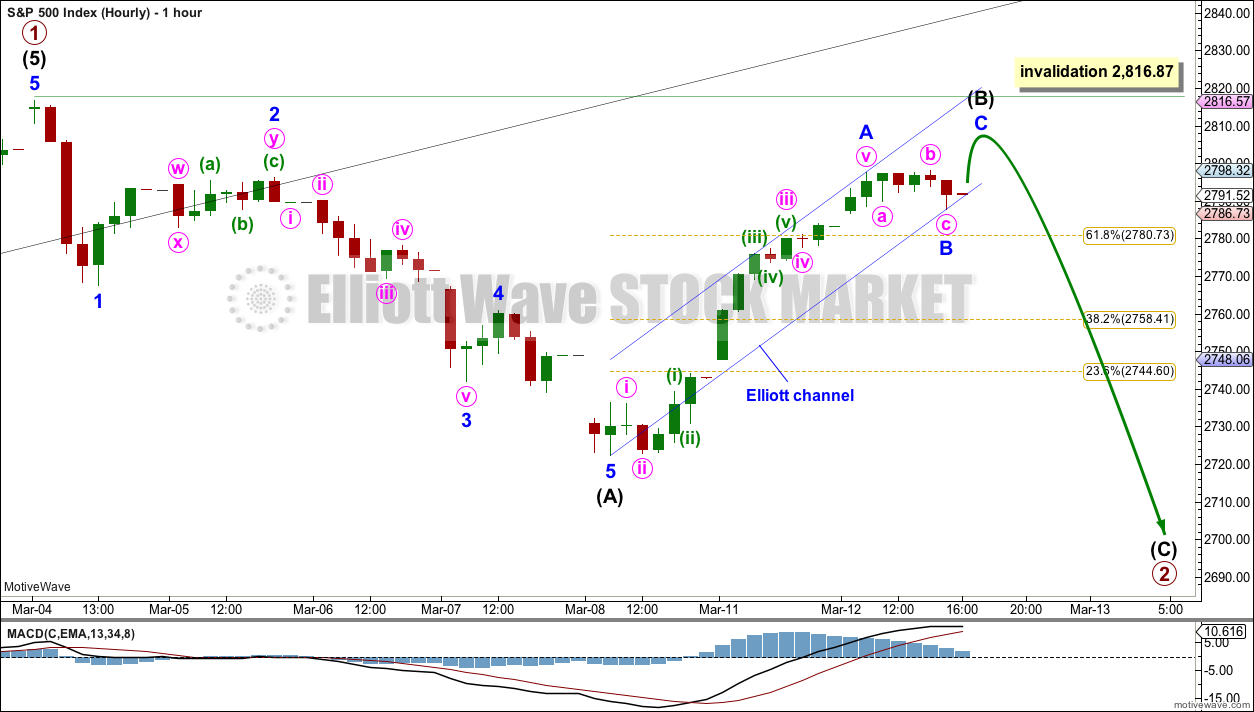
MAIN HOURLY CHART
The most likely structure for primary wave 2 would be a zigzag. The next most likely structure would be a double zigzag.
Within a zigzag, intermediate wave (A) must subdivide as a five wave structure. It is possible again today to see intermediate wave (A) as complete.
Within a zigzag, intermediate wave (B) may not move beyond the start of intermediate wave (A) above 2,816.87.
Intermediate wave (B) may subdivide as any one of more than 23 corrective structures. It may be a quick sharp zigzag, or it may be a time consuming sideways triangle or combination. It is impossible to tell which structure intermediate wave (B) may be unfolding as until it is complete. Flexibility is essential with B waves; they exhibit the greatest variety in terms of structure and price behaviour and they are often complicated. Labelling within intermediate wave (B) is most likely to change as it unfolds.
At this stage, intermediate wave (B) is labelled as an incomplete zigzag. Within the zigzag, minor wave B may now be complete as a small expanded flat correction.
Primary wave 1 lasted 45 sessions. Primary wave 2 may last a Fibonacci 21, 34 or 55 sessions. It may also be in proportion to primary wave 1 at about 45 sessions.
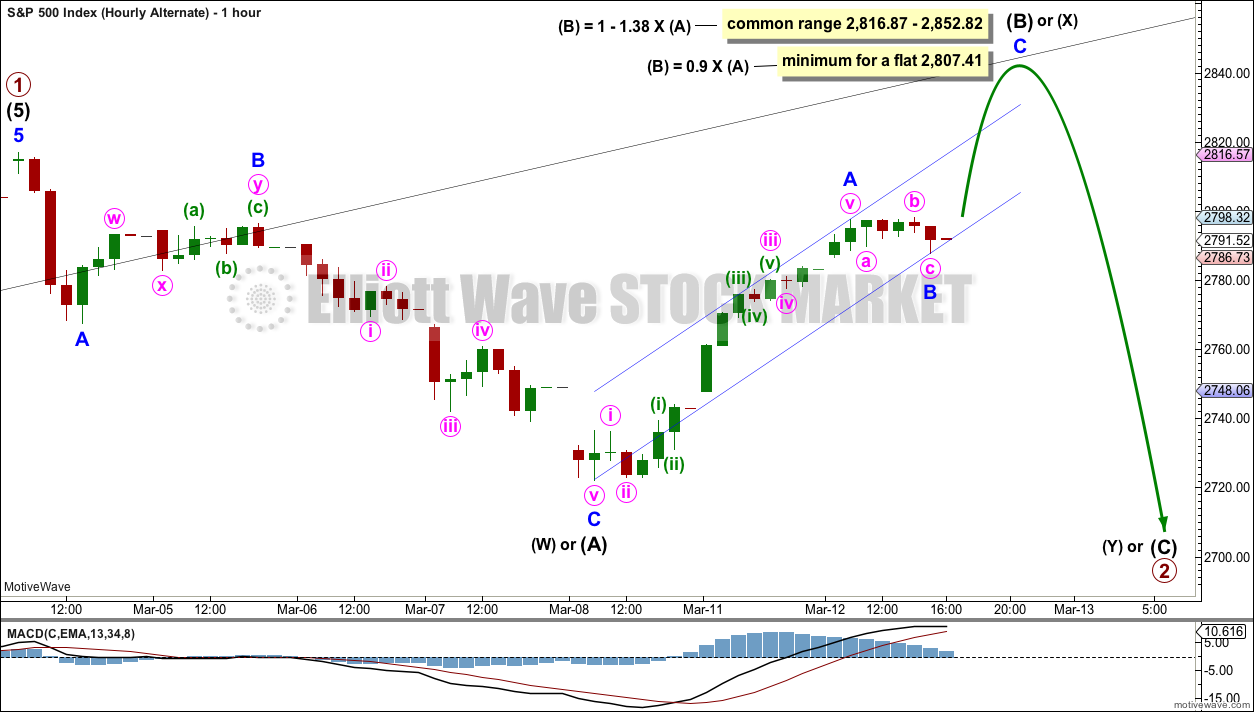
ALTERNATE HOURLY CHART
It is also possible to see intermediate wave (A) as a complete three wave structure.
When the first structure in a correction may be a three wave structure, then a flat, combination or double zigzag is indicated. Primary wave 2 may not subdivide as a triangle; triangles may not unfold in second wave positions.
If primary wave 2 unfolds as a flat correction, then within it intermediate wave (A) may be a complete zigzag. Intermediate wave (B) must retrace a minimum 0.9 length of intermediate wave (A) and it may make a new high above the start of intermediate wave (A) as in an expanded flat.
If primary wave 2 unfolds as a double combination, then the first structure in a double may be a complete zigzag labelled intermediate wave (W). Intermediate wave (X) within a double combination has no minimum requirement, but it would most likely be very deep and may make a new high above the start of intermediate wave (W).
A double zigzag now looks very unlikely. Double zigzags have relatively quick and shallow X waves, and here intermediate wave (X) looks too deep for an X wave within a double zigzag.
This wave count may see a new high above 2,816.87 as part of primary wave 2. However, if a new high does occur, then this wave count expects it should exhibit weakness: it should lack support from volume, ATR may decline, and MACD may exhibit bearish divergence with the last high.
If a new high occurs with some strength, then the alternate daily chart below should be considered.
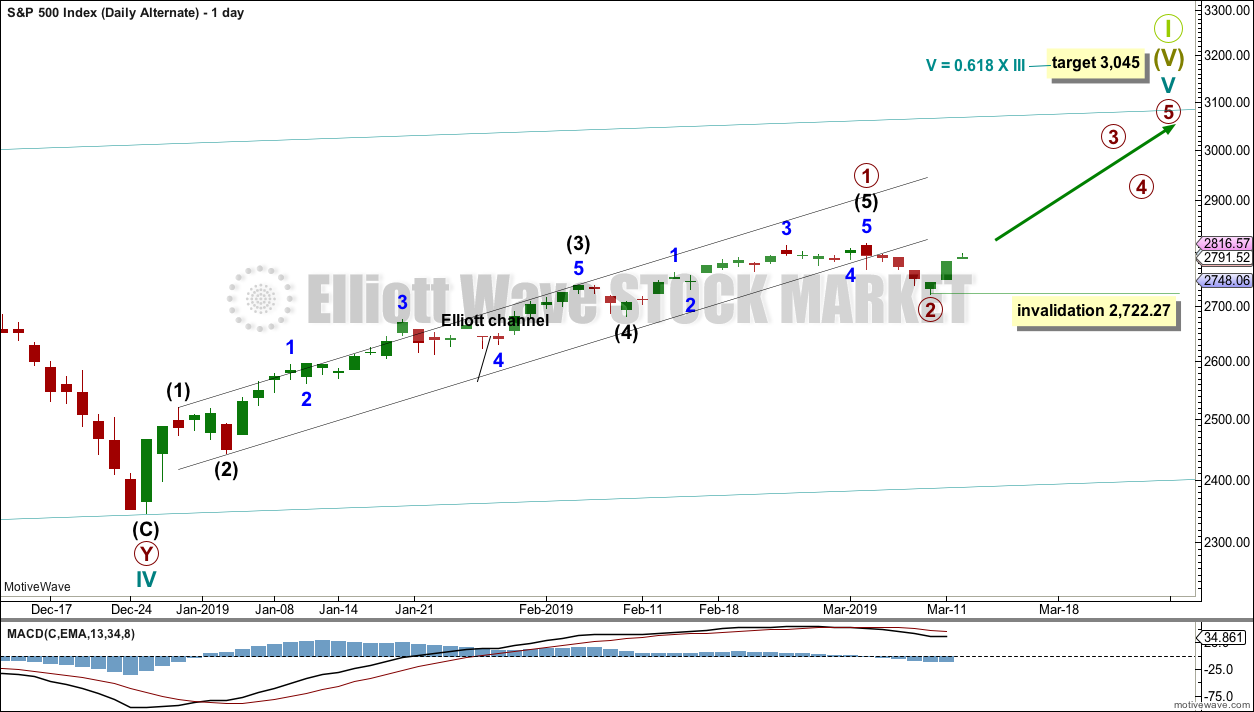
ALTERNATE DAILY CHART
It is just possible that primary wave 2 may have been over at the last low. It may have been a very brief and shallow 0.20 zigzag.
There is some strength within upwards movement yesterday that suggests this wave count should be considered as a possibility. However, it would be unusual for a primary degree second wave to be this brief and shallow.
For confidence this wave count requires a classic upwards breakout: a close above 2,816.87 on an upwards day that has support from volume. A bullish signal from either one or more of the AD line, On Balance Volume or inverted VIX wold also indicate this wave count may be correct.
There is reasonable weakness in today’s upwards movement which does not support this alternate wave count.
TECHNICAL ANALYSIS
WEEKLY CHART
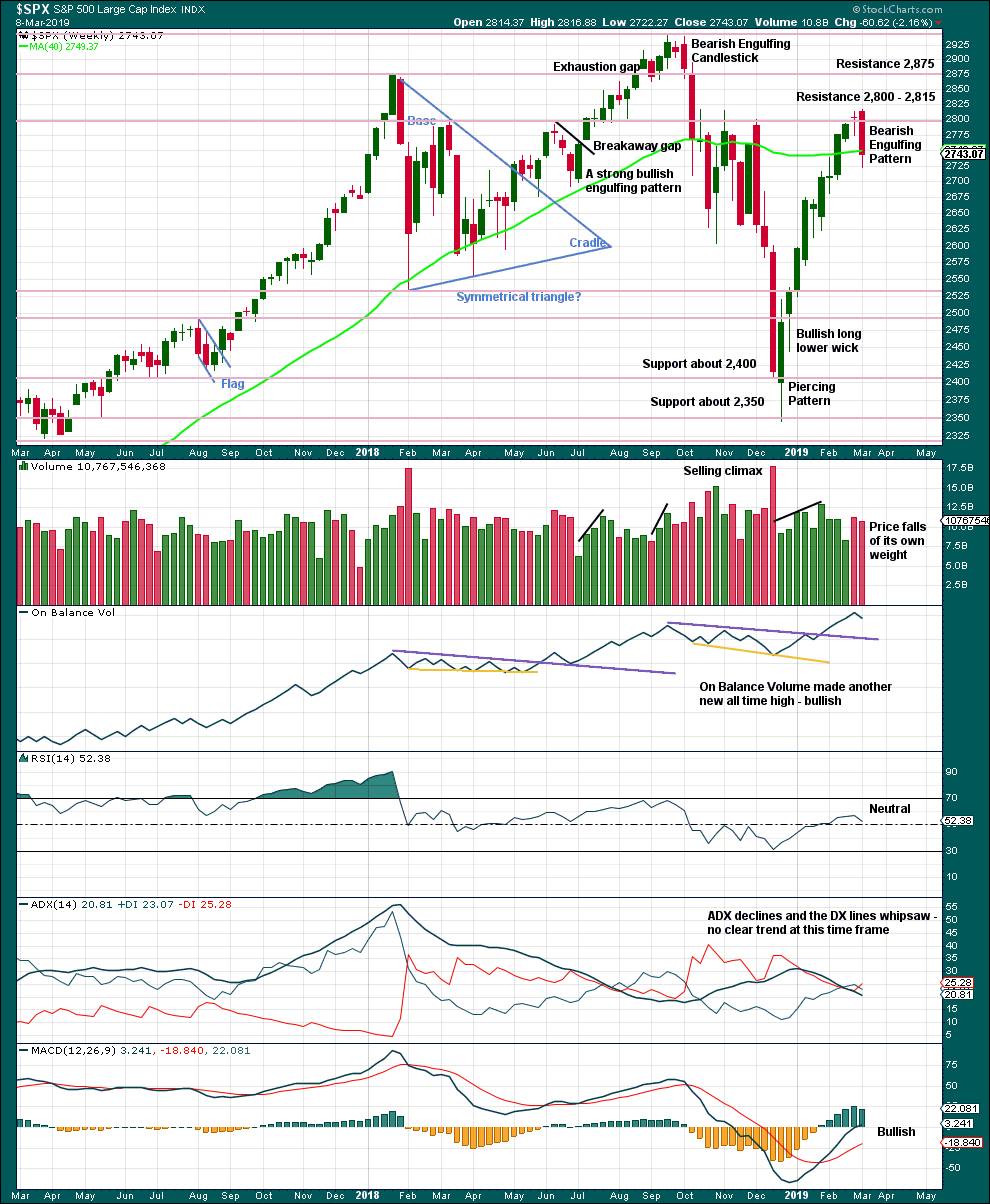
Click chart to enlarge. Chart courtesy of et=”_blank”>StockCharts.com.
Last week the strong Bearish Engulfing candlestick pattern supports the main Elliott wave count.
DAILY CHART
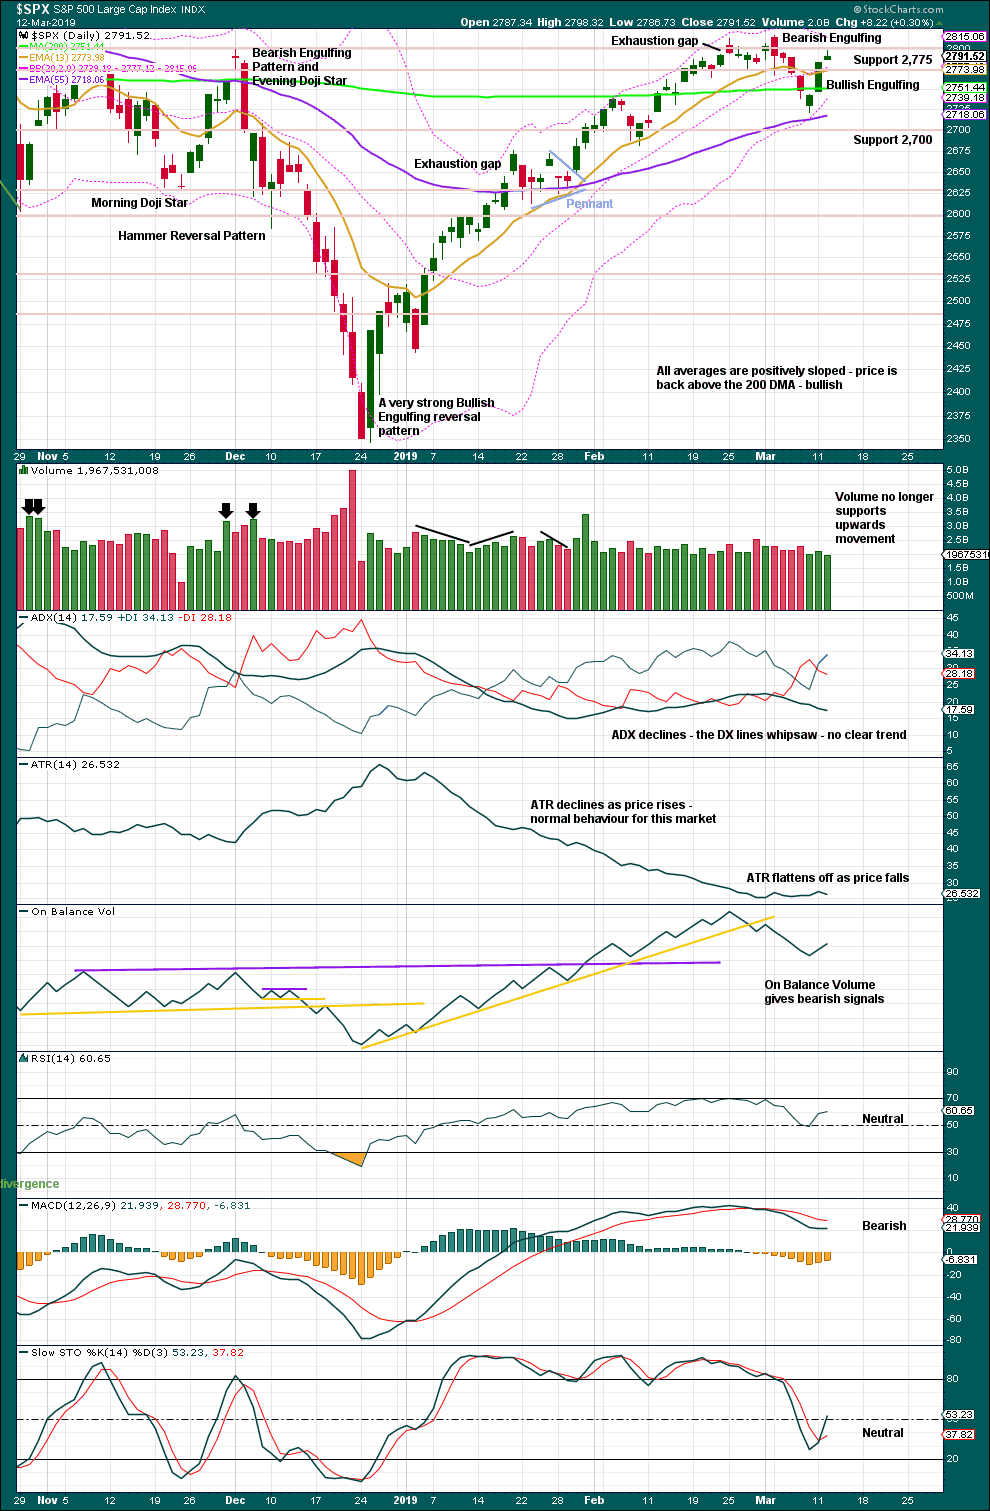
Click chart to enlarge. Chart courtesy of StockCharts.com.
The December 2018 low is expected to remain intact. The two 90% upwards days on 26th December 2018 and 6th January 2019 indicate this upwards trend has internal strength.
On Balance Volume remains overall bearish and supports the Elliott wave count. Look for next support about 2,625 and then 2,600.
For the short term, a very small range day which lacks support from volume suggests this small upwards movement is tiring. This supports the main Elliott wave count.
BREADTH – AD LINE
WEEKLY CHART
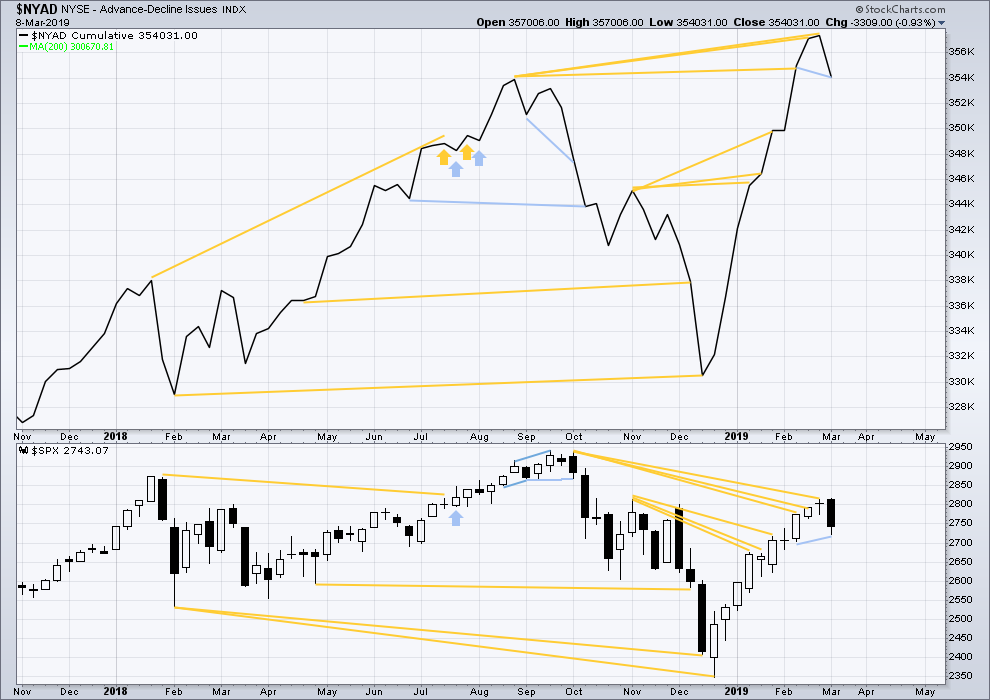
Click chart to enlarge. Chart courtesy of StockCharts.com. So that colour blind members are included, bearish signals
will be noted with blue and bullish signals with yellow.
Every single bear market from the Great Depression and onwards has been preceded by a minimum of 4-6 months divergence between price and the AD line. With the AD line making a new all time high again last week, the end of this bull market and the start of a new bear market must be a minimum of 4 months away, which is mid to end June 2019 at this time.
Last week the AD line has made a new low below the prior low of the week beginning 11th February, but price has not. This divergence is bearish for the short term.
DAILY CHART
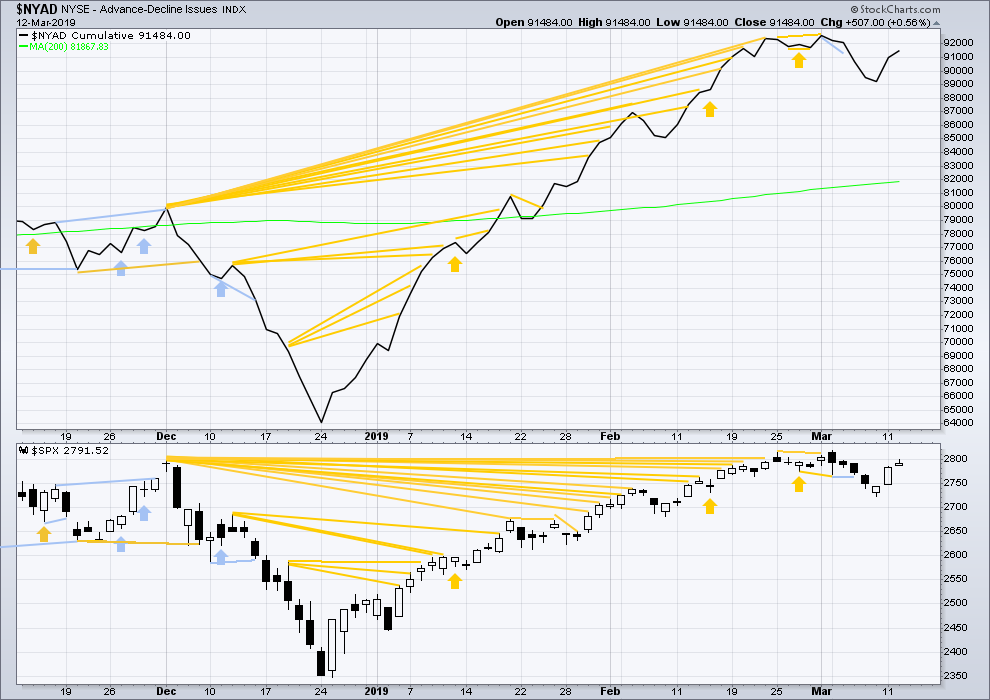
Click chart to enlarge. Chart courtesy of StockCharts.com. So that colour blind members are included, bearish signals
will be noted with blue and bullish signals with yellow.
Breadth should be read as a leading indicator.
Both price and the AD line moved a little higher today. There is no new divergence. The rise in price today has support from rising market breadth.
VOLATILITY – INVERTED VIX CHART
WEEKLY CHART
Click chart to enlarge. Chart courtesy of StockCharts.com. So that colour blind members are included, bearish signals
will be noted with blue and bullish signals with yellow.
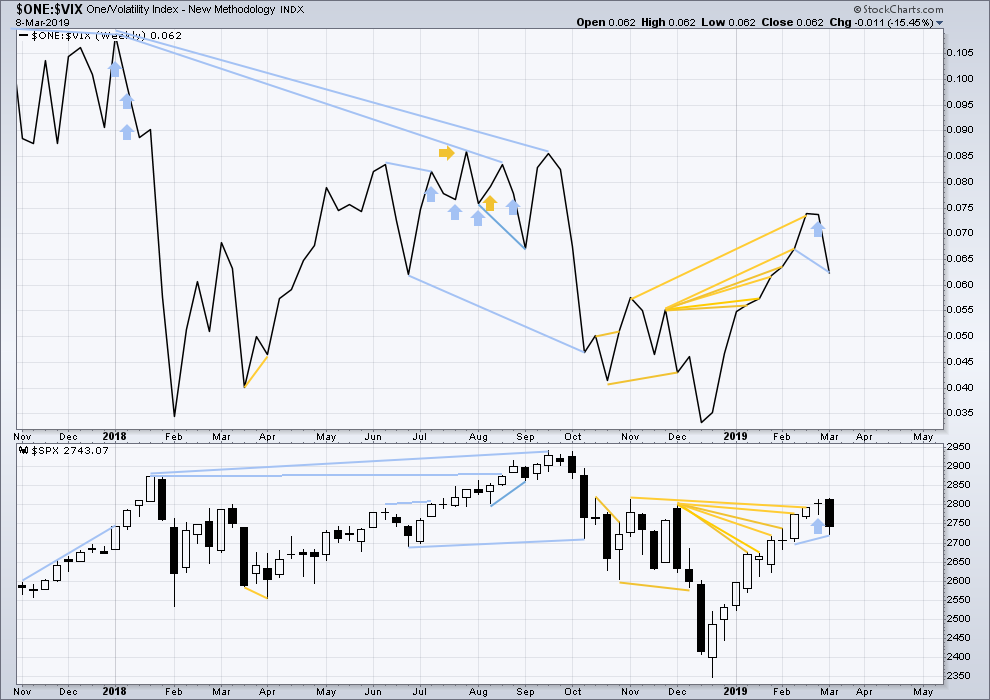
Inverted VIX has made a new low below the prior low of the week beginning 11th of February, but price has not. This divergence is bearish.
DAILY CHART
Click chart to enlarge. Chart courtesy of StockCharts.com. So that colour blind members are included, bearish signals
will be noted with blue and bullish signals with yellow.
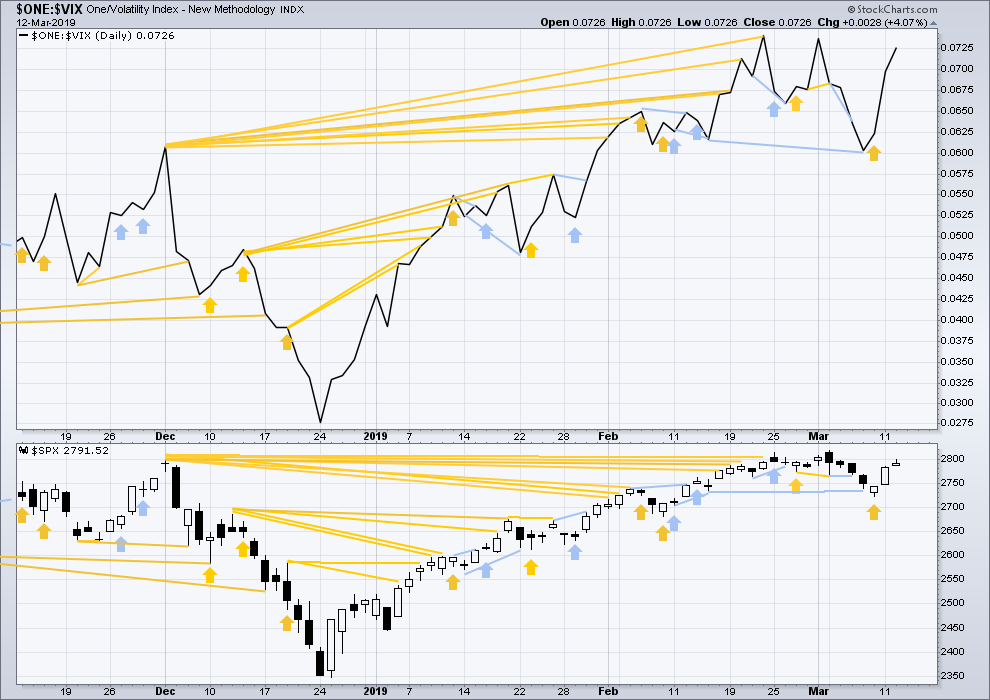
Today both price and inverted VIX again moved higher. However, inverted VIX is moving higher faster than price, so there is a little bullish divergence that supports the alternate daily Elliott wave count. But this is not a very reliable indicator and it is given only a very little weight today in this analysis.
DOW THEORY
Dow Theory confirms a bear market. This does not necessarily mean a bear market at Grand Super Cycle degree though; Dow Theory makes no comment on Elliott wave counts. On the 25th of August 2015 Dow Theory also confirmed a bear market. The Elliott wave count sees that as part of cycle wave II. After Dow Theory confirmation of a bear market in August 2015, price went on to make new all time highs and the bull market continued.
DJIA: 23,344.52 – a close on the 19th of December at 23,284.97 confirms a bear market.
DJT: 9,806.79 – price has closed below this point on the 13th of December.
S&P500: 2,532.69 – a close on the 19th of December at 2,506.96 provides support to a bear market conclusion.
Nasdaq: 6,630.67 – a close on the 19th of December at 6,618.86 provides support to a bear market conclusion.
With all the indices moving now higher, Dow Theory would confirm a bull market if the following highs are made:
DJIA: 26,951.81
DJT: 11,623.58
S&P500: 2,940.91
Nasdaq: 8,133.30.
Published @ 06:07 p.m. EST.
—
Careful risk management protects your trading account(s).
Follow my two Golden Rules:
1. Always trade with stops.
2. Risk only 1-5% of equity on any one trade.

Today we got a big bullish signal from the charts. It’s the 3 candle signal that’s boxed in on this chart. The last time we saw this signal I posted that it could be the signal for a “monster rally”.
As much as I would love to see a panic selloff, I refuse to allow myself anywhere near a short trade with this signal on the chart.
For the SPX, the target from the December low was taken out today around 2 PM. That was at 2820.40
However, the ES target for the current contract is about 50 points higher than where we are right now. So, that’s somewhere it could rally to. It seems odd that the two targets are that far apart, but it is very typical.
The chart is screaming BUY ME and I’m wondering where that will take us. 50 points higher or 230 points higher all the way to Lara’s target of SPX 3045.
It’s very possible that there will be a pullback from the present level to make a long entry. If I could pick my entry spot, it would be about 50 points lower than we are at now. Not a prediction, just a spot that I would love to be at.
Well, all the Max 8 737’s are sitting on the ground now. For many months, I would expect. So ya’ll with air travel plans don’t have to worry (though I suppose your flight might be cancelled!).
Today the difference between the two remaining wave counts will be decided upon by the strength or weakness in upwards movement today.
If there is support from volume and new highs from price and the AD line both, that would indicate strength.
If there is weak volume, lower ATR and any divergence between price and one or more of the AD line, VIX, On Balance Volume or RSI, that would indicate weakness. It’s not that all of this needs to be seen, I’ll look at each indicator and make an overall judgement.
It’s possible primary 2 continues as an expanded flat or double combination. A target is calculated for the expanded flat. In the first instance I’d want to see the narrow blue Elliott channel breached by downwards movement to have any confidence the upwards wave labelled intermediate (B) or (X) is over.
It’s also possible primary wave 2 was over and remarkably brief and shallow.
Is there a viable alternative here that has what you’ve marked as a primary 2 down instead being a lower degree 4, perhaps an intermediate (4) and matching the intermediate (2)? I have trouble with such an insubstantial “primary” 2.
Yes, there are at least two more I’ve charted.
With a number of little pullbacks and consolidations now within this upwards wave, there are multiple ways to label it.
I’ll pick the ones that fit best with MACD and have the best fit for EW subdivisions.
Aaaannnd…! VIX confirms!
Well there you have it traders…enjoy your evening! See ya! 🙂
Good to have you back full throttle Verne 🙂
😉
Whaaaaaat? Right as things start getting interesting?
I managed a nice short bite of that initial jag down, using Friday puts because I really don’t think the short side here is going all that far, so I’m just scalping at the 1/5 minute level. And I’ll try longs on clean turns off key fibo levels + buy triggers.
Verne, always enjoy your comments but for my less sophisticated mind WHAT does VIX confirm?
Great question… I’d like to confirm the opening price of 14.00-
If it’s a real print, A higher close would show a red dog reversal on the daily chart- as well as a rebound off the lower bolinger band.
At the time Verne posted, the SPX was in the green by about 0.60%, but VIX was turning positive also. Which is bearish divergence. The VIX didn’t close in the green, so the bearish divergence is gone now…
But I think that’s what he meant by that comment… It was confirming a turn in the market at that time… I wish it closed green, since I went short near the highs of the day, so I have some wiggle room to close the position if we turn back up today… But if VIX would have closed green, that would have been a gift, if you have your shorts on…
Beautiful rising wedge…the end is near…! 🙂
Hope so…
Yeah let’s not get ahead of ourselves guys… we all know the market isnt going to tank until both mitch and I capitulate- if youd like to speed that up please visit our ‘mitch and hokipa throw in the towel’ go fund me page
Also excepting bitcoin ?
LOLOLOLOL!
LMAO! Being a bear is tough these days… I recall the adage “The Market Can Remain Irrational Longer Than You Can Remain Solvent…”
MITCH heres my daily KISS chart. (With enhanced graphics) Given my experience we will end the week in the middle of the weekly bar.
We could be tracing out an ED….
The run up from the low on Friday has a pretty clean 5 wave structure on the 5 minute, now approaching completion. IMO.
This…
With NDX at new high, it does seem like 5th wave instead of a B wave, i guess in the 5th of 5th targeting 2829ish 107 points from recent lows of 2722 (0.618 of 173, 1st wave)??
Any thoughts?
I think that idea should definitely be considered… the last correction may have been intermediate 4, with intermediate 5 just finishing…
Show that on a chart for us to see
Sorry in office and in my mobile, will chart post later but the concept is I3 finished at 2813ish then I4 was expanded flat with B wave high of 2816ish and we are now in the I5…
Sorry for the mistakes, posted in hurry…
Just my opinion and based on the action, if i am correct then we are in the minor 4 of I5, should end around 2805-2810ish then the final wave to around 2829 or may be slightly higher but i could be entirely wrong ?
This MONTH seems to like proving everyone wrong. I wish I would have gone on vaca
Was that an itsy bitsy ED?
Doesn’t the theory of “Efficient Markets” make you smile?
Who , I wonder is buying the BA dip??!!
Yes, the theory of “Efficient Markets” gets a big eye roll from me. It was first proposed in 1900, just a few years after the discovery of the electron (true). It assumes that markets can never be manipulated or controlled. They never saw this coming, now did they?
Yesterday’s BA trade was over $ 14 billion.
Liquidated all long position here. Too old and slow to pick pennys up in front of a steam roller on 4s and 5s. Think ill sit back and watch for the inevitable turn.
Triangles do tend to be penultimate patterns….
Hey Tradeshark, your timing is exquisite!
Are you related to the Great White? Hehe!
LOL
Buying back another 1/4 277 short puts.
If we close above 2820, will roll up remaining 1/4 to 278 strike and widen bull put spread by one point with sale of additional 278 strike puts.
Next 1/4 at 2815 and last quarter on any move back below 2800….
nice trading Verne! 🙂
As requested…! 🙂
Now THAT, is a thrust!
‘Bout time!!! 🙂 🙂
Buying back another 1/4 277 short puts. Not quite 2810 but close enough for guvmint work!
I like AVGO to the long side here. The monthly and weekly trends are both up. The daily trend is down…but daily bars are moving up. The hourly has just shifted from neutral to UP. So a long here entered with a view of the hourly is “with the trend” re: the weekly/monthly, and buying on a pullback/turn on the daily. It appears to me at the hourly to have completed some kind of little i-ii and is launching a iii up. I’ve sold puts at 260 for April.
Here’s the daily chart. I like it coming up off the lower volatility band (lower purple line, an average of Bollinger and Keltner band levels), and has come up through the 5 period EMA (white) which has turned up. And the turn is off overlapped 38% and 50% fibo levels. This is bread and butter for me…though there’s never a guarantee!
Haha! Bulls saying:
“Not quite so fast!”
Attempting to push past top of wick with a fat green candle.
Will they succeed?
RUT has been the weakest index.
If we are going to see any red today, it will likely show up there first…
Now we look for VIX to confirm….
“That’s all she wrote!” 🙂
Hey Rod, we may not quite get to 2815 my man.
See that ES wick?
Uh, Oh…!!!! 🙂
I’ve closed my IWM and SPX long bites today, perhaps a tad early but…bites are bites. Nicely profitable there, but sadly, I had a SPY short I had to close as well at a loss so…perfection awaits for another day! Looks like SPX is insisting on tagging (at least) the overlapped fibos at 2718-20.
Buying back 1/4 SPY 277 short puts of 276/277 bull put credit spread. Next 1/4 after we clear 2810….
You’ve just got to love the free market!
Flying customers by the thousands are attempting to find out if they are booked to fly on the Max 8, and if they are….Sayonara!
Meanwhile the corruptocrats at the FAA and Boeing dawdle….
I have a funny feeling unless they get a handle on this, that order backlog is going to substantially shrink!
Yes, over 4,000 jet liners on order. That’s a lot of $’s.
I sure would not want to fly on the Max 8 right about now.
With regards to the market, I am thinking one more push to about 2815 and then the wave down begins in earnest.
Rod…you the man! 🙂
Hey Rodney,
As long as we’re picking tops, I’ll throw my hat in the ring at SPX 2820.40
If the news about previous pilot complaints about ” safety flaws” in the BA 737 Max 8 turn out to be correct, BA is going to do a lot more than connect with important MAs after a long time trading at an extraordinary distance from them. Huge implications for DJIA. FB is also going to take a serious hair-cut as news of their dirty deeds become public…’nuff said! 😉
Wouldn’t you just love to be a fly on the wall in the Damage Control meetings of either company right now. Facebook is not a darling in Washington D.C. But Boeing has connections galore in the Deep State especially in the Department of Defense. I can just bet they are designing a cover up right about now, no matter how much it costs.
Sadly true my friend….sadly true! 🙁
perhaps, but FB and AAPL are in strong motive waves up.
I have a truckload of FB leaps. Adding on the way up.
Apple is also clearly in a bear market….
Perhaps. I have AAPL at neutral trend at the monthly level (never has gone to “down” through the late 18 sell off), and the weekly trend is now in week 5 of neutral. Daily is solid up for a few months now. I think there’s a lot of upside in AAPL over at least the next few months, myself. The retrace up is past the 38% at 177, and the next really logical likely turn point is the 61.8% at 198. Price is 181 now. So yea, I think AAPL is bullish here for the short-intermediate term.
The market, (aka banksters) aims to confuse and misdirect the most at any given time. I think we need a new high. Every trader is watching this sideways consolidation and positioned for an anticipated upside break.
I am therefore expecting an initial downside break to stop out longs, and entice bears, followed by yet another violent reversal as we head to final upside targets. Just one man’s humble opining! 🙂
Here is something right up our alley. It’s today’s Seeking Alpha SPX Elliott Wave Analysis. After going over this, it strengthens my confidence in Lara.
https://seekingalpha.com/article/4248056-s-and-p-500-elliott-wave-analysis
Thank CM. Nice article. I read with interest articles that support the idea of a turn down in the market. Yet, the market continues to have other ideas and keeps on climbing. I am thinking we are at a last stand for the bearish scenario right about now. Could this be the time to take up or add to short positions?
The Shadow knows!
It seems like we’re either gaping up or gaping down tomorrow. From Chartmonkey’s input on last analysis, and the lack of conviction in the last hour or so today to the upside, it would seem we should see lower prices tomorrow.
Bulls had many opportunities all day to take prices past SPX 2800, and didn’t…
Most likely gap down. Action is down in early overnight session (hourly /ES shown with overnight data). Hourly trend is strong down now, and MACD has been solidly down for a full day.
The move down turned on a 23.6% of one of the prior bull period upswings, and the move back up turned on top of the 78.6% of the move down. /ES is rather clean relative to turning at defined fibo levels vs. “anywhere”.
Unless we pretty quickly see a break of the 2726 area low, this is going to look much more like “backing and filling” consolidation before more upward movement. If price breaks down and undercuts 2726, maybe we get some more serious downwards action.
I agree that we’re probably gaping down tomorrow, and I also think wherever the downside goes to will be the end of minor B, with a minor C wave up needed to finish intermediate B. So basically we’ll be in a B wave of a B wave.
So I agree with your view and also Verne’s above. Down first to trap the longs, after which an impulse up to trap the shorts, and then intermediate C may begin.
Let’s see how this plays out 🙂
so much for that prediction! lol
Most times, the move out of this coil pattern is up…. 🙂