
The 200 day moving average has rolled over today. It is again positively sloped.
The alternate Elliott wave count has been invalidated, which gives further confidence in the main Elliott wave count.
Summary: The target for intermediate wave (1) to end is at 2,673 with a limit at 2,731.32. The target may be met in another very few sessions.
The bigger picture still expects that a low may now be in place. Further confidence in this view may be had now that price has made new high above 2,631.09. The target is at 3,045 with a limit at 3,477.39. The Elliott wave count has support from strongly rising market breadth and a 90% up day on the 4th of January.
New updates to this analysis are in bold.
The biggest picture, Grand Super Cycle analysis, is here.
The monthly chart was last published here.
ELLIOTT WAVE COUNT
WEEKLY CHART

Click chart to enlarge.
This weekly chart shows all of cycle waves III, IV and V so far.
Cycle wave II fits as a time consuming double combination: flat – X – zigzag. Combinations tend to be more time consuming corrective structures than zigzags. Cycle wave IV has completed as a single or multiple zigzag that should be expected to be more brief than cycle wave II.
Cycle wave IV may have ended at the lower edge of the Elliott channel.
Within cycle wave V, no second wave correction may move beyond the start of its first wave below 2,346.58.
Although both cycle waves II and IV are labelled W-X-Y, they are different corrective structures. There are two broad groups of Elliott wave corrective structures: the zigzag family, which are sharp corrections, and all the rest, which are sideways corrections. Multiple zigzags belong to the zigzag family and combinations belong to the sideways family. There is perfect alternation between the possible double zigzag of cycle wave IV and the combination of cycle wave II.
Although there is gross disproportion between the duration of cycle waves II and IV, the size of cycle wave IV in terms of price makes these two corrections look like they should be labelled at the same degree. Proportion is a function of either or both of price and time.
Draw the Elliott channel about Super Cycle wave (V) with the first trend line from the end of cycle wave I (at 2,079.46 on the week beginning 30th November 2014) to the high of cycle wave III, then place a parallel copy on the low of cycle wave II. Cycle wave V may find resistance about the upper edge.
DAILY CHART

Click chart to enlarge.
The daily chart will focus on the structure of cycle waves IV and V. The alternate was invalidated today with a new high above 2,631.09, adding more confidence to this main wave count.
Cycle wave IV may be a complete double zigzag. This would provide perfect alternation with the combination of cycle wave II. Double zigzags are fairly common corrective structures.
Within Super Cycle wave (V), cycle wave III may not be the shortest actionary wave. Because cycle wave III is shorter than cycle wave I, this limits cycle wave V to no longer than equality in length with cycle wave III at 3,477.39. A target is calculated for cycle wave V to end prior to this point.
Cycle wave V must subdivide as a five wave motive structure, either an impulse or an ending diagonal. An impulse is much more common and that will be how it is labelled. A diagonal would be considered if overlapping suggests it.
Within the five wave structure for cycle wave V, primary wave 1 would be incomplete. Within primary wave 1, intermediate wave (1) may be incomplete. The degree of labelling within cycle wave V may need to be adjusted as it unfolds further. At this stage, an adjustment may be to move the degree of labelling within cycle wave V up one degree; it is possible that it could be primary wave 1 now close to completion.
Within cycle wave V, no second wave correction may move beyond the start of its first wave below 2,346.58.
HOURLY CHART

Click chart to enlarge.
Intermediate wave (1) may be incomplete and may be unfolding as an impulse.
Within the impulse, minor waves 1 to 4 may now be complete. There is perfect alternation between a shallow 0.42 zigzag for minor wave 2 and a much more shallow 0.10 triangle for minor wave 4. Minor wave 2 lasted 27 hours and minor wave 4 lasted 25 hours; their proportion is close to perfect in terms of time.
Within this wave count, minor wave 3 is shorter than minor wave 1. Third waves may never be the shortest actionary wave. Minor wave 5 would be limited to no longer than equality in length with minor wave 3 at 2,731.32, so that this core Elliott wave rule is met.
Minor wave 5 may be unfolding as an impulse. The alternate hourly chart published yesterday, where minor wave 5 was considered as an ending diagonal, is now invalid. An ending diagonal may not be complete at today’s high because the third wave within it would be the shortest, violating a core Elliott wave rule. This adds a little confidence to this main hourly wave count today.
Within minor wave 5, minute waves i and ii may be complete. Minute wave iii may only subdivide as an impulse; this structure would still be incomplete.
Within minute wave iii, minuette waves (i) and (ii) would be complete. Minuette wave (iii) may only subdivide as an impulse, which would be incomplete. Within minuette wave (iii), no second wave correction may move beyond the start of its first wave below 2,606.36.
TECHNICAL ANALYSIS
WEEKLY CHART
Click chart to enlarge. Chart courtesy of et=”_blank”>StockCharts.com.
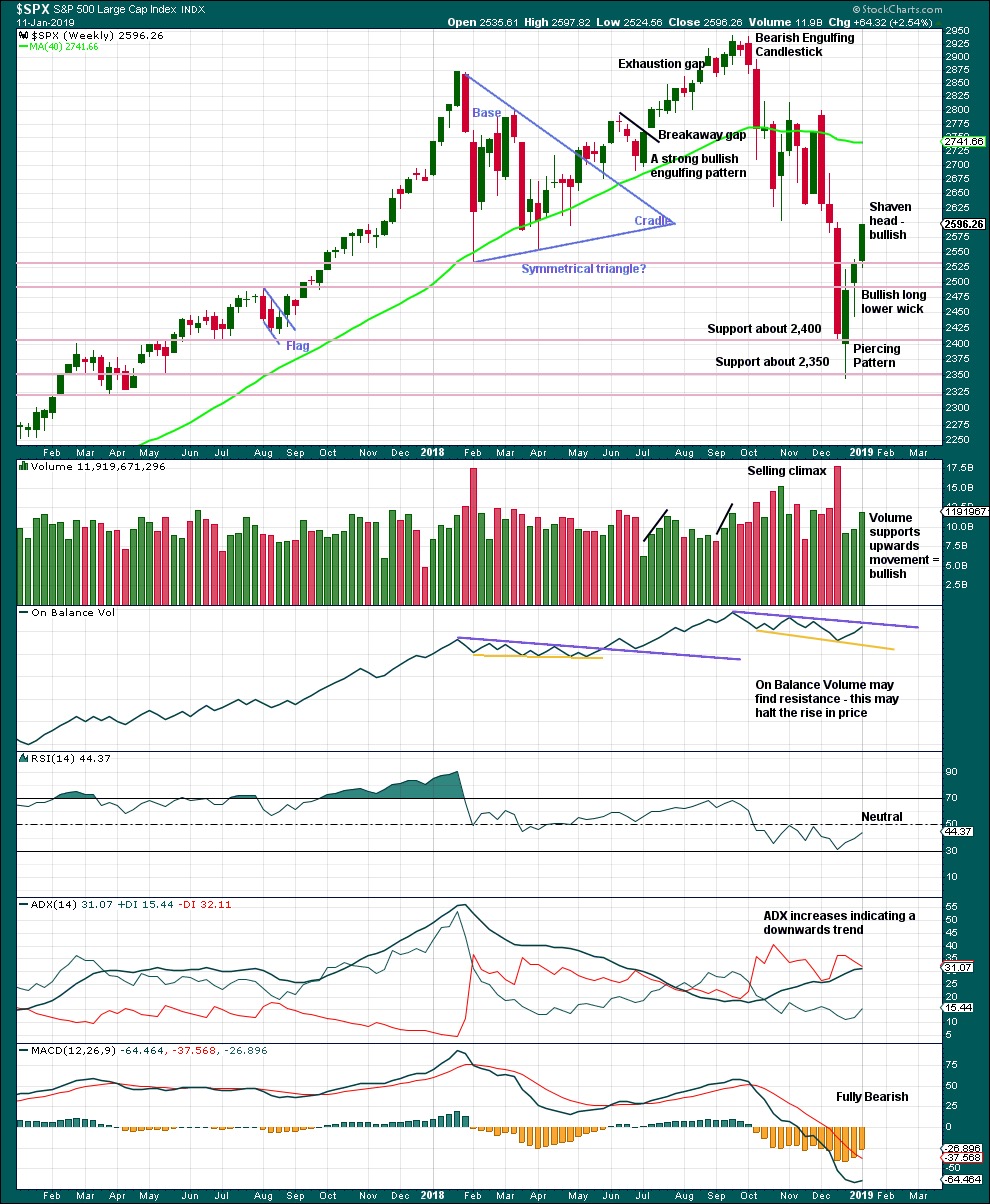
From the all time high to the low of last week, price moved lower by 20.2% of market value meeting the definition for a bear market.
It should be noted that the large fall in price from May 2011 to October 2011 also met this definition of a bear market, yet it was only a very large pullback within a bull market, which so far has lasted almost 10 years.
The last weekly candlestick with a shaven head and good support from volume strongly suggests more upwards movement this week.
DAILY CHART

Click chart to enlarge. Chart courtesy of StockCharts.com.
Over a fairly long period of time this ageing bull market has been characterised by upwards movement on light and declining volume and low ATR. For the short to mid term, little concern may be had if price now rises again on declining volume. Current market conditions have allowed for this during a sustained rise in price.
It is also normal for this market to have lower ATR during bullish phases, and strongly increasing ATR during bearish phases. Currently, declining ATR is normal and not of a concern.
Considering the larger picture from the Elliott wave count, some weakness approaching the end of Grand Super Cycle wave I is to be expected.
From Kirkpatrick and Dhalquist, “Technical Analysis” page 152:
“A 90% downside day occurs when on a particular day, the percentage of downside volume exceeds the total of upside and downside volume by 90% and the percentage of downside points exceeds the total of gained points and lost points by 90%. A 90% upside day occurs when both the upside volume and points gained are 90% of their respective totals”…
and “A major reversal is singled when an NPDD is followed by a 90% upside day or two 80% upside days back-to-back”.
The current situation saw two 80% downside days on December 20th and 21st, then a near 90% downside day with 88.97% downside on December 24th. This very heavy selling pressure on three sessions very close together may be sufficient to exhibit the pressure observed in a 90% downside day.
This has now been followed by two 90% upside days: on December 26th and again on 4th January.
The current situation looks very much like a major low has been found.
Today price has broken back into a consolidation zone with support about 2,600 to 2,625 and resistance about 2,800 to 2,815. The 200 day moving average now has a positive slope.
BREADTH – AD LINE
WEEKLY CHART
Click chart to enlarge. Chart courtesy of StockCharts.com. So that colour blind members are included, bearish signals
will be noted with blue and bullish signals with yellow.
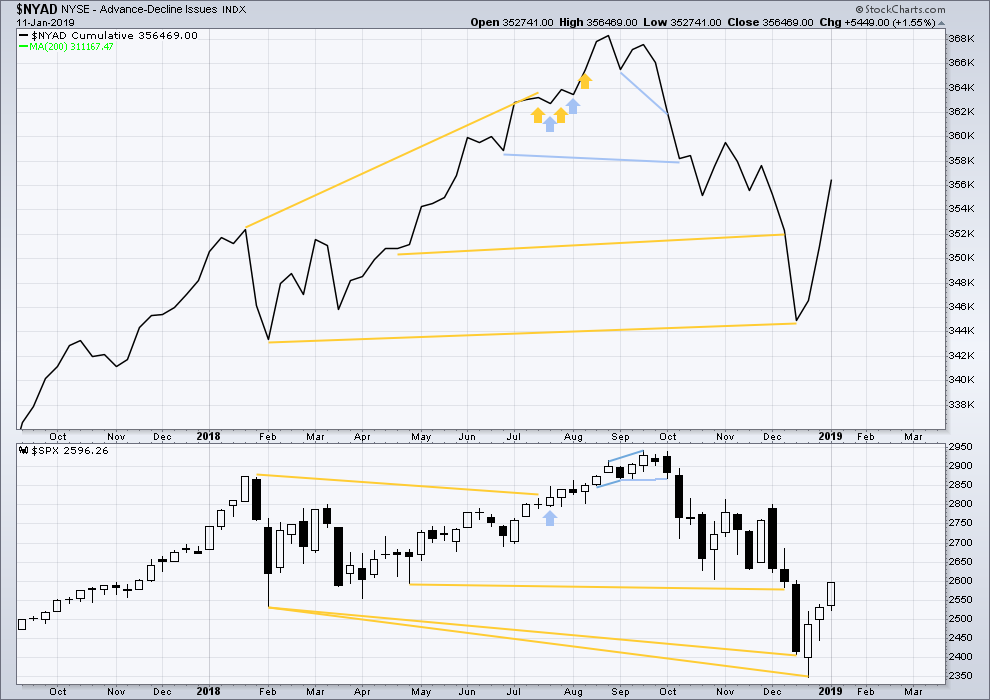
Upwards movement has support from rising market breadth.
DAILY CHART

Click chart to enlarge. Chart courtesy of StockCharts.com. So that colour blind members are included, bearish signals
will be noted with blue and bullish signals with yellow.
Breadth should be read as a leading indicator.
There is now a cluster of bullish signals from the AD line. This supports the main Elliott wave count.
Today the AD line has made a new swing high above the prior high of the 12th of December 2018, but price has not. This divergence is bullish for the mid term.
VOLATILITY – INVERTED VIX CHART
WEEKLY CHART
Click chart to enlarge. Chart courtesy of StockCharts.com. So that colour blind members are included, bearish signals
will be noted with blue and bullish signals with yellow.
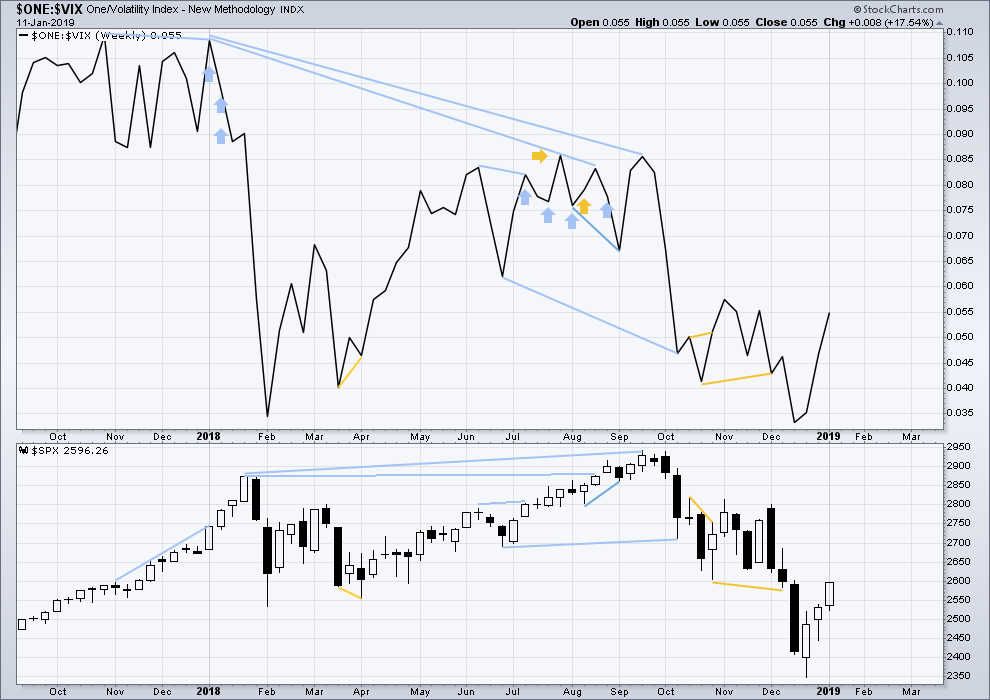
Upwards movement has support from a corresponding decline in VIX. There is no divergence.
DAILY CHART

Click chart to enlarge. Chart courtesy of StockCharts.com. So that colour blind members are included, bearish signals
will be noted with blue and bullish signals with yellow.
There is now a cluster of bullish signals from inverted VIX. This supports the main Elliott wave count.
Bearish divergence noted for the short term in yesterday’s analysis has not been followed by any downwards movement. It is considered to have failed.
Today inverted VIX has made another new high above the prior swing high of the 12th / 13th of December 2018, but price has not. This divergence is bullish.
DOW THEORY
Dow Theory confirms a bear market. This does not necessarily mean a bear market at Grand Super Cycle degree though; Dow Theory makes no comment on Elliott wave counts. On the 25th of August 2015 Dow Theory also confirmed a bear market. The Elliott wave count sees that as part of cycle wave II. After Dow Theory confirmation of a bear market in August 2015, price went on to make new all time highs and the bull market continued.
DJIA: 23,344.52 – a close on the 19th of December at 23,284.97 confirms a bear market.
DJT: 9,806.79 – price has closed below this point on the 13th of December.
S&P500: 2,532.69 – a close on the 19th of December at 2,506.96 provides support to a bear market conclusion.
Nasdaq: 6,630.67 – a close on the 19th of December at 6,618.86 provides support to a bear market conclusion.
Published @ 07:08 p.m. EST.
—
Careful risk management protects your trading account(s).
Follow my two Golden Rules:
1. Always trade with stops.
2. Risk only 1-5% of equity on any one trade.
It does seem that the feds balance sheet has made a u turn the last month …
Wonder what made them change their minds ….:)
They had all those “on auto-pilot “ talk on the QT
But they were buying the whole time … which changes the field big time …
I’m going to be short a lot of spy from today’s calls 264 and 265 strike …not feeling too great…may have to take a little more pain
My vix 37 puts sales wound up clean
And my TSLA and NFlX upside calls sales and down side put spreads paid…
So only “full short “…left now is the spy shares
Did put in another batch of vxx put sales at 37 and 36 strike for next week…
With some near money call spreads …
I hate going long vol…. but couldn’t help myself…
Covered 1/2 my spy shorts..@263.25
Nice red morning …:)
Closed the vxx 37 short puts
Closed 1/2 vxx call spreads
Covered another 1/4 of those spy shorts @262
Took out another 1/4 of the vxx call spreads
Closed the vxx 36 short puts
One of my better days in a while ..:)
Hourly chart updated:
The target is not yet met and the structure for minor 5 is incomplete. I’m going to be expecting more upwards movement next week.
The measuring gap at today’s open may be used to calculate a target also. I’ll do that in end of week analysis.
In my chart the target looks to be achieved; I see a high of 2675.47 today at approx 12:25 est… what am I missing?
Nothing; that target is now exceeded, and if there is renewed upward price action, dead.
Nothing. I was wrong. The target is met.
But I still can’t see a completed structure.
I will take some time later though to look on the 5 minute chart.
I am looking at the $Compq ….Any thoughts on a rising wedge.
RUT is pretty clearly in a minor wave v up now on the daily chart. We know SPX is in the same. And in SPX’s case, while there’s more room to go…we know the move is limited because wave 3 is smaller than 1. That puts the max of SPX’s move around 2745. But that’s dead space…a more likely turn point under that is 2713 where there are overlapped 78.6% and 61.8% fibo levels.
thanks for the update…. love those overlapped fibos!!!
What’s your target for the RUT Kevin
At 5 == 1 it’s about 1522, and there a 78.6% just under that around 1519.
So I’d say 1519.
Fib extension reached
Bonds (TLT, 20 year) in 11th day of a renewed move down, and my daily level trend indicator has just gone to “strong down”. Tracking under a good trend line (shown). Approaching the larger up trend line (shown), and will meet it very close to the 38%. Breaking down and through could indicate much deeper move here, which would arguably be in line with the higher tf secular trend. Though in fact my weekly trend indicator is “up”, and my monthly is showing a reversal bar for this month which is “neutral”. Ergo, I like the bear side here.
NDX clearly has broken it’s major down trend line.
However, it’s now pushing into a massive cluster of fibo retrace levels. A major pivot high in this price zone would satisfy a lot of fractal behavioral requirements. That’s not to say it’ll happen, only that it should be watched for carefully next week.
I’ll add…if NFLX was a leading indicator, perhaps there’s sequence of misses by the FAANGM group in earnings over the next 2 weeks, driving a turn here.
i’m getting repeated data feed drops on Ameritrade/ToS. Gadzooks…
active channel
channel schmannel
Thanks Lara. It appears to me that the Zweig Breadth Thrust Indicator which I pointed out several weeks ago, has provided a good / accurate signal. Bottom of Intermediate 2 will be the next great entry point for long positions.
Hey Scott, I would like to revisit some of your posts from yesterday
… you posted:
———————————————————————————————–
Scott Evans January 16, 2019 at 10:36 am
Markets pulling back a little
This may be the last dip
Before there is one more push up
Then I’m full short …
Scott Evans January 16, 2019 at 10:40 am
I thought there may be one more push from here
But that may have been the top around 2623
Still playing for that one more push before I commit to full shorts
Scott Evans January 16, 2019 at 2:47 pm
This little move back to the 2625 range is feeling like the last push
How far it goes ?
——————————————————————————————————–
Really spot on! The ES tumbled 26 points in the selloff. My question is, what were you seeing that led to this conclusion?
Hey brother
A combination of things
First volatility and vix futures …
I cut my teeth trading volatility through some rough patches from 2008-2009… and then through some choppy waters from 2010-2012
So have a good sense of the relationship between spot vix and timeframes to the monthly rollovers left on the futures contracts ..
I combine that with great analysis of Lara and folks on this board …
Sprinkle in a little psychological feel of position traders and overbought oversold levels …
Which gets harder and harder with the rise of the machines and algos that have no emotion and just push until they can’t
Then.. you just define your areas with the beautiful golden ratios the creator gave us (fib sequences )
Then I usually layer in .. taking advantage of option premiums in short time frames ..
And use those instead of straight by and sell orders to give me a cushion….
And allows me to position for a larger hammer and swing trade if my first tie dips get underwater
Thx!