
Last analysis expected more downwards movement. The next identified support area is very close by.
Summary: It does not look like a low is in place yet. Expect price to continue falling.
A small bounce may unfold here or very soon for the very short term for minor wave 4, which may last one to a very few days. The target for primary wave 4 to end is now about 2,354 where it would correct 0.618 the length of primary wave 3.
New updates to this analysis are in bold.
The biggest picture, Grand Super Cycle analysis, is here.
The monthly chart will be reviewed again today.
MAIN ELLIOTT WAVE COUNT
MONTHLY CHART
Click chart to enlarge.
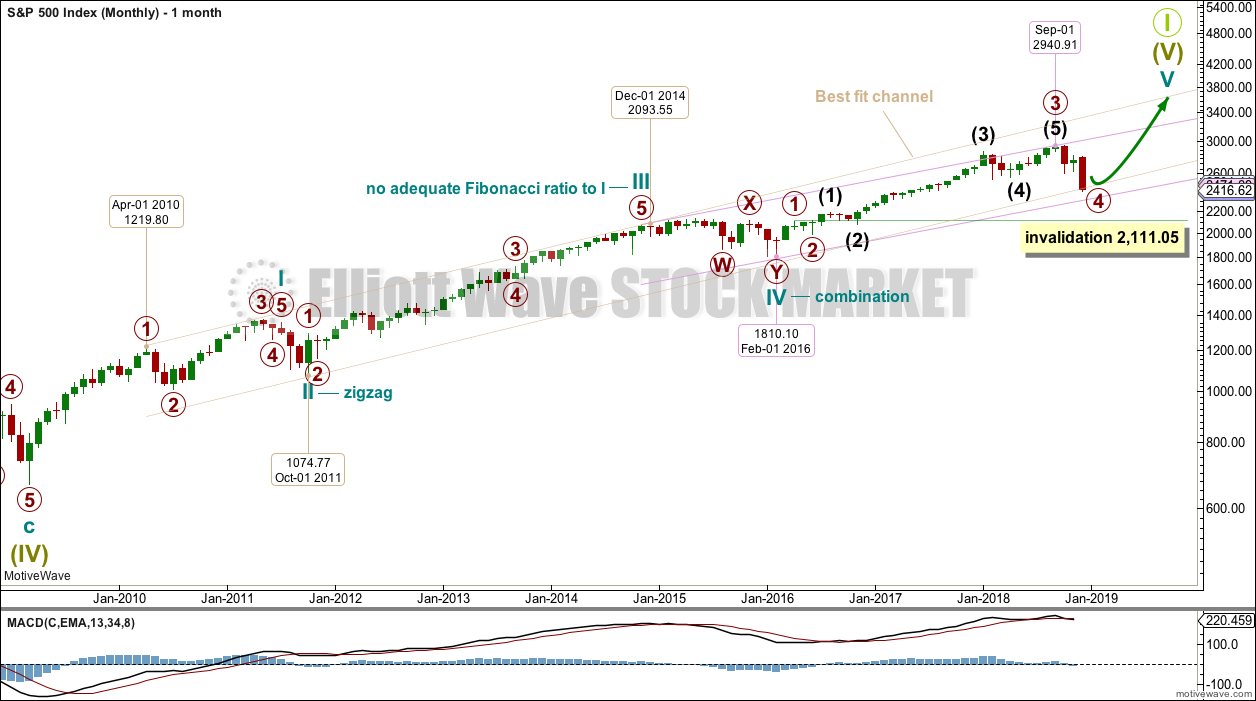
Super Cycle wave (IV) completed a 8.5 year correction. Thereafter, a bull market began for Super Cycle wave (V). The structure of Super Cycle wave (V) is incomplete. It is subdividing as an impulse.
There is no Fibonacci ratio between cycle waves I and III within Super Cycle wave (V). This makes it more likely that cycle wave V will exhibit a Fibonacci ratio to either of cycle waves I or III. Cycle wave V has passed equality and 1.618 the length of with cycle wave I. The next Fibonacci ratio of 2.618 yields a target at 3,616, but this may be too high. It may be better in this case to calculate the target at a lower degree; this will be done on weekly and daily charts.
The S&P does not always fit neatly into channels at the end of bullish movements. It sometimes forms slow rounded tops. When it does this, it may breach a channel to then only to continue on towards new highs and sometimes hug the lower edge of the prior channel as it does so. Therefore, for this particular market, it is sometimes necessary to be flexible with channels.
A best fit channel is drawn in taupe on a semi log scale. Anchor points are shown on the chart so that members may replicate this channel.
A more shallowly sloped channel is drawn about the end of Super Cycle wave V in lilac. Again, anchor points are given so that members may replicate this channel.
Cycle wave II was a shallow 0.41 zigzag lasting three months. Cycle wave IV is seen as a more shallow 0.28 double combination lasting 14 months. Cycle wave II was a sharp movement that travelled a reasonable distance in a short time. Although cycle waves II and IV are disproportionate in terms of duration, the distance covered still gives the wave count the right look. There is excellent alternation between them.
Cycle wave I lasted 28 months (not a Fibonacci number), cycle wave II lasted a Fibonacci 3 months, cycle wave III lasted 38 months (not a Fibonacci number), and cycle wave IV lasted 14 months (one more than a Fibonacci 13).
Cycle wave V is now within its 34th month. The structure needs at least a very few more months to complete. It may continue for as long as another 21 months to total a Fibonacci 55, or it may end sooner and not exhibit a Fibonacci duration.
Within cycle wave V, the correction for primary wave 4 may not move back down into primary wave 1 price territory below 2,111.05.
Primary wave 4 shows up on the monthly chart. This gives cycle wave V the right look.
WEEKLY CHART
Click chart to enlarge.
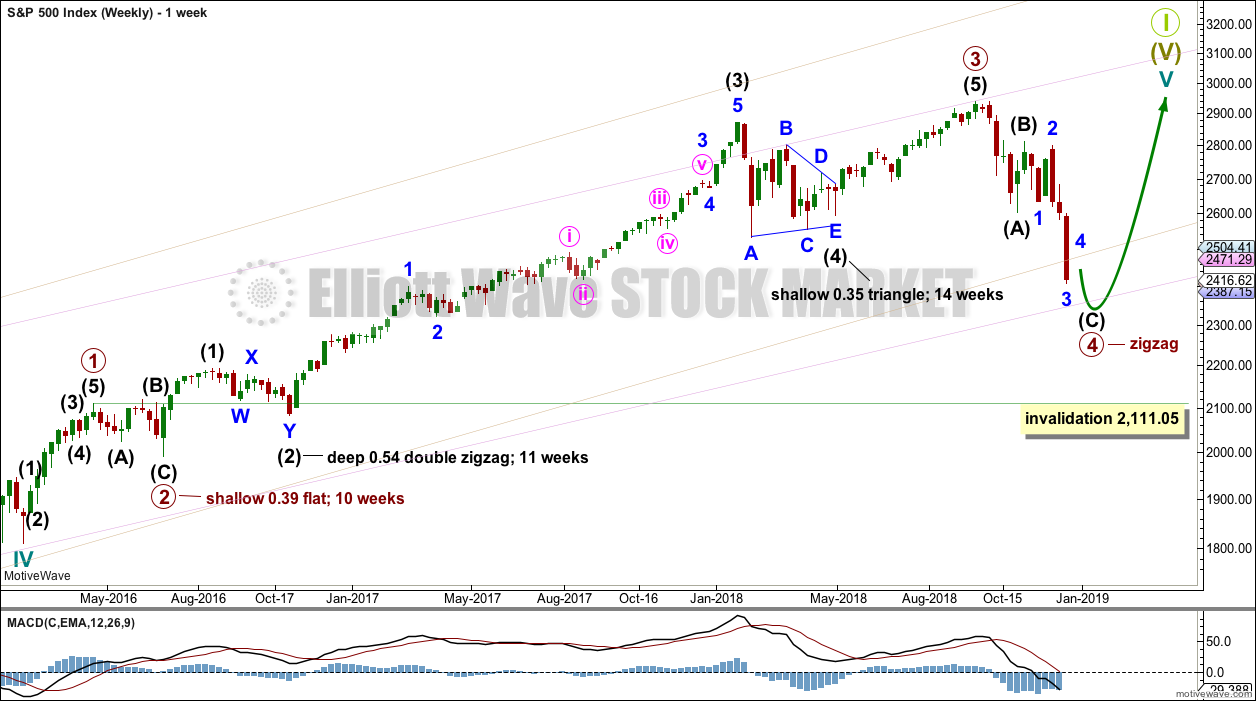
Cycle wave V must complete as a five structure, which should look clear at the weekly chart level and also at the monthly chart level. It may only be an impulse or ending diagonal. It is clear it is an impulse.
Within primary wave 3, there is perfect alternation and excellent proportion between intermediate waves (2) and (4).
This wave count still has the right look at the monthly chart level.
Primary wave 4 may not move into primary wave 1 price territory below 2,111.05.
Channels are copied over from the monthly chart.
If primary wave 4 ends about the 0.618 Fibonacci ratio of primary wave 3 at 2,354, it may find support about the lower edge of the lilac channel.
DAILY CHART
Click chart to enlarge.
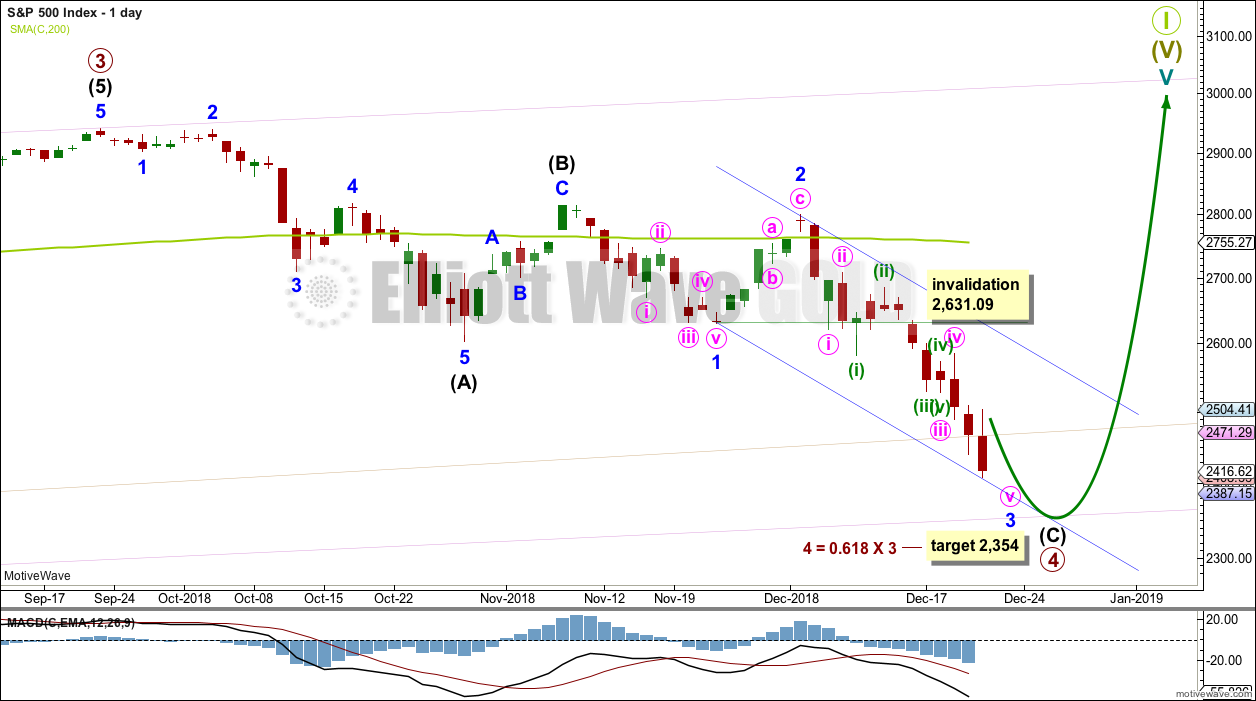
Primary wave 4 looks at this stage to be unfolding as a zigzag that may be nearing completion in the next week or so. Zigzags subdivide 5-3-5 and are the most common corrective structure.
Intermediate wave (C) may be a simple impulse. Within the impulse, minor wave 3 now looks most likely to be incomplete.
When minor wave 3 is complete, then minor wave 4 may unfold over a few days, so that it shows up on the daily chart and gives intermediate wave (C) a five wave look.
Minor wave 4 may not move into minor wave 1 price territory above 2,631.09.
Intermediate wave (C) has passed equality in length with intermediate wave (A). However, if the next Fibonacci ratio in the sequence of 1.618 is applied to intermediate wave (C), then the target would be too low at 2,270.
For now the target will be calculated using the next Fibonacci ratio of intermediate wave (3). When minor wave 4 may be complete, then the target may be calculated at minor degree. At that stage, the target may widen to a small zone or it may change.
HOURLY CHART
Click chart to enlarge.
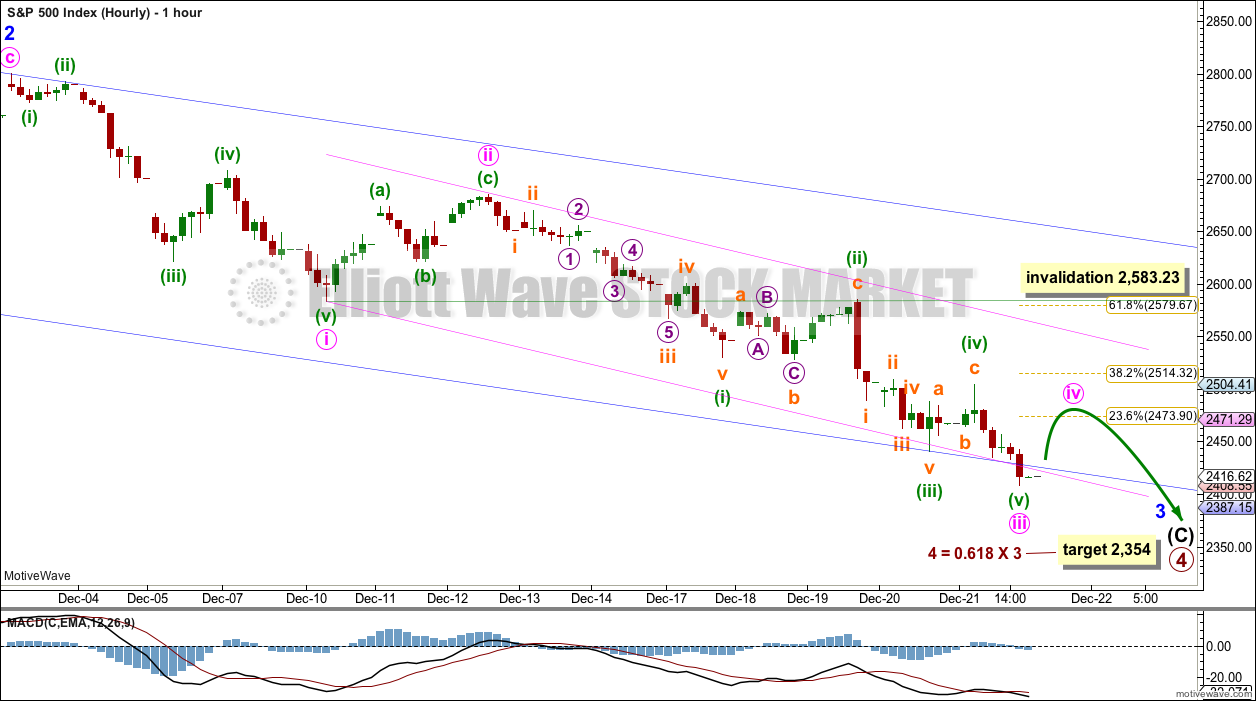
This wave count expects that the middle of minor wave 3 may have passed this week, and minor wave 3 may continue lower next week.
Minor wave 3 has passed 1.618 the length of minor wave 1. The next Fibonacci ratio in the sequence is 2.618 which yields a target at 2,318. This target may be too low.
Within the middle of this third wave, minuette wave (iv) may not move into minuette wave (i) price territory above 2,530.54.
Minute wave ii was over within one session. Minute wave iv may also be complete within a single session.
When minor wave 3 may be seen complete, then a multi-day bounce may be expected for minor wave 4.
TECHNICAL ANALYSIS
WEEKLY CHART
Click chart to enlarge. Chart courtesy of et=”_blank”>StockCharts.com.
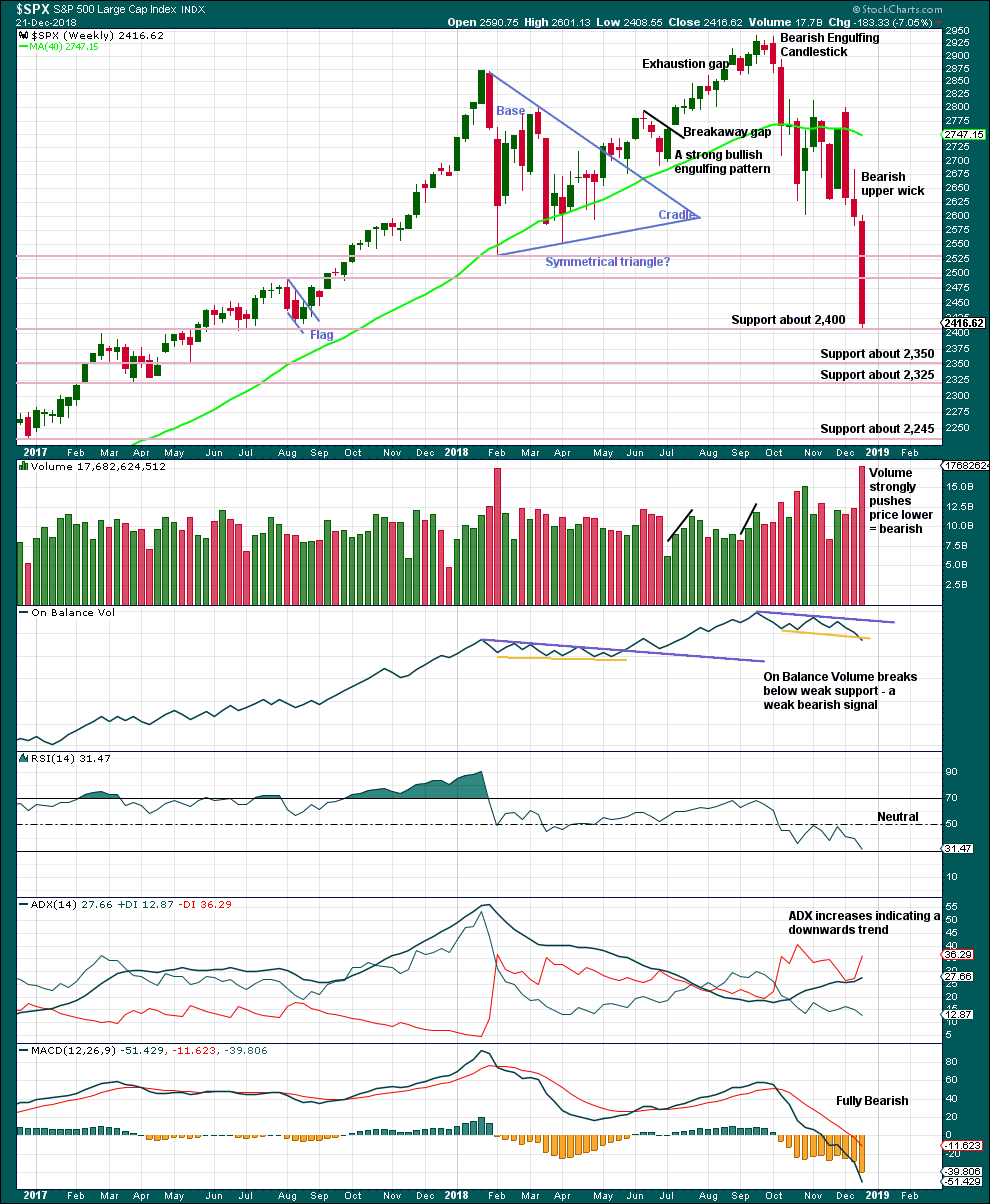
Price has fallen so far 18% from the last all time high.
This last weekly candlestick is very strong indeed. With price closing very close to the low for the week, it looks like more downwards movement may follow next week.
Support lines are identified now on the weekly chart.
This chart is fully bearish.
DAILY CHART
Click chart to enlarge. Chart courtesy of StockCharts.com.
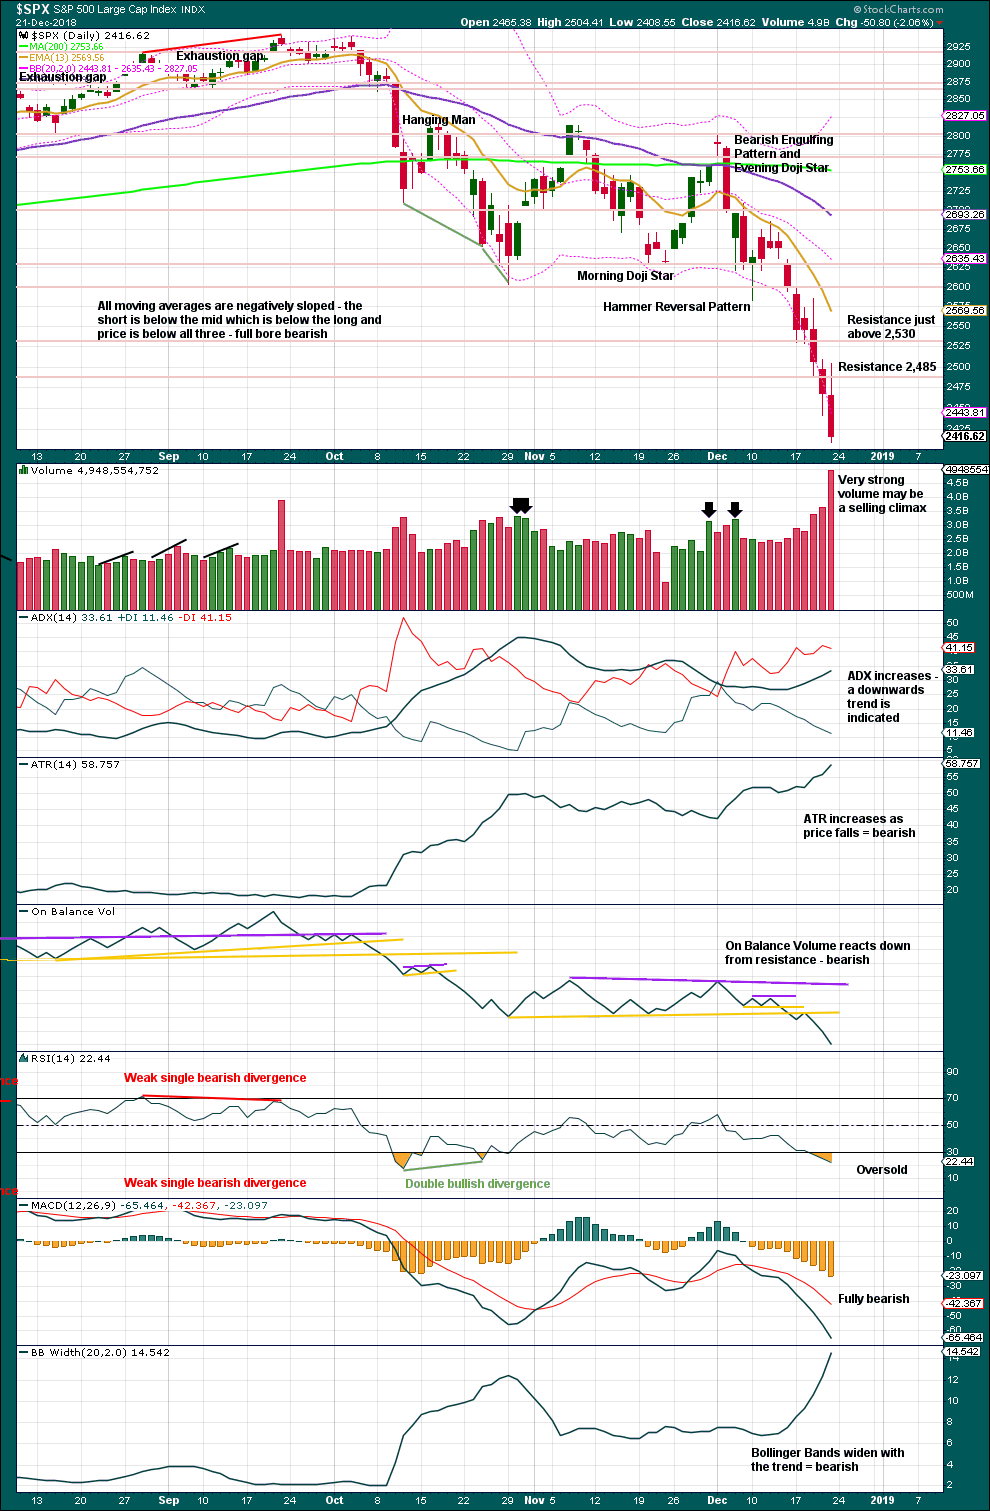
Selling climaxes usually occur close to lows, not at final lows.
Look for a candlestick reversal pattern and / or clear and strong divergence between price and RSI to indicate a potential low. That is not the case today.
This chart remains fully bearish.
BREADTH – AD LINE
WEEKLY CHART
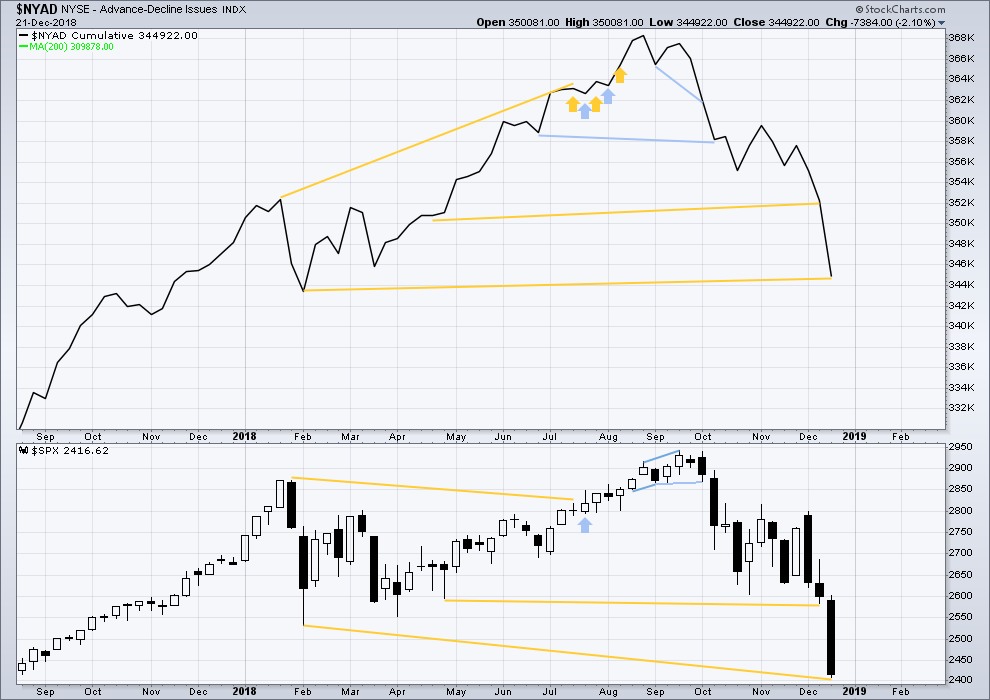
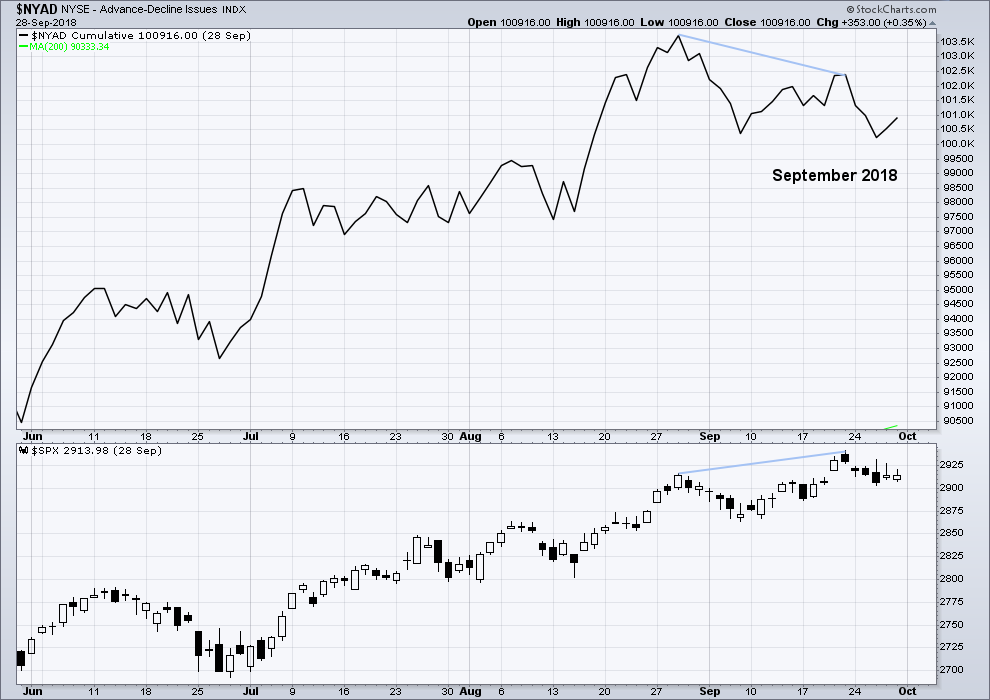
Click chart to enlarge. Chart courtesy of StockCharts.com. So that colour blind members are included, bearish signals
will be noted with blue and bullish signals with yellow.
While price is falling fast, the AD line is not making corresponding new lows. There remains mid-term bullish divergence between price and market breadth.
DAILY CHART
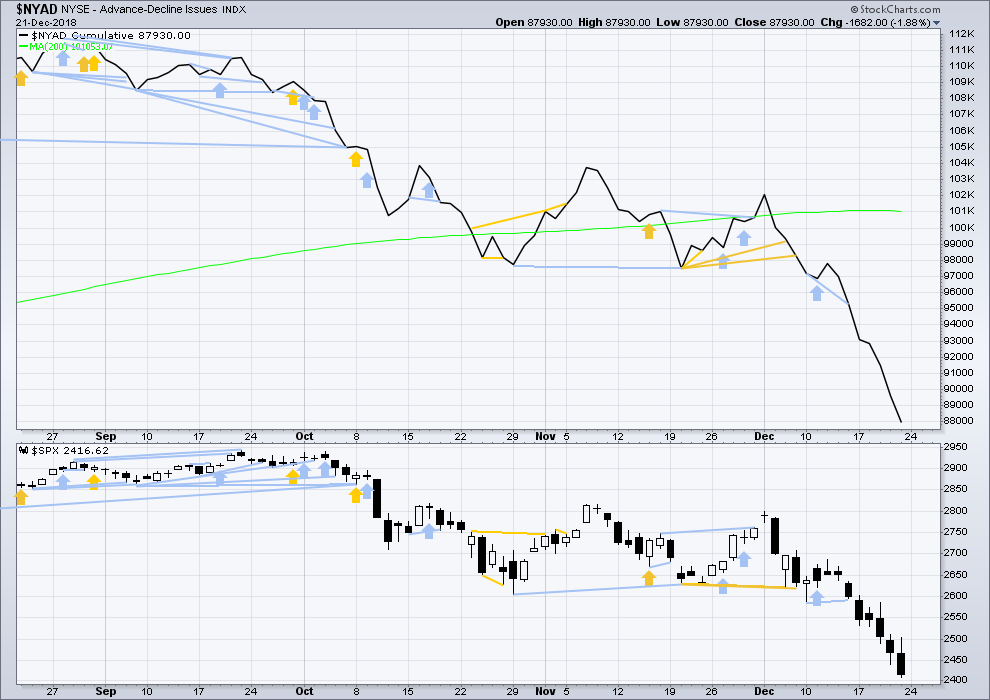
Click chart to enlarge. Chart courtesy of StockCharts.com. So that colour blind members are included, bearish signals
will be noted with blue and bullish signals with yellow.
Breadth should be read as a leading indicator.
Today both price and the AD line have made new lows. There is no divergence.
SUPPLEMENTAL – AD LINE RECENT HISTORY
This exercise looks at how the AD line behaves prior to a fully fledged bear market and compares that to how it behaves prior to a large pullback within a bull market.
There have been three major pullbacks within the current bull market beginning March 2009:
Click chart to enlarge. Chart courtesy of StockCharts.com. So that colour blind members are included, bearish signals
will be noted with blue and bullish signals with yellow.
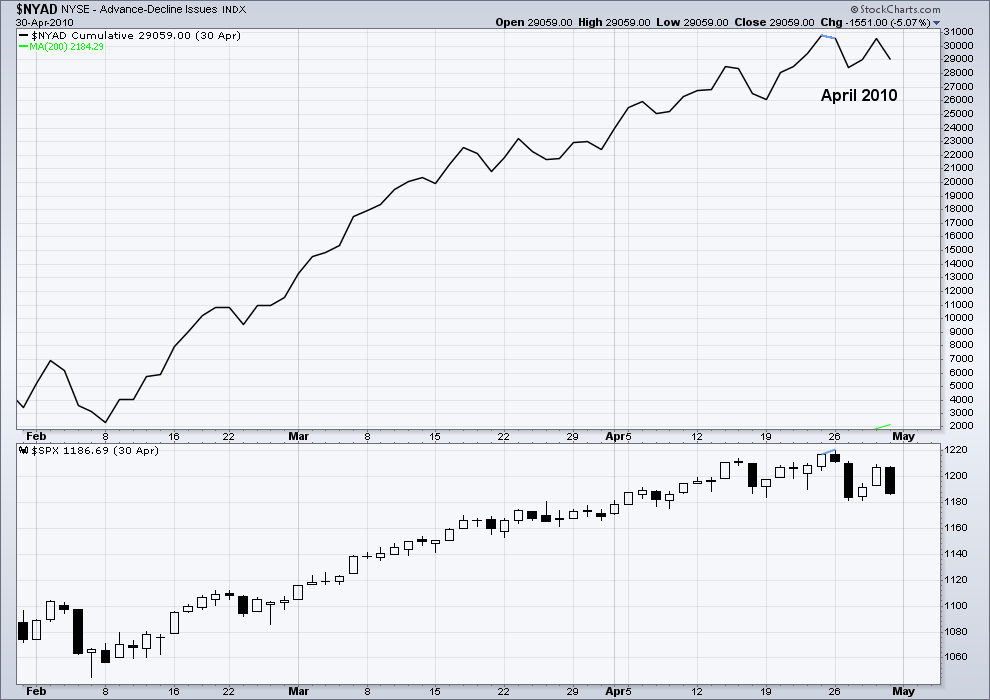
The first major pullback from 26th April 2010 to 1st July 2010 saw price fall 17% of market value over 47 sessions.
There was only one day of bearish divergence between price and the AD line at the high on 26th April 2010.
Click chart to enlarge. Chart courtesy of StockCharts.com. So that colour blind members are included, bearish signals
will be noted with blue and bullish signals with yellow.
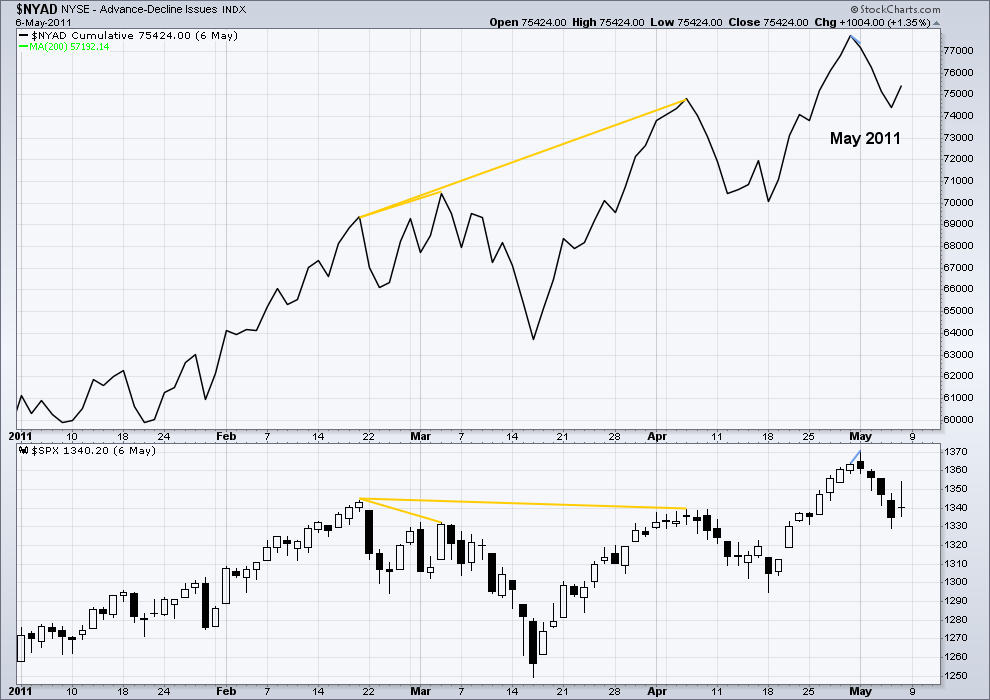
The next major pullback from 2nd May 2011 to 4th October 2011 saw price fall 22% of market value over 108 sessions.
There was only one day of bearish divergence between price and the AD line at the high on 2011.

Click chart to enlarge. Chart courtesy of StockCharts.com. So that colour blind members are included, bearish signals
will be noted with blue and bullish signals with yellow.
The third major pullback from 20th May 2015 to 11th February 2016 saw price fall 15% of market value over 184 sessions.
There was only 16 sessions of bearish divergence between price and the AD line at the high on 20th May 2015.
These pullbacks will be compared to the two most recent bear markets beginning March 2000 and October 2007:
Click chart to enlarge. Chart courtesy of StockCharts.com. So that colour blind members are included, bearish signals
will be noted with blue and bullish signals with yellow.
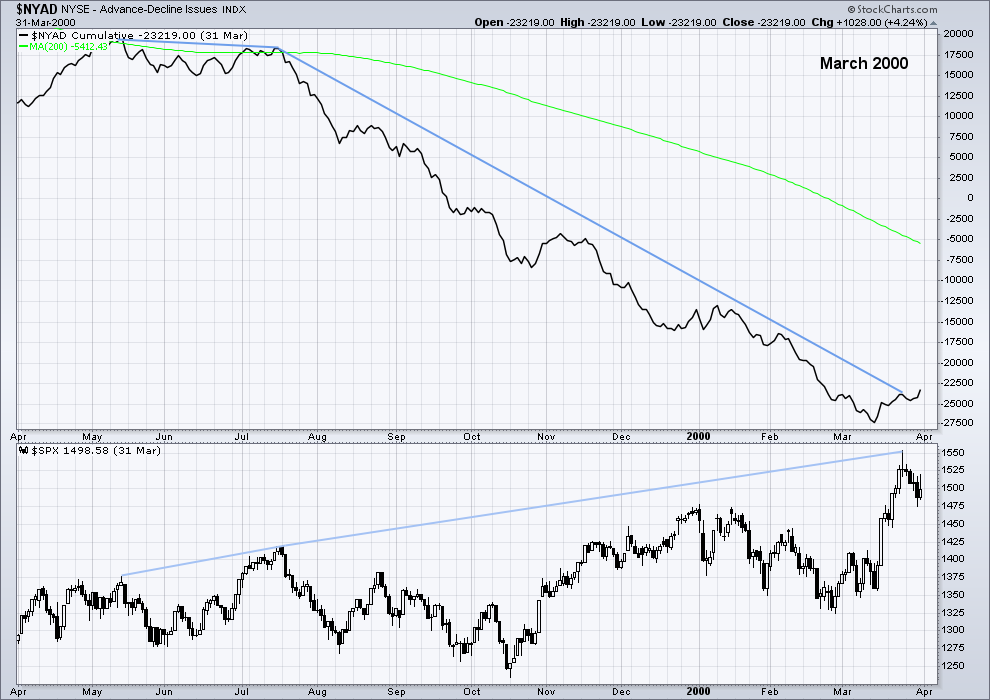
At the end of the bull market on 24th March 2000, there was bearish divergence between price and the AD line dating back to the 13th May 1999. This divergence is just short of one year in duration.
Click chart to enlarge. Chart courtesy of StockCharts.com. So that colour blind members are included, bearish signals
will be noted with blue and bullish signals with yellow.
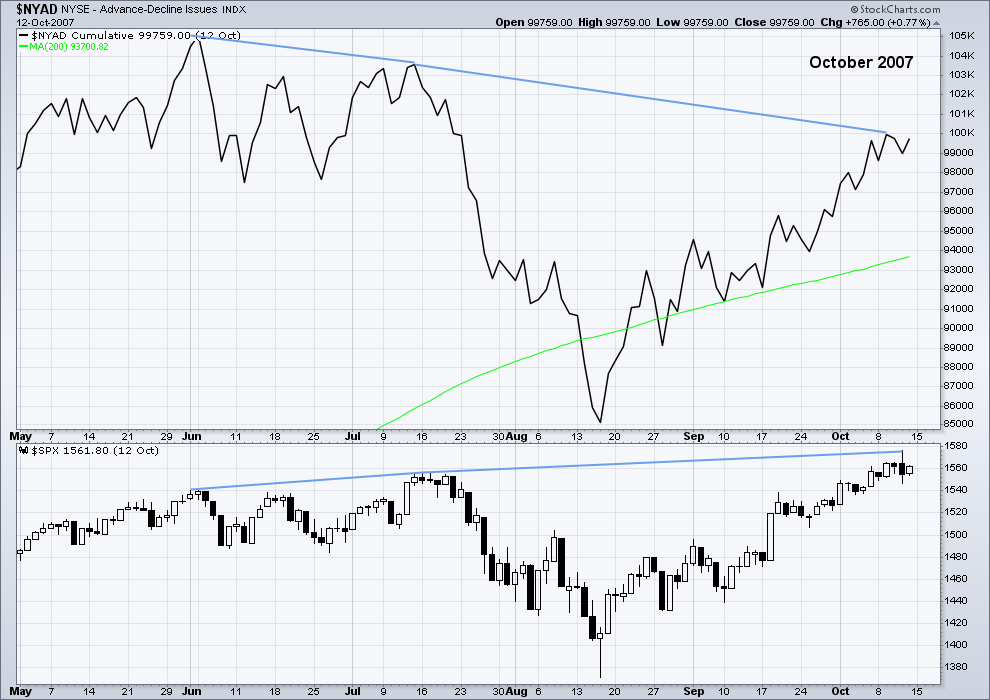
At the end of the bull market on 11th October 2007, there was bearish divergence between price and the AD line dating back to 4th June 2007. This was just over 4 months of divergence.
Click chart to enlarge. Chart courtesy of StockCharts.com. So that colour blind members are included, bearish signals
will be noted with blue and bullish signals with yellow.
Finally, a comparison may be made to the current situation.
There was just 16 sessions of bearish divergence between price and the AD line at the last all time high.
This chart is more comparable to the first three charts of pullbacks within a bull market and not to the last two charts of the ends of bull markets and beginning of fully fledged bear markets.
Further, Lowry’s Operating Companies Only AD line shows no divergence between price and breadth at the high of the 21st of September. At that point, there was also no rise in selling pressure as measured by Lowry’s. Normally, selling pressure will show a steady and sustained rise towards the end of a bull market.
In conclusion, I am reasonably confident that the current fall in price will find a low reasonably soon and then be followed by a continuation of the bull market to new all time highs in 2019.
VOLATILITY – INVERTED VIX CHART
WEEKLY CHART
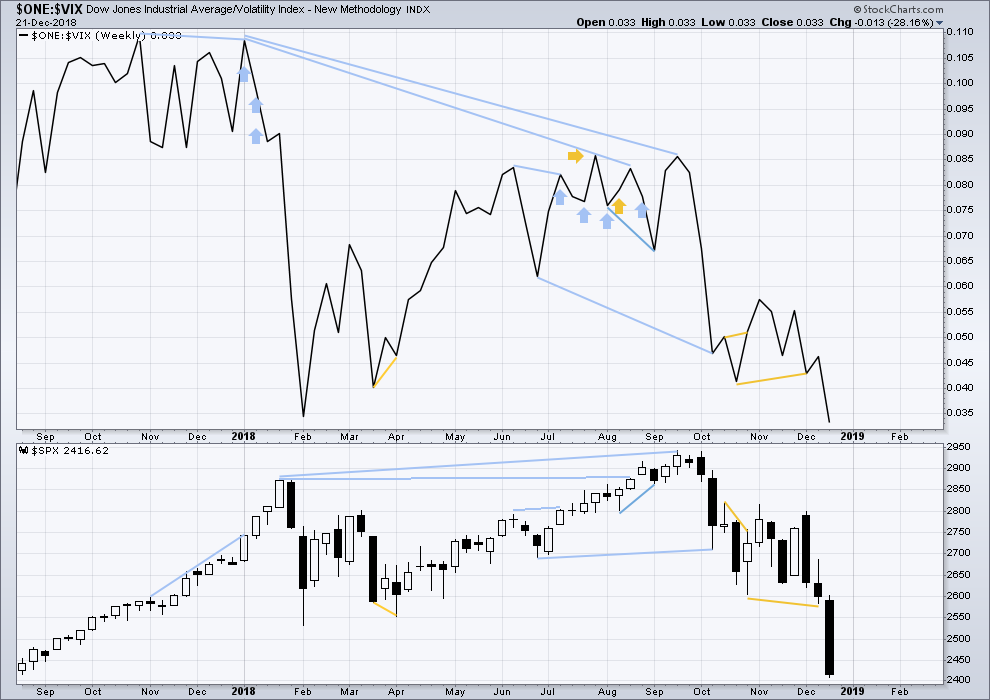
Click chart to enlarge. Chart courtesy of StockCharts.com. So that colour blind members are included, bearish signals
will be noted with blue and bullish signals with yellow.
Bullish divergence noted in last week’s analysis of VIX has disappeared. There is now no divergence as both inverted VIX and price make new lows.
DAILY CHART
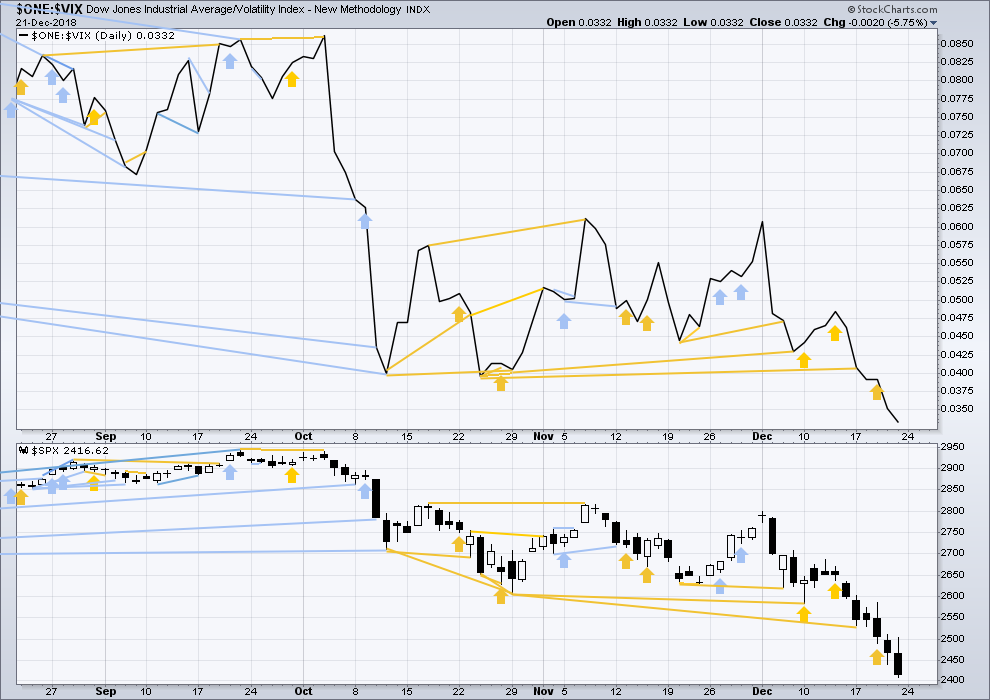
Click chart to enlarge. Chart courtesy of StockCharts.com. So that colour blind members are included, bearish signals
will be noted with blue and bullish signals with yellow.
Both price and inverted VIX have now made new lows following bullish divergence. This divergence is considered to have failed.
SUPPLEMENT – DAILY CHART – OCTOBER 2007 TO MARCH 2009
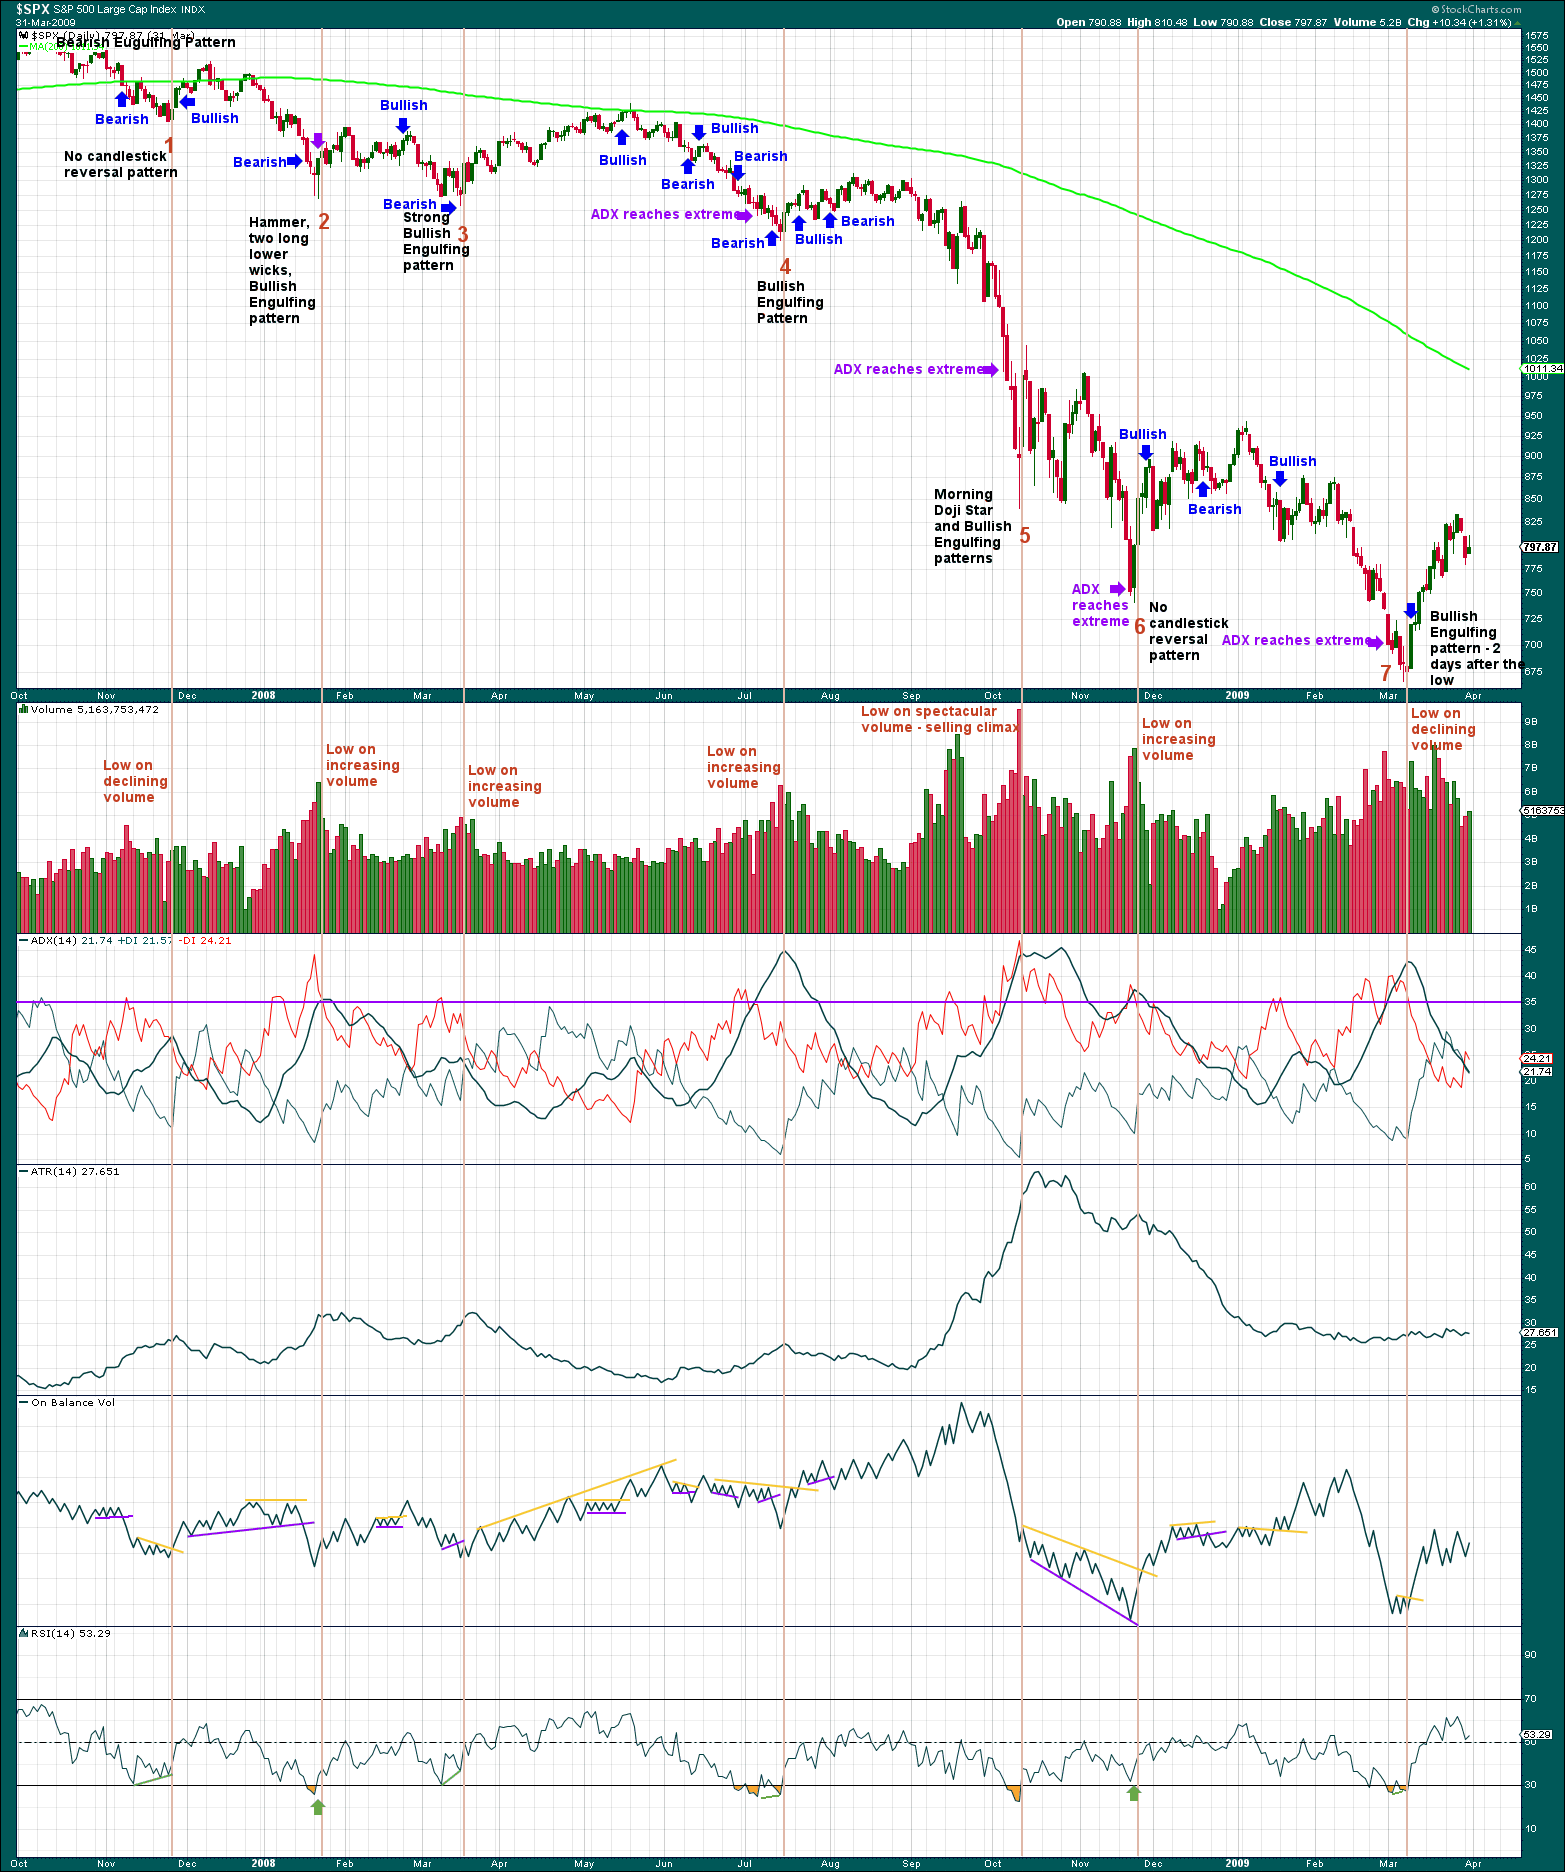
Click chart to enlarge. Chart courtesy of StockCharts.com
This exercise is to determine if there are any signals or a cluster of signals that appeared at minor swing lows and the final low within the most recent bear market from October 2007 to March 2009.
Lows as numbered were characterised by:
1. Declining volume as price fell on the final day, no candlestick reversal pattern, ADX was not extreme. Strong double divergence between price and RSI, but RSI had not reached oversold. A bullish signal from On Balance Volume two days after the low.
2. The day before the low a Hammer pattern (almost a Dragonfly doji but the upper wick is a little too apparent) appeared. The next day a low was found and a Bullish Engulfing pattern completed. Volume increased steadily and markedly to the low. ADX reached extreme just on the day of the low. RSI reached oversold and on the day of the low showed single day bullish divergence.
3. A strong bullish candlestick reversal pattern, and strong divergence with RSI but RSI was not extreme. On Balance Volume gave a bearish signal the day before the low.
4. A candlestick reversal pattern, a strong and steady increase in volume, downwards movement for six sessions after ADX reached very extreme. RSI reached oversold and then exhibited clear divergence with price. On Balance Volume gave a bearish signal two days before the low.
5. A strong bullish candlestick reversal pattern, a spectacular selling climax, ADX reached extreme four sessions prior to the low. RSI reached extreme but exhibited no divergence with price.
6. No candlestick reversal pattern, ADX reached extreme one session before the low, downwards movement had strong support from increasing volume; at the day of the low, there was single day divergence between price and RSI but RSI was not oversold.
7. There was no candlestick reversal pattern (the lower wick was not long enough for a Hammer pattern) at the final low in March 2009. A bullish reversal pattern appeared two sessions after the low. Price fell for the final three sessions on declining volume. ADX reached extreme five sessions prior to the low. On Balance Volume gave a bullish signal two sessions after the low, on the same day as the Bullish Engulfing pattern completed. RSI reached oversold and then exhibited divergence with price.
Additional:
Failed (and partially failed) bearish and bullish candlestick reversal patterns:
14th Feb 2008 – A Bearish Engulfing pattern was followed by only five sessions of downwards movement.
7th May 2008 – A Bearish Engulfing pattern was followed by only two sessions of downwards movement and then a high eight sessions afterwards.
8 Jul 2008 – A Bullish Engulfing pattern was followed by a new low five sessions later.
24th Jul 2008 – A Bearish Engulfing pattern was followed by only two sessions of downwards movement and a new high twelve sessions after.
1 Dec 2008 – A huge Bearish Engulfing pattern was immediately followed by 24 sessions of choppy upwards movement.
20 Feb 2009 – A strong bullish Hammer pattern was followed immediately by downwards movement.
Failed signals from RSI:
3rd Jun 2008 – Price made a slight new swing low and RSI made a slight new swing high. This bullish divergence was slight and RSI was not oversold.
18th Sep 2008 – Single day divergence where price moved lower but RSI moved higher, followed only by one more day of upwards movement.
29th Sep 2008 – Price made a strong new swing low but RSI made a slightly higher swing low, followed by only one day of upwards movement.
3 Oct 2008 – Price made a new low which was not matched by RSI. This bullish divergence was slight and disappeared the following day. It was followed by very strong downwards movement.
13 Nov 2008 – Price made a strong new swing low but RSI was substantially higher. This was followed immediately by very strong downwards movement.
17 Feb 2009 – Price made a new swing low which was not matched by RSI. This bullish divergence disappeared three sessions later and was followed by the final low 13 sessions after.
Volume profile:
Without looking at the price chart, and only looking at volume bars, it is possible to see in what direction price was moving for most of this bear market with a few exceptions. As price moved higher, upwards days exhibited stronger volume than downwards days. The reverse was true as price moved lower. A clear exception was from the 8th to the 18th of Sep 2008, and the 13th of Nov 2008.
Conclusions:
No one indicator or method may be used in isolation.
Strongly rising volume can coincide with a minor or major low. This is also observed by Lowry’s.
Divergence between price and RSI is more reliable when RSI is oversold, or when the divergence is strong. However, even strong divergence can simply disappear.
A cluster of bearish indications at one time increases the probability of a low.
DOW THEORY
Dow Theory confirms a bear market. This does not necessarily mean a bear market at Grand Super Cycle degree though; Dow Theory makes no comment on Elliott wave counts. It may equally as likely mean that Primary wave 4 could be deeper and stronger than originally anticipated.
DJIA: 23,344.52 – a close on the 19th of December at 23,284.97 confirms a bear market.
DJT: 9,806.79 – price has closed below this point on the 13th of December.
S&P500: 2,532.69 – a close on the 19th of December at 2,506.96 provides support to a bear market conclusion.
Nasdaq: 6,630.67 – a close on the 19th of December at 6,618.86 provides support to a bear market conclusion.
Published @ 09:12 p.m. EST.
—
Careful risk management protects your trading account(s).
Follow my two Golden Rules:
1. Always trade with stops.
2. Risk only 1-5% of equity on any one trade.
Updated hourly chart:
Primary 4 has now reached and passed the 0.618 Fibonacci ratio of primary wave 3.
Minor wave 3 still looks incomplete, I’m still waiting for minor 4 to show up.
There is no lower Fibonacci ratio for minor 4 (0.786 is not a Fibonacci ratio) and so now I have to wait until minor 4 is complete to calculate a target at minor degree.
So now I’ll use support lines below as potential ending points for minor 3.
There is strong support just below here 2,400.
Below that next support is about 2,320.
I’ll be back after markets have closed and Stockcharts have finalised their data (usually about 6:30pm EST) to give you an end of day TA update.
Merry Christmas everybody!
Markets closed at 1pm EST today.
Unusual for any wave 4 to go past .618 of wave 3.
But we are doing the last primary 4 down before the mother of all bear markets and primary 2 was an insipid shallow wave, so the alternation is perfect.
Also wave (C) of primary 4 is 1.618 (A) at 2269.
At this rate, we will be testing the real-ness of 2111 invalidation next week.
If that happens I will have to switch to an extremely bearish wave count.
Wow… I haven’t seen this since 2008. 2015/2016 drama had nothing on this. Worst December since the Great Depression.
The final indictment of the worst (inept, criminal, and corrupt) US government in history. Big change starts in January…and will only accelerate through the spring. Oops, I mean, the market’s indictment…many more actual indictments coming! Lol!
Are you really naïve enough to believe that the incoming are any less corrupt than the outgoing? Washington DC is called a swamp for good reason. Not only are alligators present but it is putrid and rotting. It is the display of human nature run its course.
Of course politicians are “corrupt”. That’s embedded in the world “politics”.
I stand by my conclusion, and in my opinion, any objective review of the facts of the last 2 years justify it: the worst government in the history of the nation. By far the most corrupt, criminal, and inept. The market sell off here is to a large degree a function of that. Until a government is in place that is far less corrupt, criminal, and inept…Rome is likely to keep burning. In my opinion.
Thankfully, the institutions of justice in the US are strong, and continue to roll up the criminals.
YES… An outsider was elected in 2016 to DRAIN the SWAMP!!!
The Swamp has been resisting tooth and nail!!!
YES… in January the plug in that tub will be finally pulled and the swamp will drain over the next few years!!!
early close today…right? or did someone just turn off the lights at the nyse? lol!!!
Lara, reference your comments on recent video about reducing clutter by not showing all small waves.
My vote would be for showing MORE small waves on daily and hourly charts. My confusion is when the small waves are NOT shown–takes me time to catch on and figure out where these smaller waves are going. Small waves very important on daily and hourly basis.
I have been with you on EWSM and EWG for several years and quickly decided I would never be your equal on EW so best to just listen and observe the expert–you instantly and intuitively “see” those hidden small wave patterns, I as a mere mortal do not. Also we all have varied learning and communication styles, some visual, some spoken, some numeric or written. I would really really appreciate seeing more green directional arrows and or more wave numbers on daily and hourly charts.
Chart space is limited, on daily and especially hourly I suggest show less of past wave action and leave more space for smaller current and projected waves (zoom in a little more on current and projected). Less explanation of wave action that got us to current position more projection (green arrows and wave numbers) of where we are headed.
That’s my Christmas wish.
Happy holidays and many blessings.
Agora, the world’s largest financial publishing company, has recognized the remarkable trading skills of my friend and mentor, Bryan Bottarelli.
They have bought Bottarelli Research.
Some of you can imagine my dismay, on initially hearing about these developments a few months back, especially after loosing Adam Lass our incredible Chartist, a few years ago
Then, the shock of a lifetime. Bryan negotiated with Agora to bring some of his traders into the new company with a lifetime charter membership under the new umbrella.
Bryan wants me to join him in the new venture. It is one of the most humbling things that I have ever had happen to me. 90% of what I know about options trading, I learned from Bryan. The sale will complete on December 26 and knowing Bryan, we will hit the ground running.
I want to add my thanks to Lara for her patient and persistent hard work in analysing one of the most perplexing markets I have ever seen. While I am open to the idea of a top being in, this is classic fourth wave behavior. Either way, exciting times are ahead.
I would like to wish all the members of the forum a most joyous and peaceful Christmas season, and a happy and prosperous 2019!
That’s just awesome brother !
Enjoy the path and the journey ahead !
Hi Verne! Does this mean you will not be posting here any longer?
Lara
Thanks for your hard work over 2018. It is much appreciated.
We all learn more from mistakes than from getting things right.
In the long term, all of us will benefit from the last few weeks, your analysis this weekend proves that.
Have a Very Merry Xmas
(the happy holiday wishes, hasn’t reached Australia yet, we are hanging on to Merry Xmas by the skin of our teeth)
I used to teach HS science. That was a poster I always had on my wall: “If you’re not prepared to make mistakes, you’ll never learn anything new”. I always encouraged my students to be comfortable with making mistakes.
I’ve learned some new things these last two weeks.
Hi Lara,
This may sound unsophisticated but the deep lows for this 4th Wave may mean a longer steadier rise to October of next year. Who knows?
I noticed some weeks ago that you changed your forecast to March instead of October but the way this is looking, the SPX may rise through Q2 or peak there as some others have pointed out.
Just my 2p/2c.
By the way, keep up the excellent work! 🙂
Merry Christmas!
-Nigel
Hi Lara,
Also, based on your weekly chart and your forecast, this looks like a head and shoulders pattern forming. That would also give me some confidence in the October theory. Maybe I’m wrong?
Thanks!
-Nigel
I’m picking March or October simply because historically those are more common months for an end to a major bear market and turn to fully fledged bull market.
That really is it.
And yes, I’ll be alert to a possible H&S forming.
Thanks Lara for such in-depth analysis.
You’re most welcome.
Hi lara
Thx for your time and excellent efforts
Any chance the move up to 2500 on Thursday and into Friday could have been a 4… (rising from 2438)with the 5 being what happened with the fall to 2400 today and possibly into Monday
I know it’s splitting hairs maybe
But if it’s a 1 of the coming five wave on the way… vs a 4 of the ending 4
Just a thought
Have a great weekend !
Ummm….
I do have that small rise labelled as a fourth wave.
Minuette (iv).
If you have another idea then a chart of your idea would be probably… a good idea.
That’s my bad Lara
I was confusing the 3 on the daily at the end of 4 possibility with the iii minute wave
I see it…
No worries.
I don’t think minor 3 is done yet, so minor 4 has not yet begun.
I’ve covered this as clearly as I can in the video too. What to expect for the next couple of weeks.
1st
You win!