
The main and alternate Elliott wave counts are swapped over today.
Summary: The target for the end of primary wave 4 is about 2,478.
A small bounce may unfold here for minor wave 4. It may last one to a very few days. Thereafter, the target may be recalculated (it may not be low enough).
New updates to this analysis are in bold.
The biggest picture, Grand Super Cycle analysis, is here.
The monthly chart will be reviewed today.
MAIN ELLIOTT WAVE COUNT
MONTHLY CHART
Click chart to enlarge.
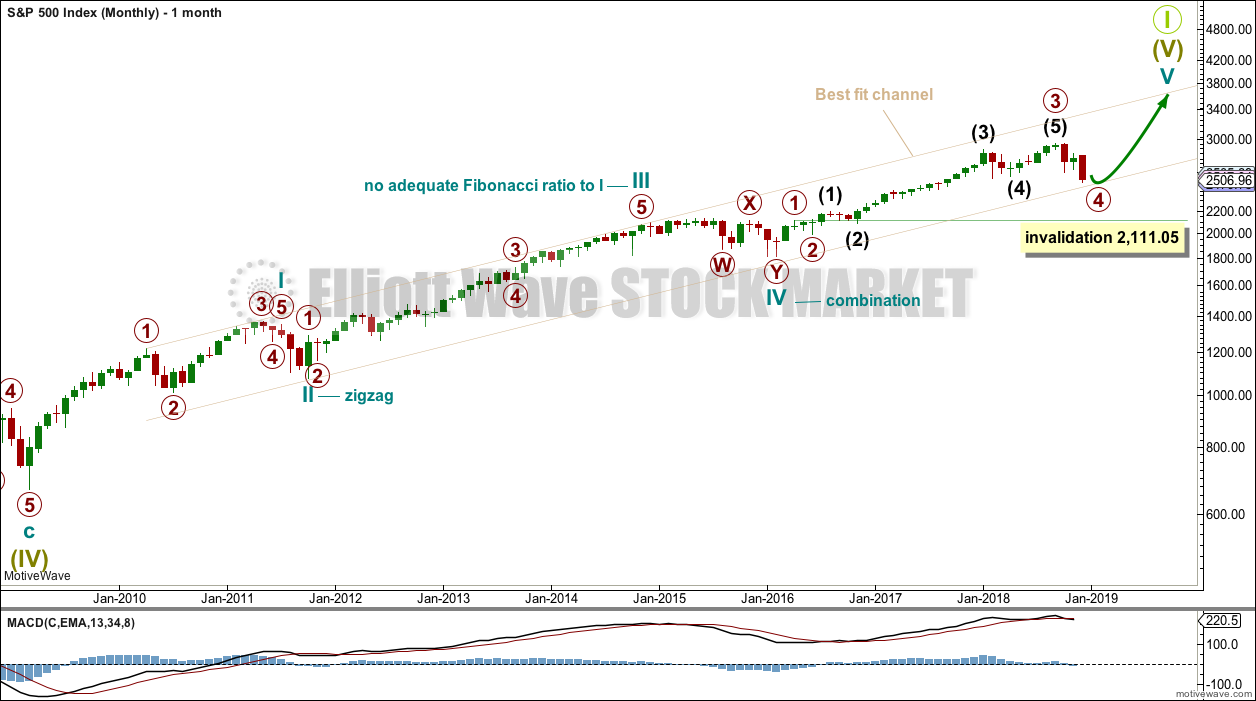
Super Cycle wave (IV) completed a 8.5 year correction. Thereafter, a bull market began for Super Cycle wave (V). The structure of Super Cycle wave (V) is incomplete. It is subdividing as an impulse.
There is no Fibonacci ratio between cycle waves I and III within Super Cycle wave (V). This makes it more likely that cycle wave V will exhibit a Fibonacci ratio to either of cycle waves I or III. Cycle wave V has passed equality and 1.618 the length of with cycle wave I. The next Fibonacci ratio of 2.618 yields a target at 3,616, but this may be too high. It may be better in this case to calculate the target at a lower degree; this will be done on weekly and daily charts.
The teal channel used in analysis up until today is discarded, because it is not currently showing where downwards movement is finding support. A new channel is drawn to contain all of Super Cycle wave (V) that may be used for the next possible area of support. This channel is show in taupe.
The S&P does not always fit neatly into channels at the end of bullish movements. It fairly often forms slow curving rounded tops. When it does this, it may breach a channel to then only to continue on towards new highs and sometimes hug the lower edge of the prior channel as it does so. Therefore, for this particular market, it is sometimes necessary to be flexible with channels.
Cycle wave II was a shallow 0.41 zigzag lasting three months. Cycle wave IV is seen as a more shallow 0.28 double combination lasting 14 months. Cycle wave II was a sharp movement that travelled a reasonable distance in a short time. Although cycle waves II and IV are disproportionate in terms of duration, the distance covered still gives the wave count the right look. There is excellent alternation between them.
Cycle wave I lasted 28 months (not a Fibonacci number), cycle wave II lasted a Fibonacci 3 months, cycle wave III lasted 38 months (not a Fibonacci number), and cycle wave IV lasted 14 months (one more than a Fibonacci 13).
Cycle wave V is now within its 34th month. The structure needs at least a very few more months to complete. It may continue for as long as another 21 months to total a Fibonacci 55, or it may end sooner and not exhibit a Fibonacci duration.
Within cycle wave V, the correction for primary wave 4 may not move back down into primary wave 1 price territory below 2,111.05.
Primary wave 4 shows up on the monthly chart. This gives cycle wave V the right look.
WEEKLY CHART
Click chart to enlarge.
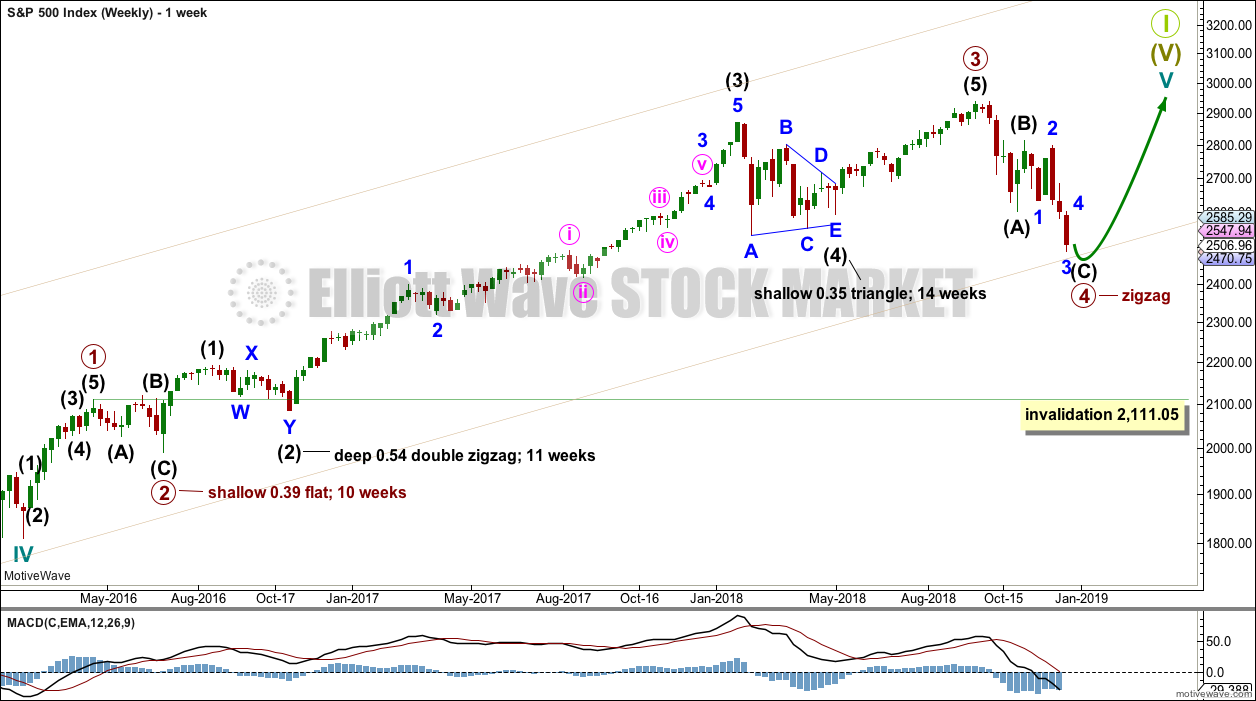
Cycle wave V must complete as a five structure, which should look clear at the weekly chart level and also at the monthly chart level. It may only be an impulse or ending diagonal. It is clear it is an impulse.
Within primary wave 3, there is perfect alternation and excellent proportion between intermediate waves (2) and (4).
Because it is not currently showing where price is now finding support, the teal channel is discarded. A new best fit channel is copied over from the monthly chart. There is a little room now for downwards movement before price reaches this new support line.
This wave count has the right look at the monthly chart level.
If primary wave 5 ends at or after the end of December 2018 and the AD line fails to make new all time highs, there would then be the minimum required four months of bearish divergence between price and the AD line. If this happens, then the conditions for the end of this bull market would be in place.
Primary wave 4 may not move into primary wave 1 price territory below 2,111.05.
Two daily charts are published. The main and alternate wave counts are swapped over today. Technical analysis favours the new main wave count.
DAILY CHART
Click chart to enlarge.
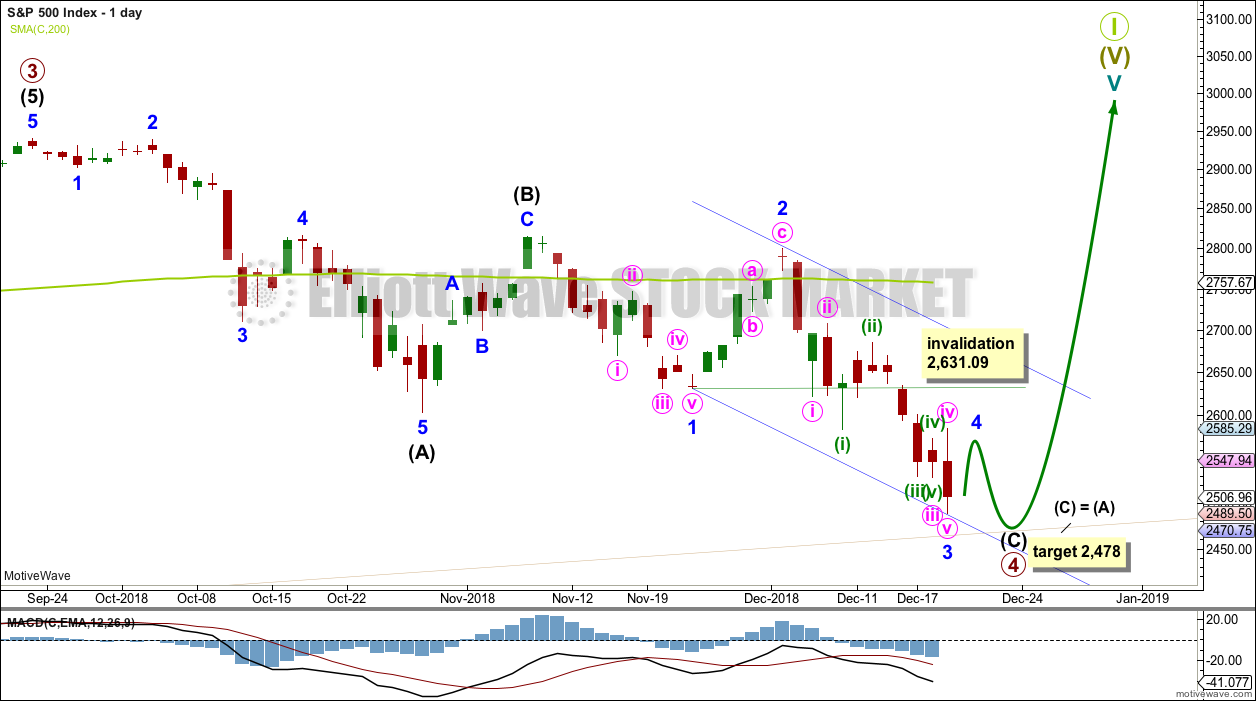
Intermediate wave (C) may be a simple impulse. Within the impulse, minor waves 1, 2 and now 3 may be complete. Minor wave 3 exhibits an increase in downwards momentum; this has the right look so far.
Minor wave 4 may not move into minor wave 1 price territory above 2,631.09.
If the target calculated here at intermediate degree is wrong, it may not be low enough. However, if the next Fibonacci ratio in the sequence of 1.618 is applied to intermediate wave (C), then the target would be too low.
When minor wave 4 may be complete, then the target may be calculated at minor degree. At that stage, the target may widen to a small zone or it may change.
HOURLY CHART
Click chart to enlarge.
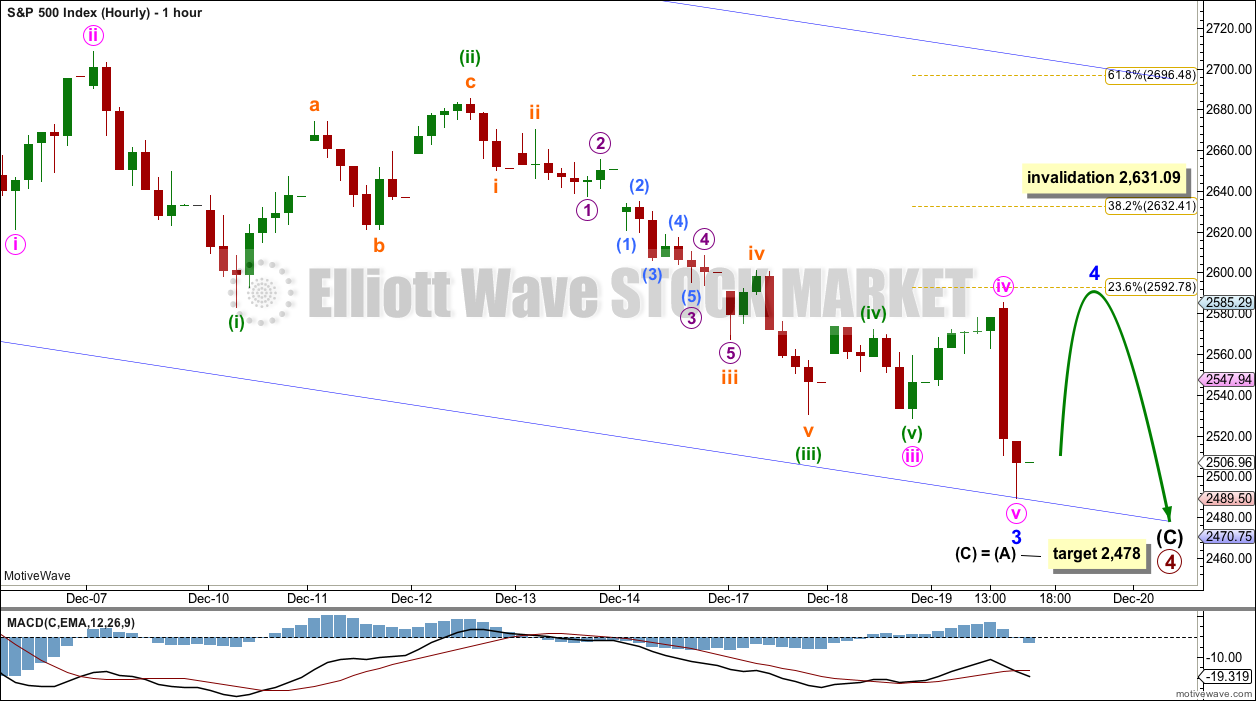
Intermediate wave (C) may be close to completion. Within this impulse, minor wave 4 may unfold tomorrow. Minor wave 4 may last one to a few days.
Targets for minor wave 4 would be the 0.236 and 0.382 Fibonacci ratios, at this stage favouring the 0.236 Fibonacci ratio.
When minor wave 4 is complete, then the target may be recalculated.
Minor wave 2 was a very deep 0.92 zigzag, which lasted 6 sessions. Minor wave 4 may be expected to exhibit alternation, so it may be shallow. It may unfold most likely as one of a flat, combination or triangle.
Thereafter, minor wave 5 would be extremely likely to make at least a slight new low below the end of minor wave 3 at 2,489.50 to avoid a truncation.
ALTERNATE DAILY CHART
Click chart to enlarge.
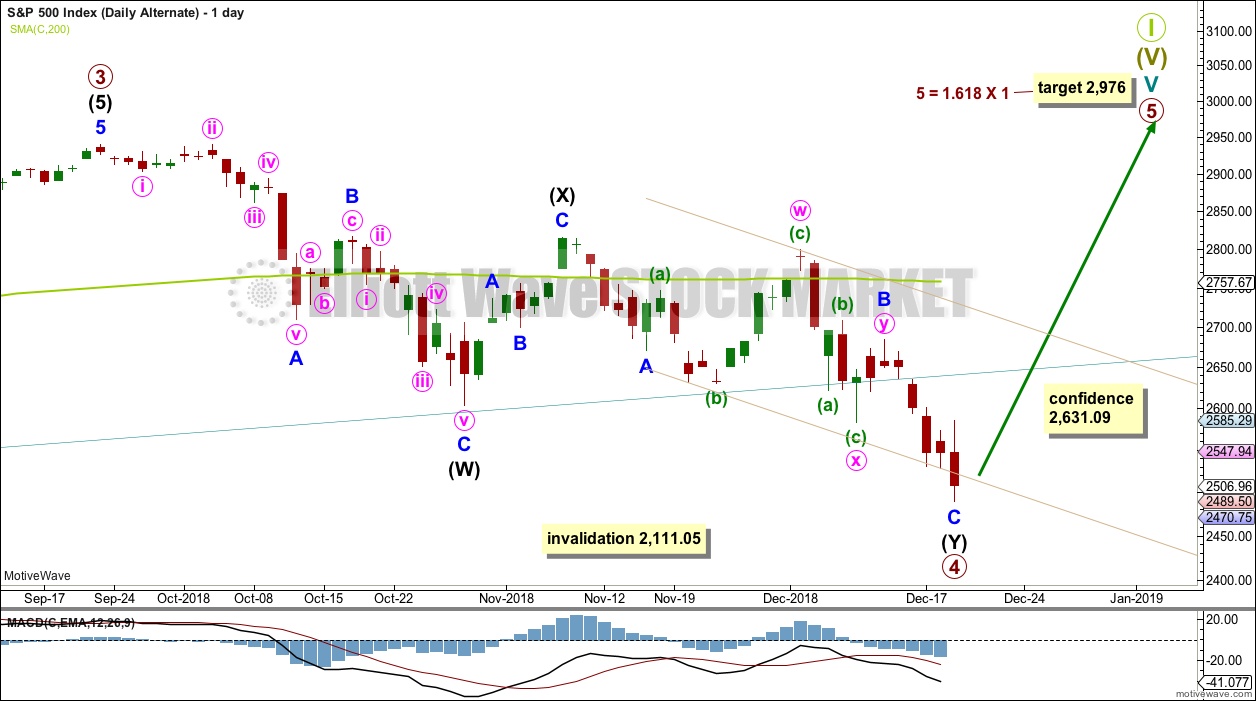
Primary wave 4 may be a complete double zigzag.
The first zigzag in the double is complete and labelled intermediate wave (W). The double is joined by a complete three in the opposite direction, a zigzag labelled intermediate wave (X). The second zigzag in the double may again today be complete, which is labelled intermediate wave (Y).
Minor wave B within intermediate wave (Y) is labeled as a possible double combination. All subdivisions fit perfectly, but this structure has a downwards slope. Double combinations are fairly common structures, but they normally have a sideways look. This one does not. However, the S&P does not always have normal looking structures. This is acceptable for this market.
The second zigzag of intermediate wave (Y) may today be complete, or it may move just a little lower tomorrow. If it is complete at today’s low, then minor wave C exhibits no Fibonacci ratio to minor wave A.
A new high above 2,631.09 is required for some confidence in this wave count.
ALTERNATE HOURLY CHART
Click chart to enlarge.
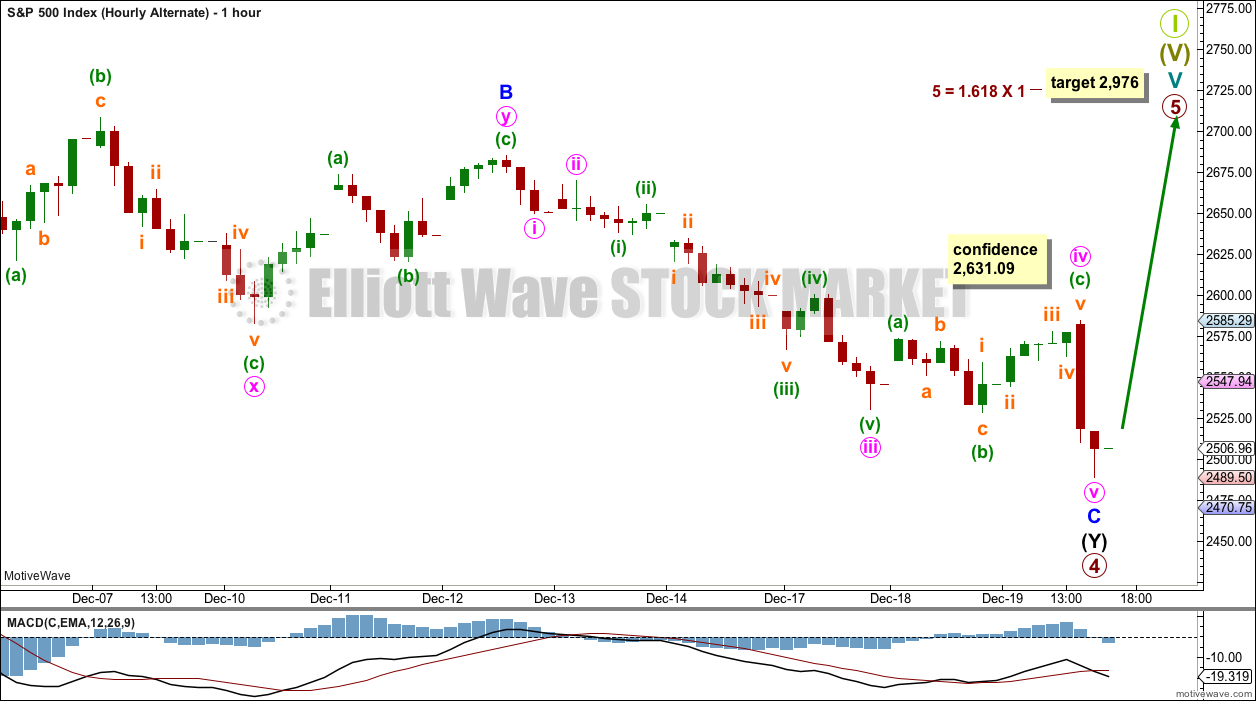
It is again possible that the structure of minor wave C could be complete. However, the proportion between minute waves ii and iv now look wrong.
A new high now above 2,631.09 would invalidate the main wave count and provide some confidence in this alternate wave count.
TECHNICAL ANALYSIS
WEEKLY CHART
Click chart to enlarge. Chart courtesy of et=”_blank”>StockCharts.com.
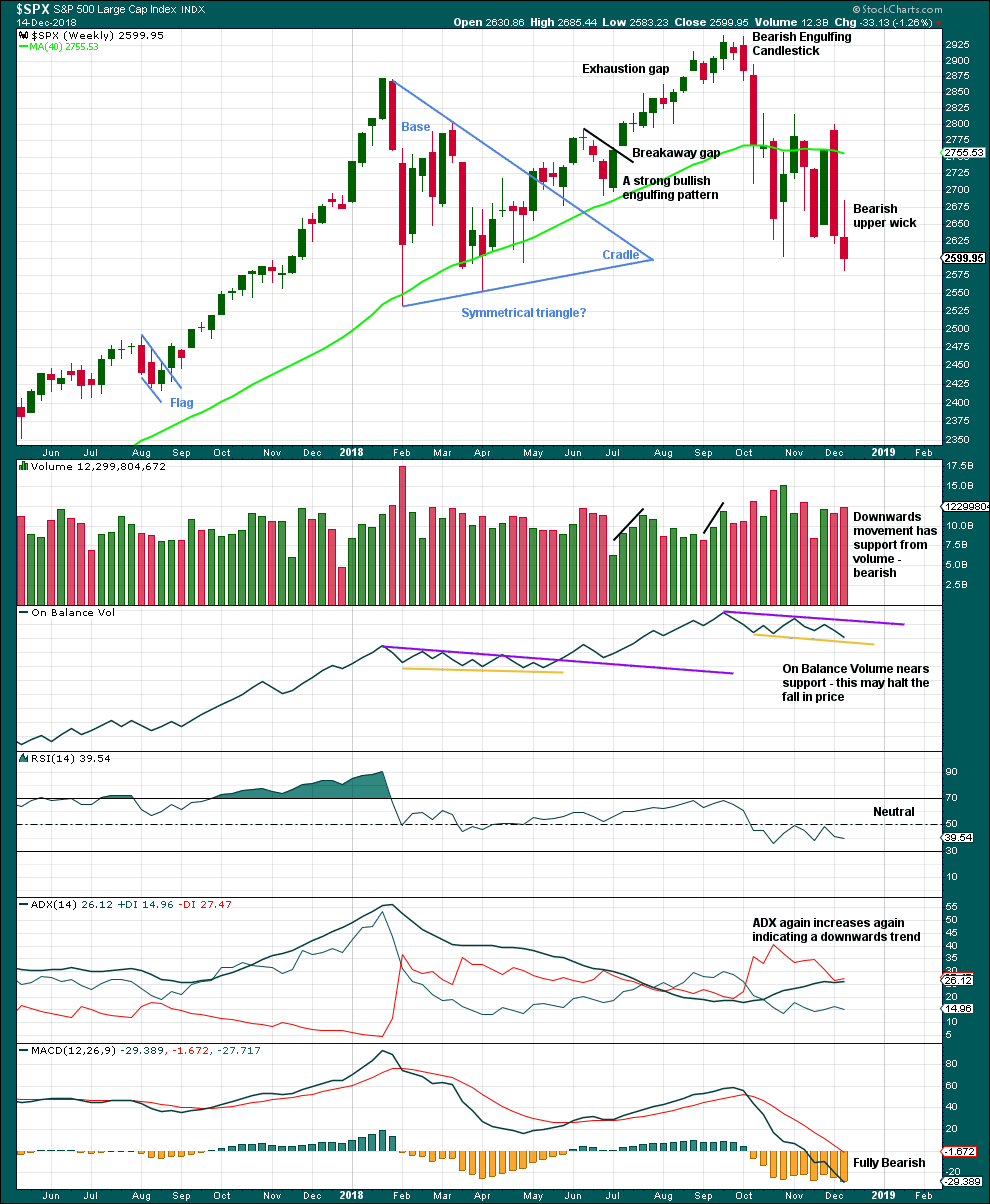
The strongest volume for recent weeks is for the upwards week beginning 29th of October. This short-term volume profile at this time frame is bullish.
For a more bearish outlook a bearish signal from On Balance Volume would be preferred.
The last weekly candlestick has a bearish long upper wick, but it has a smaller real body and has not moved price substantially lower.
DAILY CHART
Click chart to enlarge. Chart courtesy of StockCharts.com.
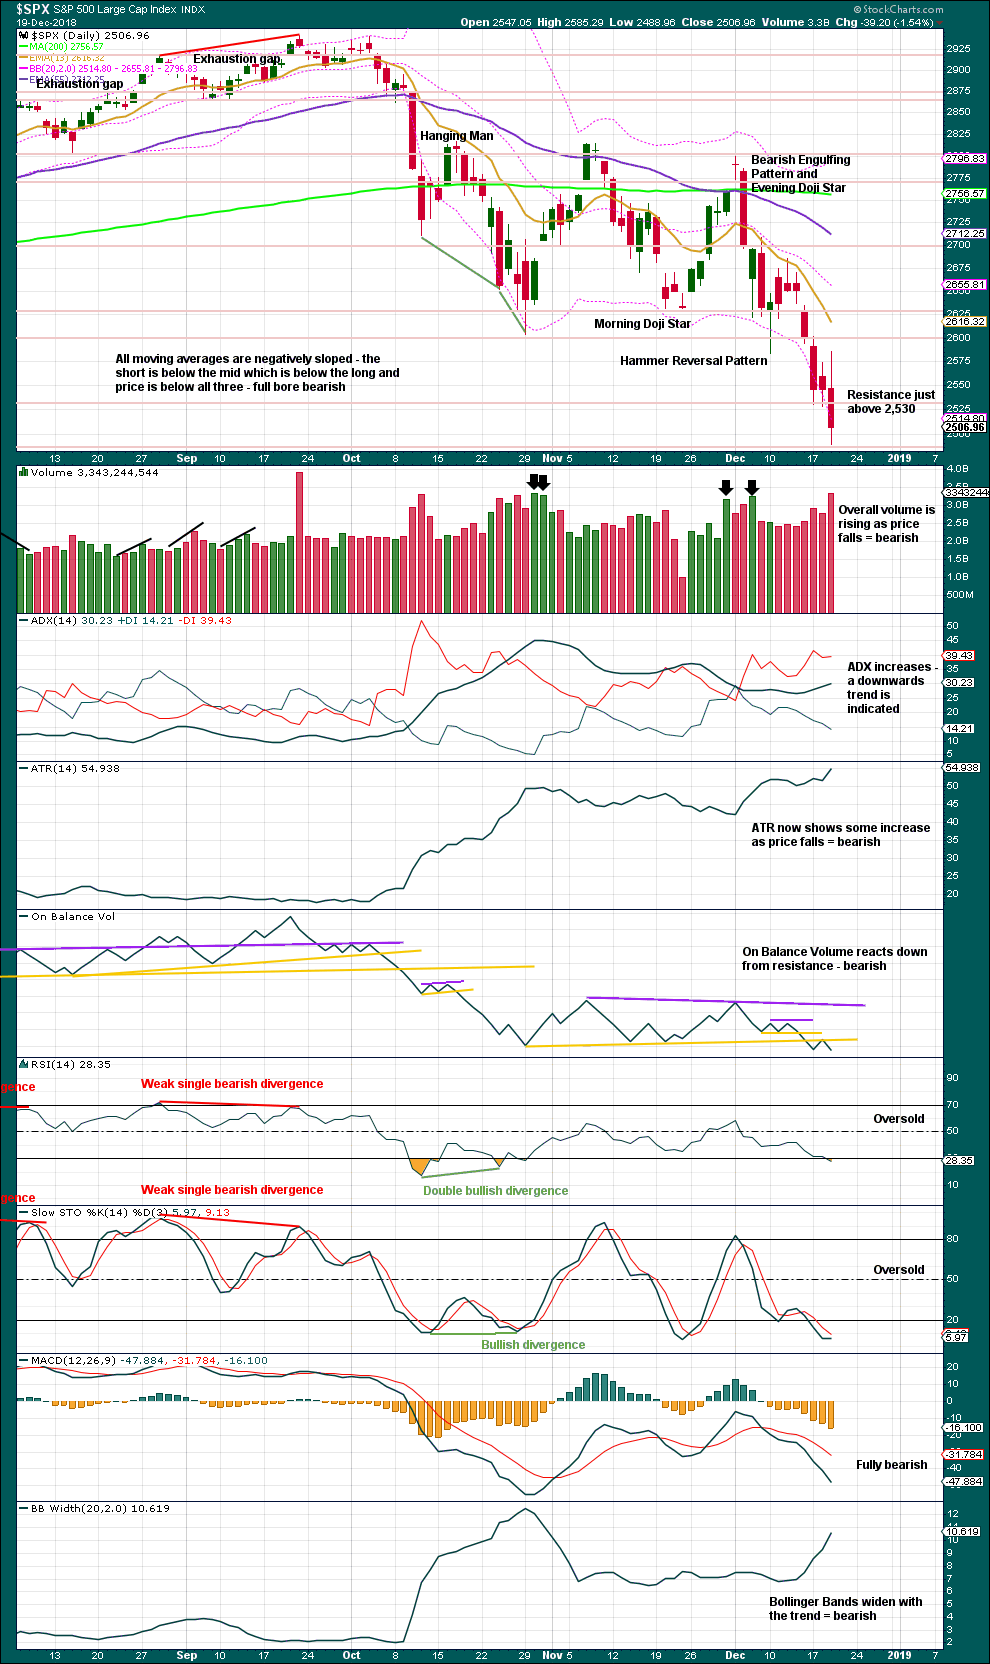
For the short term, at least there is pressure from volume in downwards movement. Expect it to continue.
There is support here about 2,485. Look for next support below about 2,400.
When the S&P has a strong downward trend, RSI may reach more deeply oversold and can remain there for a reasonable time (from a few days to a very few weeks). If RSI reaches oversold and then exhibits clear bullish divergence with price, it is often (not always) a signal that a low is in place. That is not the case today. There is still room for price to fall.
Overall, this chart is bearish for the short to mid term.
BREADTH – AD LINE
WEEKLY CHART
Click chart to enlarge. Chart courtesy of StockCharts.com. So that colour blind members are included, bearish signals
will be noted with blue and bullish signals with yellow.
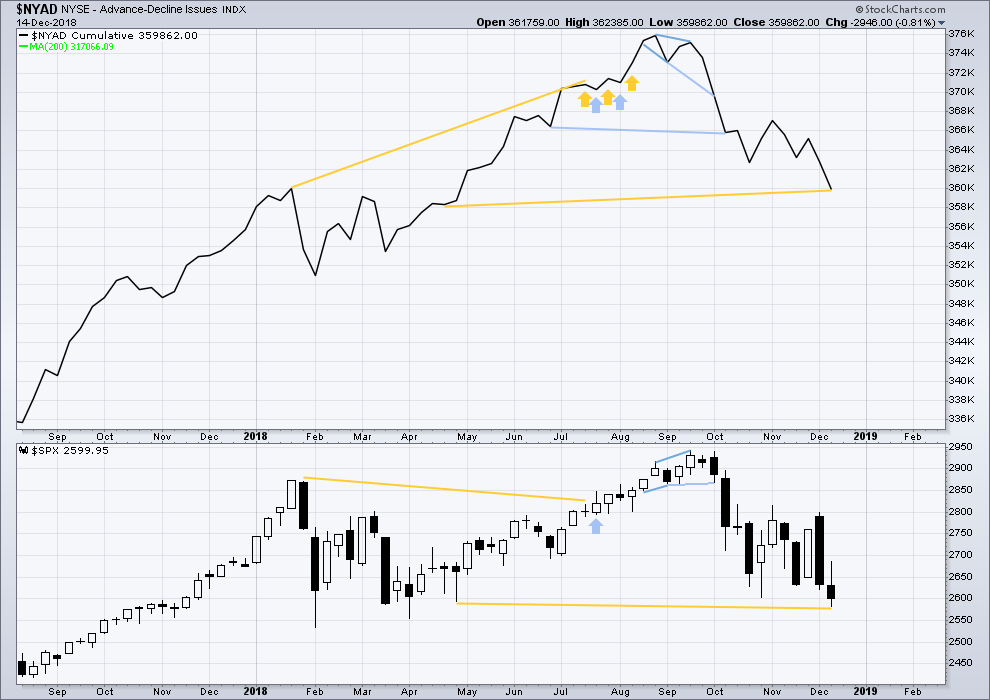
There is mid-term bullish divergence between price and the AD line. Last week price made new lows below the prior low of the week beginning the 30th of April, but the AD line has not. This indicates that downwards movement does not have support from a corresponding decline in market breadth; there is some weakness within price.
DAILY CHART
Click chart to enlarge. Chart courtesy of StockCharts.com. So that colour blind members are included, bearish signals
will be noted with blue and bullish signals with yellow.
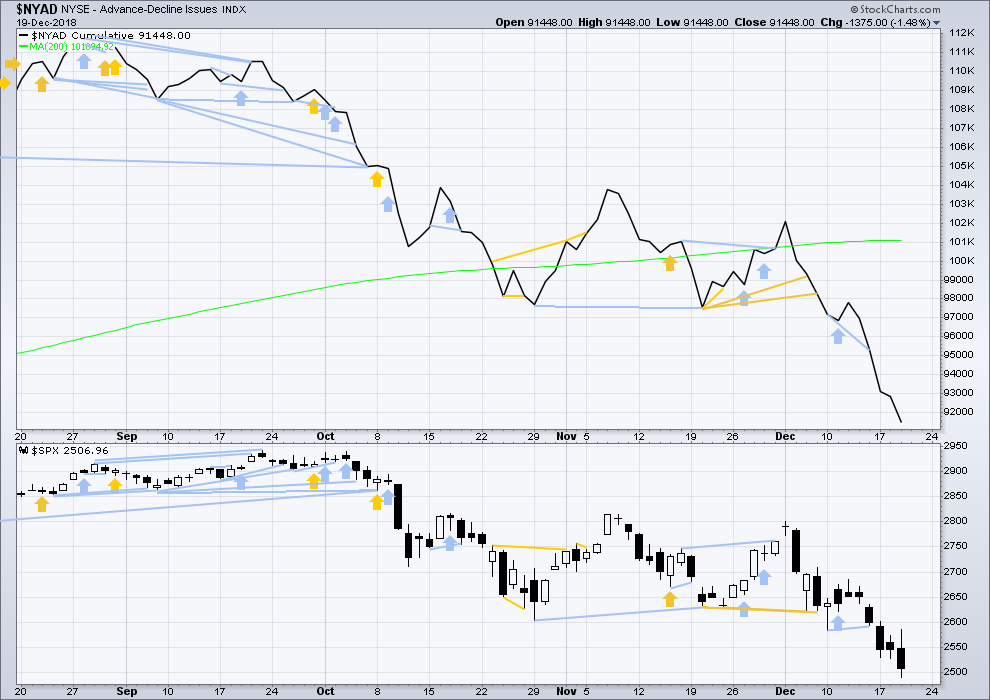
There is normally 4-6 months divergence between price and market breadth prior to a full fledged bear market. This has been so for all major bear markets within the last 90 odd years. With no longer-term divergence yet at this point, any decline in price should be expected to be a pullback within an ongoing bull market and not necessarily the start of a bear market. New all time highs from the AD line on the 29th of August means that the beginning of any bear market may be at the end of December 2018, but it may of course be a lot longer than that.
Breadth should be read as a leading indicator.
Today both price and the AD line have made new lows. There is no divergence.
Nearing the end of this bull market, to the end of primary wave 5, bearish signals from the AD line may begin to accumulate.
VOLATILITY – INVERTED VIX CHART
WEEKLY CHART
Click chart to enlarge. Chart courtesy of StockCharts.com. So that colour blind members are included, bearish signals
will be noted with blue and bullish signals with yellow.
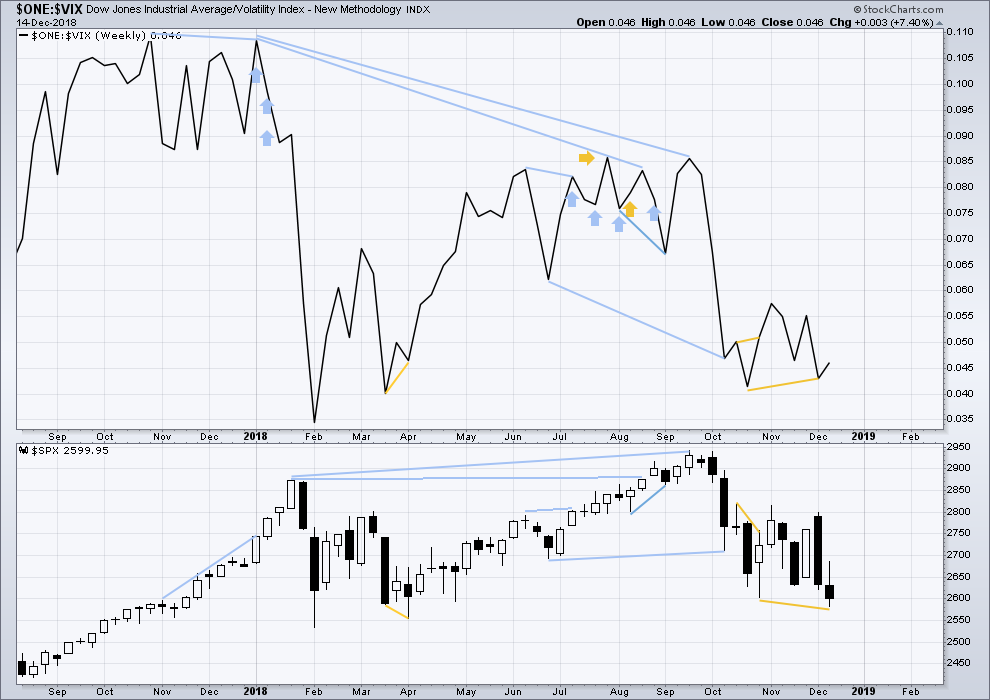
Last week price has made a new low below the prior swing low, but inverted VIX has not. This divergence is bullish and indicates downwards movement last week does not come with a normal corresponding increase in VIX.
DAILY CHART
Click chart to enlarge. Chart courtesy of StockCharts.com. So that colour blind members are included, bearish signals
will be noted with blue and bullish signals with yellow.
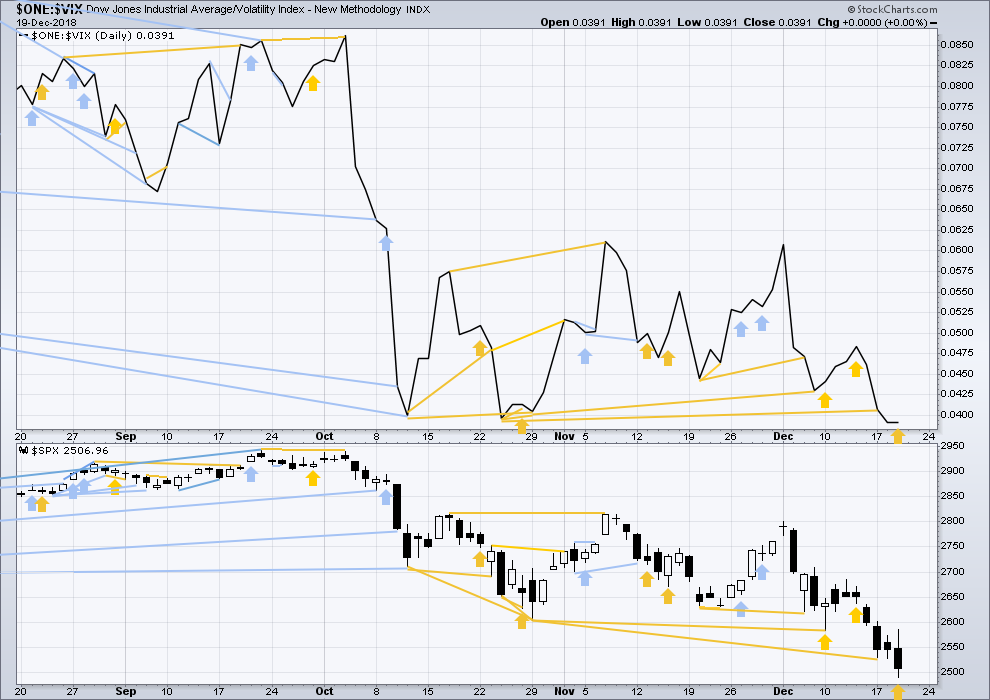
Normally, volatility should decline as price moves higher and increase as price moves lower. This means that normally inverted VIX should move in the same direction as price.
Like the AD line, inverted VIX may now begin to accumulate instances of bearish signals or divergence as a fifth wave at three large degrees comes to an end.
Today price moved lower, but inverted VIX is flat. This divergence is bullish for the short term. However, it is noted that the last three bullish divergences between price and VIX have failed, so today’s divergence is not reliable at this time.
DOW THEORY
Dow Theory confirms a bear market today. This does not necessarily mean a bear market at Grand Super Cycle degree though; Dow Theory makes no comment on Elliott wave counts. It may equally as likely mean that Primary wave 4 could be deeper and stronger than originally anticipated.
DJIA: 23,344.52 – a close today at 23,284.97 confirms a bear market.
DJT: 9,806.79 – price has closed below this point on the 13th of December.
S&P500: 2,532.69 – a close today at 2,506.96 provides support to a bear market conclusion.
Nasdaq: 6,630.67 – a close today at 6,618.86 provides support to a bear market conclusion.
Published @ 09:20 p.m. EST.
—
Careful risk management protects your trading account(s).
Follow my two Golden Rules:
1. Always trade with stops.
2. Risk only 1-5% of equity on any one trade.
Not sure if you’ll see this message Verne, but it’s good to see you posting again here 🙂
You’re right about a comment earlier, I have a difficult time going short. I’m much better at riding up waves. I def need to work on that
We will get the proverbial pause that refreshes, and then…..well, you know what to do!
Have a great evening everyone! 🙂
let me try to translate: we are in Minor 4 now, and get ready to short once more …
?
🙂
Verne, you are a trading jedi, maybe be a little less cryptic for ordinary people?
Lara charted it…! 🙂
Don’t forget to ring the register people!
A good time to start scaling out of profitable trades on the short side.
In this environment, sell into downside strength! 🙂
and added some fresh new years calls….. Verne, can you suggest a few books on options trading?
Jon and Pete Najarian and Ken Trester are very good options traders.
They have written some good beginner’s books that might be worth checking out.
Perfect !
The target is met and passed, and the structure is incomplete.
The small bounce on the hourly chart at the very beginning of this session is too small to be minor wave 4, and so I think minor 3 is not quite over.
When minor 4 is complete then I can calculate a new target. For now, expect price to keep falling.
The next target I could calculate would only be at intermediate degree, it would be where intermediate (C) reaches 1.618 X intermediate (A) at 2,270. This looks too low. It may be best to calculate the target at minor degree, but I can’t do that yet.
Daily chart:
Hourly chart:
Yes Ma’am! 🙂
Ya’ll may disagree, but I’m not feeling the real fear in the markets like we had in 2008. The Fed clearly isn’t either.
Well, we also don’t have every major financial institution on the cusp of bankruptcy.
We will probably finish this leg into the close ahead of a bounce via overnight futures.
Ring that register if you are sitting on juicy profits! 🙂
Speaking of delicious meats.
Has anyone ever slow smoked a Turkey?
I first tried it a few years ago and the outcome was scrumptious!
Our friends would subsequently insist that we bring another smoked specimen to our Thanksgiving gatherings after that first successful foray.
If you are patient to give it the time (about ten hours) the result is tender, flavorfull, succulent bird unlike any other preparative method provides! 🙂
I’ve to try that Verne…For the last two turkeys, I’ve used Reynolds oven bags. I’ll be doing so again next week. The result has been the most juicy and tender turkey. I really recommend trying it out.
Looks like Lowry’s wrong!
TLT monthly. Trend at this timeframe is still down, even with the big push up over the December.
Key resistance and and the 61.8% retrace level is sitting at 122.9. If that breaks, 125.8 at least is highly likely if not certain.
I’m a bit curious about this push down in interest rates yet RUT continues to just get hammered. I though RUT was highly sensitive to interest rates…but maybe to further future expected rates? Which implies this counter trend rally in 20 years bonds is exactly that, a short term counter trend rally only? Or maybe the RUT is getting hammered (harder than SPX/NDX) for other reasons. I do want to catch the resumption of the downtrend in TLT when it finally arrives.
not to mention financials. Aren’t they suppose to perform better with higher rates also???
Yes, but over the last month, rates have been FALLING. Not good for financials.
The miscreants over at the FED should have started raising two years ago so they would now have some bullets to combat the down-turn. They were more interested in juicing the short vol trade and punishing short sellers than they were in properly managing the economy.
I expect them to cry “Uncle” over the next few weeks and abruptly reverse course. It is going to be an absolute riot!
I’m curious how this fall from 268 last week will be labeled in the p4 scenario
Feels a lot more like a 3 down in progress
Big sell offs often end with manic moves. I think overall this week qualifies as a “manic move”. That said, you could absolutely be right, and there’s a lot more bulls blood to be shed here…and opportunity to make money short. On the other hand, this P4 could end any time here. In many ways, it looks and feels pretty complete. But it ain’t over until it’s over I’ve heard say.
It is a 3rd down in process. Is either 3rd of 3rd in the c wave of the zigzag down in P4, or 3rd down in a larger correction (a five waves downer).
So, either way same effect for the next couple hundred S&P points.
Watch out for the wave 4 of this wave. As you may know by now, wave 4s are problematic.
IMHO the orderly selloff that we have had suggests it is a P4.
As always you have to see what market gives you hour by hour, day by day.
It is a folly to try to follow some road map related to the market blindly.
Above not a trading advice.
So important. Traders need to develop a set of metrics to guide their trading.
The EW analysis should serve as general road-map to complement your own due diligence. One also has to be flexible, and as Steve Nison once told me, always have a number that says you are wrong.
One of the most frustrating experiences for me as a trader was when the cabal launched the actual and synthetic short vol trade. Techniques I had sucessfully used for years were no longer working, and I had my gluteus maximus handed to me as I tried to keep using those strategies. It did take longer than it should have, but I finally learned that just because the market behaved predictably in a certain way for years on end, there is no rule that says it has to do it this or the nexy year!
Could be third of a C wave…
LOL Verne
🙂
What you laughing about Debbie…I want to get in on the joke lol…
Hell…I don’t know why I am laughing.
Have a dry aged t-bone steak and a Merry Christmas…
May I recommend a nice Merlot with your cut? 🙂
Gonna take the money from these puts and buy some more Isosceles (my fav cab blend) for the cellar….. thanks Verne
🙂
Look for bounce at around 2420….
Thanks Verne, I’ll take that suggestion Merlot it is :).
For true disclosure, we are having dry aged New York strips and not t-bone.
I’ve been dry aging steaks for a little over two years now, and I’ve found New York strips to be the best cut of meat to dry age (this is just my opinion). Some folks really like the bone in ribeye.
I really recommend everyone to dry age their own steaks. It is simple, delicious, and fun to do. If you want to know how to do it, please watch some youtube videos…
Yummmmm….! 🙂
RUT is down 23% off it’s all time high.
SPX is down 15.4%
NDX is down 18.3%
I really have no interest in arbitrary definitions. That’s a big bear market right there afaiac.
Dow Theory is just another set of technical indicators. And like most/all such, it is a “lagging” indicator. So it firing “bear market” at this point means nothing to me.
The chart is the SPX monthly. Obviously this P4 correction is larger an any in the 2009-2018 bull market, which is what we should have expected given it’s the last P4 before the end of the GSC wave 1. At this time frame it appears to be a large simple zig zag. Sadly for the bullish case, price is currently in no-man’s land re: fibo support levels, though if it turned up here one might argue it turned on top of a 38.2% level. But looking at this chart…going to 2244 appears very possible.
I trust Lara’s count and assessment this is a P4, and nothing about this chart gives any indication whatsoever that it’s not.
Yes Sir! That may be what it takes.
Entirely within the realm of possibility…!!! 🙂
It really is amazing what stands out when you look at the BIG PICTURE…exactly as you have done!
So….how are you traders doin’?
I know some of you are not comfy trading the “dark” side of the market and prefer to wait for resumption of the uptrend.
Did you know markets tend to fall a lot faster than they rise?
You just might be leaving an awful lot on the table if you don’t learn to trade all three market directions: Up, down, sideways.
Go on! Buy a put or two. It won’t bite ya! 🙂
So DOW Theory has gone full bear market. How often does that happen? Going to guess not since 2008?
No… I believe it occurred in the period Sept 2015 to early Feb 2016… and the markets turned and the Theory Failed!!!
Elliott Wave was expecting a HUGE Decline if a certain price level was penetrated… but the Invalidation price did NOT break below… It Bounced off it! So EW proved accurate and proved…
DOW theory is NOT reliable!
Bear markets can be brief…
That should have crashed in Feb 2016… Govt. stepped in to hold that line!!!
Nobody is going to tell me differently!
We should have crashed even worse than we did during the 2007-2009 crisis. Let me give you a word of advice Joe, my old friend.
DO NOT waste your breath trying to talk to those who do not accept it about government intervention in equities markets via their central banks. You will never have a more frustrating discussion, and you run the real risk of speaking inadvisedly over your consternation that otherwise intelligent folk actually deny that it happens! 😀
You’re right Verne… The two instances they steeped in was March 2009 and I don’t remember the exact date… but they stepped in to break the S&P above 1,050… which confirmed the new trend higher and that level was not revisited.
Seriously
The Swiss bank prints money to devalue their currency and turns it into $ and buys stocks…
It’s way larger than intervention…
SNB is feeling some serious pain these days!
They had massive positions in the FANG cohort and I think they held them with substantial leverage. Few folk know that these banks are allowed to use up to 32X leverage!!
If that is not insanity, I do not know what is! 🙁
I am sure there are some people (successful traders/investors) here with the ability to be $10,000+++ or $100,000+ people here with large social media networks of the same to spread the word.
What is this about? To provide targeted money to go around the useless Congress & Senate.
A Purple Heart Recipient triple amputee Airforce veteran has set up a page to raise money for a We The People Will Fund The Wall – Go Fund Me site…
Please help to support the Brave Brian Kolfage in promoting this GREAT Efffort!
Please give at least $80 or more… like $1,000+++, $10,000+++ or $100,000+++ or anything you can afford to support Brian Kolfage in this effort!
$3,101,331 has been raised so far from 50633 people in 2 1/2 days and will accelerate once Brian Kolfage appears in media appearances today and tomorrow… get in before that… spread the word to your social media networks!
The link to the go fund me page is in this story… https://www.zerohedge.com/news/2018-12-19/build-wall-gofundme-page-raises-1-million-two-days
$3,531,000 now raised… Please Give… and also spread the word to your networks!
Next we can fund new bridges and mybe Elon musks tunnels ….. Maybe call it The New Huge Deal
Wonder how much go fund me makes? Do they take a percentage ? If they do are they publicly traded?
They ask for a tip… so you can give zero or $1 or two.
Nothing else will get this kind of support… The DC establishment in both parties and the Lobbyist’s will be beaten by We The People!!! We are at least 63 Million Strong but I believe on this issue we are 200+++ Million Strong!
So this will be accomplished!
Get the moths out of your wallet and give at least $80 but give all you can afford to give to BEAT these people!!!
BTW: $4,012,000 now raised
$5,125,183 now raised!
Update: $6,353,644 now raised!
Update: $7,053,246 now raised! From 115,531 people.
Media appearances tonight and tomorrow… look for it. Also spread the word through your social networks.
Update: $8,800,121 now raised! From 144,746 people.
If 63 Million people donate… full funding possible. One person gave $50,000 and several at $10,000
I’m happy to wait for Mexico to cover it.
Also, it makes me wonder how much ladders and tunnels cost. Sometimes I think too much.
I am sure you never viewed an entire rally pre November 16 and you certainly did not get this reported to you from any outlet…
The short quote always was “Mexico will pay for the wall” … but it was more than that if you listened… its what were going to do overall… taxes… ending nafta, doing a new trade deal, shrinking the annual $150 Billion trade deficit with Mexico and where the US would come out ahead hundreds of billions over time for a one time expenditure of $25 Billion!
That was in fact the long worded plan that became “Mexico will pay for the wall” I listened too or viewed almost everyone of those rally’s and I know you didn’t listen to any full rally. The media were at every one of the rallys as well and they SPUN it to suite there narrative.
I’ve just spent a couple of hours very carefully reading Lowry’s reports again and going through their charts.
My conclusion is the same. My conclusion is that this is a big correction, and not the start of a new bear market. I’m still expecting new all time highs next year.
The problem here is that the end of Primary wave 4 is proving extremely difficult to find.
Rest assured though, if price keeps plummeting I would have a very bearish wave count for you long before 2,111.05 is reached.
On balance, I do not expect that to happen.
While my confidence in what I’m doing has been sorely tested over the last very few weeks, I can only stick with what the data tells me.
Hi Lara
I see that most of your counts all expect a bounce here very shortly
Yet later in the new updates.. you mention a downtrend in place.. and that it could continue and the trend is down short term to mid term
But I don’t see a count that shows that to examine …
That’s a conflict…
Why isnt there at least one short term count (hourly daily ect) that would show this potential larger drop?
With all respect and admiration …
I’d just like to see those newly observed points of downtrend and bearishness demonstrated in counts .. and not simply next support is 2400…
When I don’t see a count that shows that much of a drop…
Thank you for all you do… and I am very happy to have found you..
We did have a bounce of sorts in ES. It is possible that Lara’s main count needs only very slight adjustment to show a fourth of three, then a fifth of three down. I think Lara is right that a larger fourth bounce may be just ahead. It is starting to look like the capitulation wave could be the fifth wave down, unless of course we have a sub-dividing third unfolding.
There is no fear in this market. Just look at where vol went in January of this year and consider we now have considerably more significant technical damage done to this market than back then.
I think we can in fact see a new ATH as the FED will ultimately back off on rates and may even announce a re-start of Q.E., sending price exploding higher. I suspect it will be the most spectacular fifth wave seen in our life-times. For now however, the brutal actual and synthetic short vol trade engineered by the bankster cabal has driven short sellers from this market. There is no one left to cover at the potential bottom…not good!
Verne can you define “fear in this market” and how you measure it? Is it essentially the value of the VIX, or something else? Rate of fall of price? How would one know when there is “appropriate fear”?
I note the VIX is behaving vastly different than it did in the intermediate 4. My hypothesis is that this divergence in behavior is going to continue, and while the VIX may go higher if/as the market goes lower, a massive spike just isn’t in the cards here. Obviously I could be wrong, but we’ve already have very similar brutal down days and the VIX is la-la’ing in the 16-27 range now throughout this P4. So far.
Oversold TRIN, market skew, downside momentum, and volatility at least matching previous prints at similar market price points.
I will give away one other inside secret since you asked! Please keep it quiet. 😉
Blown out bid/ask spreads on option contracts !
Thank you.
She missed a huge move from 268 to here….
There was not a single count shown that presented an alternative to have a drop like this from last week…
Again
Said with all due respect for her talent and effort
But it was a big move.. and there should have been some count that showed it presented
I’ve been providing main counts which expected P4 was over. But I’ve also provided alternate counts which allow for the possibility for it to continue.
At the time I expected P4 was over, that is what the data was pointing to.
But divergence can disappear, it’s not always reliable. Bullish signals from the AD line and VIX can fail. And candlestick patterns make no comment on the direction of the next trend (full reversal or sideways) nor for how long it may last (a small interruption / bounce, or a new trend in the opposite direction).
I’m trying to be as objective as possible and weigh up all the data I have, then make a judgement.
If your analysis points to one of the alternates being more likely, then use that. That’s one reason why I provide alternates.
Hang in there Lara!
This market has made mince meat of some very seasoned veterans. I couId tell you quite an interesting tale or two. I think we will see a more normative trading environment after this potential nightmarish fourth is done. 🙂
Lara- A slight variation to the alternate.
Targets:
C=A of (Y) @ 2468.49
0.5 retracement of all of Primary 3 comes in @ 2466.30
What do you think?
Ha – was “awaiting moderation” for so long this is now “old hat”!
I would not want to consider a wave count which sees wave X as a zigzag, with a truncated C wave.
That considerably changes things.
Your count is valid, but it has a very low probability.
Fair enough I don’t like the truncation either. But I counted wave (X ) as a flat.
A is more 3 than 5 and B was just short of the 90% retracement ?
It seems like P4 will not end until we get a big pop in VIX which Verne has been talking about. Although this has been a big smack down, there’s no “blood in the streets.”
As Kevin says, bottoms are an event! So far as bad as it’s been, it’s still been an orderly decline.
So much for a Santa Clause rally 🙁
Despair not!
We could see a quite rapid, and dramatic, conclusion to this final move down… 🙂
But then it would not be a P4
p5 would have already happened
If the market doesn’t shore up here
The counts won’t work lower for a p4 will they?
That’s a legit question
P4 won’t get invalidated until SPX goes below 2111, as mentioned on the monthly chart. So unless that’s taken out, P4 remains valid
From a practical and trading perspective on what we have been doing here the last couple months …
If that is the real
Bottom possibility …(2111)
What’s the difference ?
That would be an over 30% drop from highs
Most traders would have been stopped out to the point of being broke….
The 2478 level we are at now…
At least in Lara’s charting (and I have great respect for her)
And value her service ..)
Only really showed up until a big drop from couple days ago when the market was 200 points higher …..
And it shows the weakenesses of Elliot wave …
The fib levels are legit with the sequence
That’s universal…
It’s the art of a trader to know the trends as Verne said
And the assumption of bullishness was too large IMHO
And it didn’t demonstrate the real downside…
until effectively
The downside happened…
So it’s a very interesting situation to see how this p4 level keeps getting readjusted
Where it looks like if 2478 doesn’t hold
Who really cares what happens
You either catch a big fall to 2111 or you don’t …
But why trade in between..
So I see this as the final chance for a real p4 end.. regardless of how it’s labeled …
It’s too large a trap door
And at 2942
You might as well have said it was p5 and trade the slide down to 2111
Or even to here…
Even if a p5 does appear at 2111 and it’s a massive ride up…
Your effective trading capital would have been wiped up trying to catch the knife …
At least now we are hearing about a clear down trend in language as opposed to expecting bounces …
We were not hearing about clear down trends at 2800 or 2700…
So that’s important to learn from ..
Yep! That is exactly what needs to happen. Too much BULL….! 🙂
My viewpoint is a little different.
Lara’s has identified the invalidation level for the P4 throughout. And she’s had models that show the potential of this kind of deep sell off throughout.
EW doesn’t predict the market action. It maps likely paths, and with the support of traditional TA, provides relative probabilities.
I have zero issue with the data, and the alternative counts that we have been provided since the top in October. Simply put, the lower probability scenario has played out. That happens.
One last comment: the “targets” provided by Lara are not “definitive”. They are “the more likely target” given the EW structure and fibonacci levels. They do not represent a “lowest possible price” (or highest) in any way. The invalidation levels do that. I say this because sometimes that is misunderstood.
At each stage where a higher probability count has failed, there have been clear signs/triggers that indicate that failure/invalidation, and could/should have enabled appropriate trading actions, including stopping out and/or getting in line with the growing down trend.
Just my different perspective.
At this time the downwards trend is clear. Anyone who entered long in the last couple of weeks should already be stopped out by now.
And so if risk is being properly managed, no one here should be sent broke by this analysis.
Honestly, we have seen the Dec Jan run up. Why wouldn’t that have been P5
Edit- 2017/2018 run up obviously
No one knows for certain. We simply have to be prepared to trade what we see. I think there is a danger in relying too heavily on past market history when attempting to gauge what is happening in the current market. This market is in many ways unique in the history of markets and is so in more ways than I care to cite.
Lara was right in that that teal trend line had contained every correction during this bull market and it was not unreasonable to expect the same outcome during this one. Based on other signals the market was sending, a month ago I was suspicious that trend-line would be violated and even gave my downside target. As someone sagely observed, while History OFTEN rhymes, it does not ALWAYS repeat.
Exactly.
Each time is different, with echoes of past occasions.
The only data we have is all historical. So the only record to look to is what has happened. We can learn some lessons, and then be flexible.
“The counts won’t work lower for a p4 will they?”
I can force a wave count which sees a high in place.
But it suffers from a problem of horrible proportion.
And I’ve already been over Lowry’s data and experience. They too expect the bull market has at least one more all time high in it.
There hasn’t been a “big pop” in the VIX throughout this P4, which is now far larger than the I4, where that massive pop did occur.
I hypothesis that something “unique” happened in that I4. And it’s not happening here, and it won’t. I could be wrong.