
Downwards movement invalidated the main Elliott wave count. The invalidation indicated either of the two alternate Elliott wave counts may be correct.
Two Elliott wave counts are used today with clear confidence and invalidation points.
Summary: It is possible a low may again be in place here or tomorrow. A new high above 2,583.23 and a breach of the channel on the the hourly chart would add confidence in this view.
If price keeps falling here, then the target for the end of primary wave 4 would be about 2,478.
New updates to this analysis are in bold.
The biggest picture, Grand Super Cycle analysis, is here.
Last published monthly chart is here, video is here.
MAIN ELLIOTT WAVE COUNT
WEEKLY CHART
Click chart to enlarge.
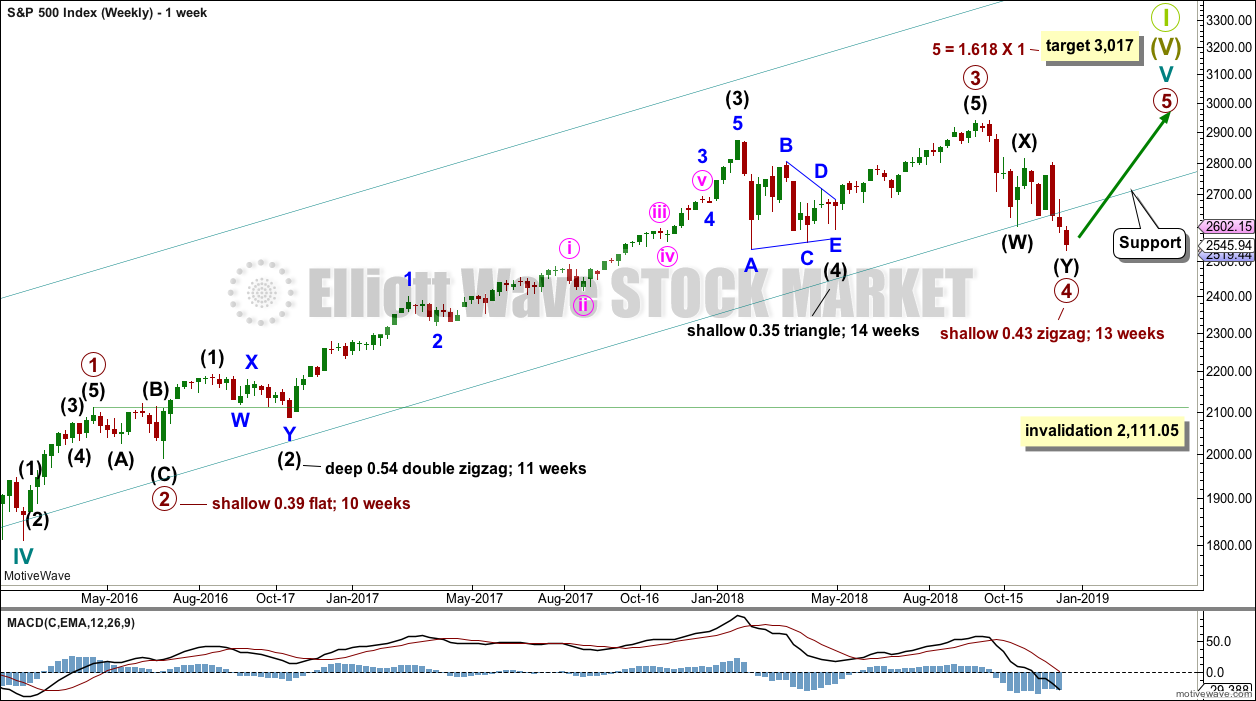
Cycle wave V must complete as a five structure, which should look clear at the weekly chart level and also at the monthly chart level. It may only be an impulse or ending diagonal. It is clear it is an impulse.
Within primary wave 3, there is perfect alternation and excellent proportion between intermediate waves (2) and (4).
Draw the teal channel from the high of cycle wave I at 1,343.80 on the week beginning 3rd July 2011, to the high of cycle wave III at 2,079.46 on the week beginning 30th November 2014, and place a parallel copy on the low of cycle wave II at 1,074.77 on the week beginning 2nd October 2011. Draw this chart on a semi-log scale. A small overshoot, like that seen at the end of cycle wave IV, would be entirely acceptable.
The channel has now been overshot twice at the end of primary wave 4. This is acceptable. If this wave count is correct, then a breach of this channel would be unlikely. A breach may be defined as a full weekly candlestick below and not touching the lower trend line. If this trend line is not to be breached, then a low and a sharp reversal must be found this week, so that this weekly candlestick does not print fully below the trend line.
This wave count has the right look at the monthly chart level.
If primary wave 5 ends at or after the end of December 2018 and the AD line fails to make new all time highs, there would then be the minimum required four months of bearish divergence between price and the AD line. If this happens, then the conditions for the end of this bull market would be in place.
Primary wave 4 may not move into primary wave 1 price territory below 2,111.05.
Two daily charts are published.
DAILY CHART
Click chart to enlarge.
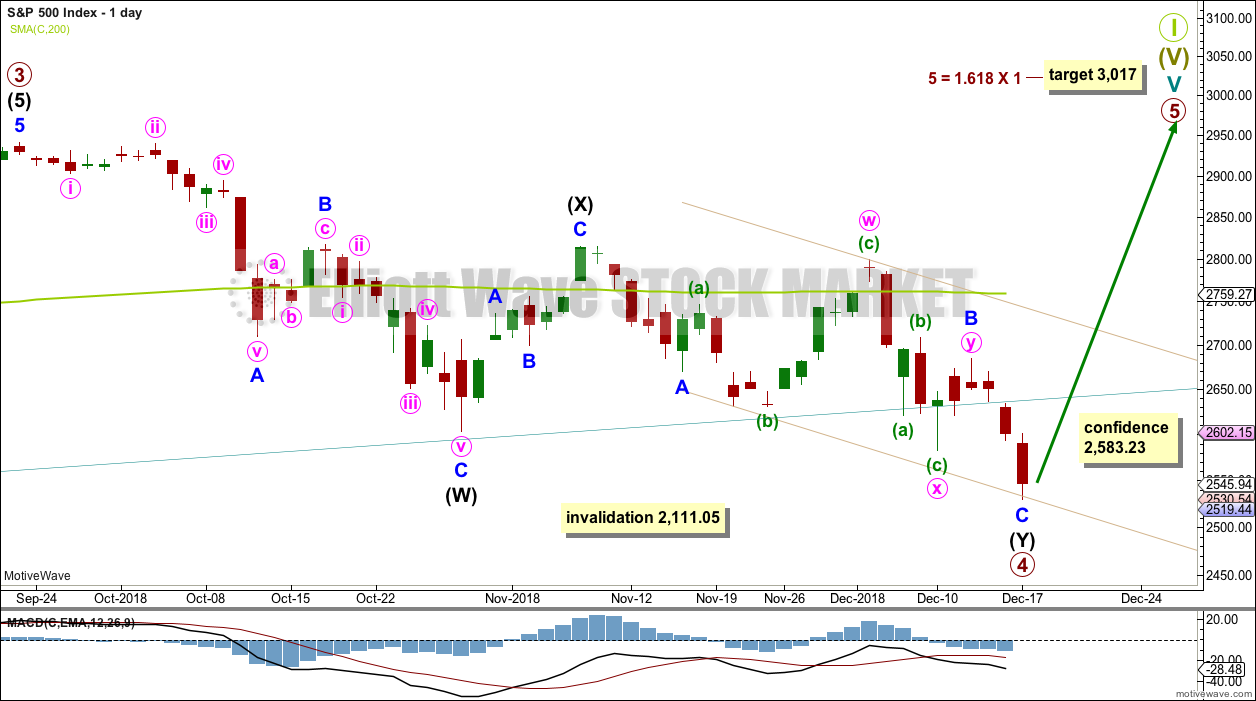
Primary wave 4 may be a complete double zigzag.
The first zigzag in the double is complete and labelled intermediate wave (W). The double is joined by a complete three in the opposite direction, a zigzag labelled intermediate wave (X). The second zigzag in the double may today be complete, which is labelled intermediate wave (Y).
Minor wave B within intermediate wave (Y) is labeled as a possible double combination. All subdivisions fit perfectly, but this structure has a downwards slope. Double combinations are fairly common structures, but they normally have a sideways look. This one does not. However, the S&P does not always have normal looking structures. This is acceptable for this market.
The second zigzag of intermediate wave (Y) may today be complete, or it may move just a little lower tomorrow. If it is complete at today’s low, then minor wave C would be 10.5 points longer than equality in length with minor wave A. This variation is less than 10% the length of minor wave C, so it is small enough to consider they have a Fibonacci ratio of equality.
A new high above 2,583.23 is required for some confidence in this wave count.
HOURLY CHART
Click chart to enlarge.
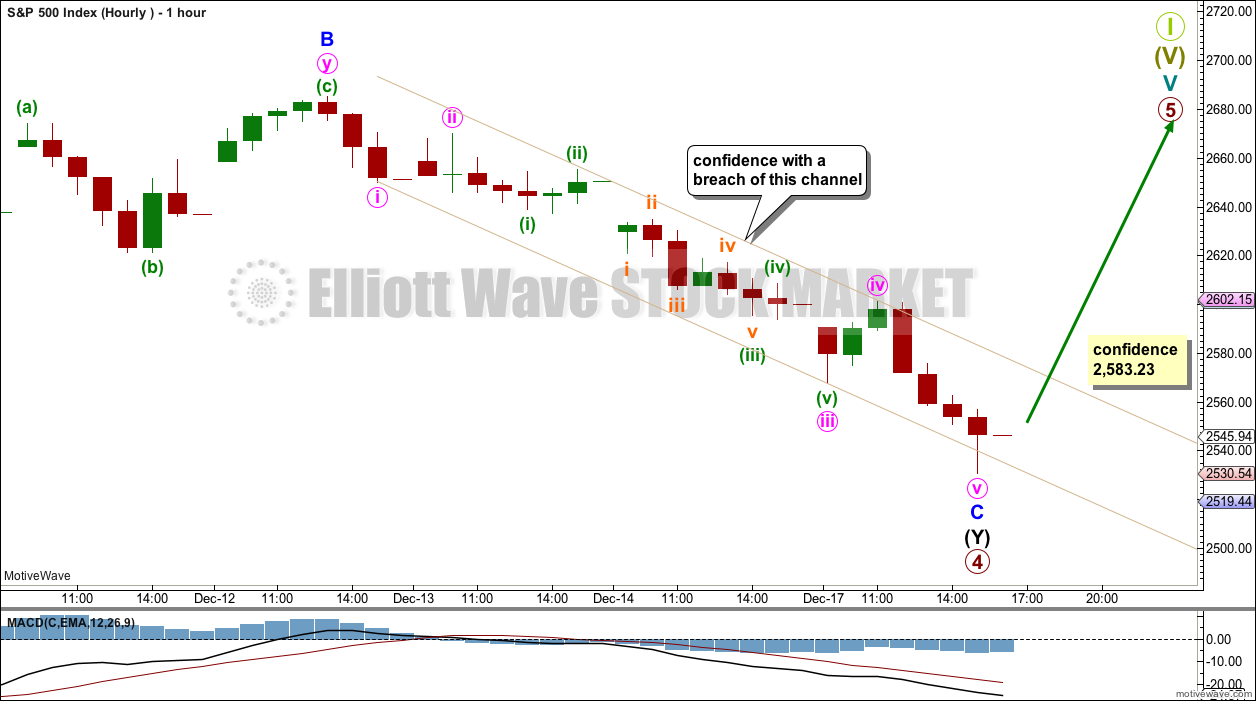
This hourly chart focusses on all of minor wave C within intermediate wave (Y). Minor wave C may today be a complete impulse. There is at the low a bullish Hammer candlestick reversal pattern.
A narrow best fit channel is drawn about minor wave C. A breach of this channel by upwards movement may be taken as an early indication that a low may be in place.
A new high above 2,583.23 would provide invalidation of the short-term structure for the alternate wave count below. At that stage, some confidence may be had in this main wave count.
FIRST ALTERNATE DAILY CHART
Click chart to enlarge.
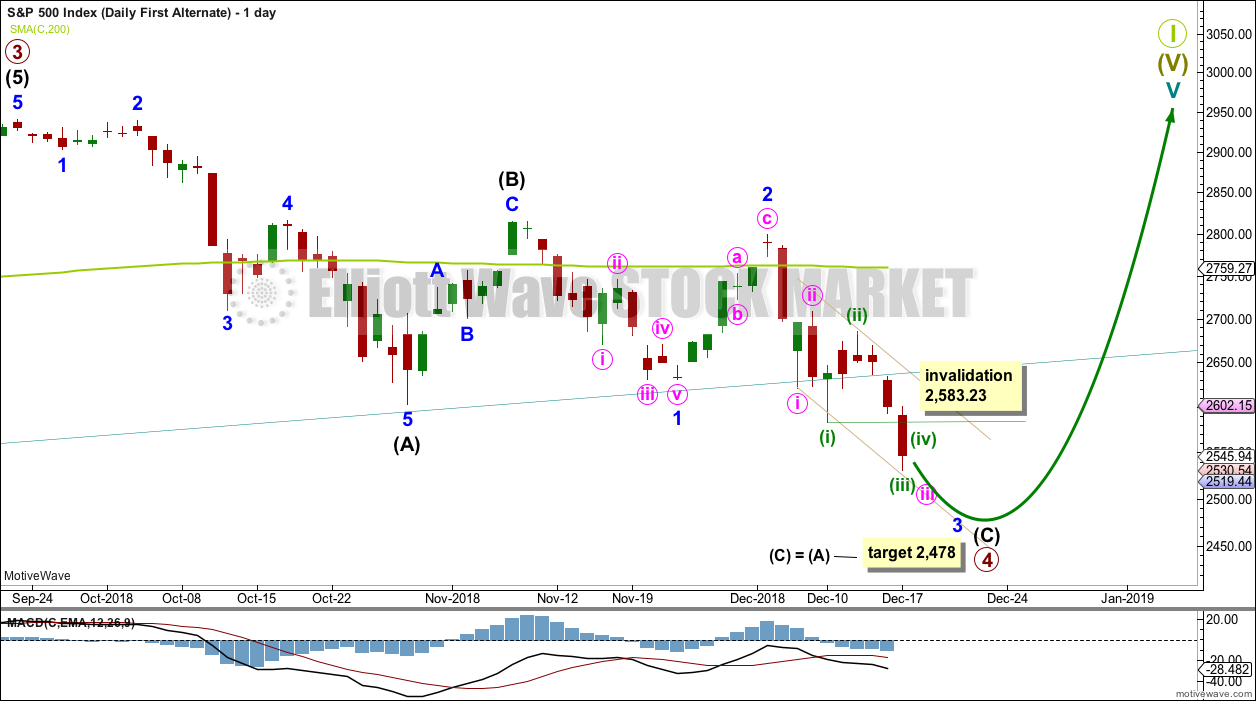
The other possible structure for intermediate wave (C) would be a simple impulse. If intermediate wave (C) is unfolding as an impulse, then it may now have three first and second waves complete. The middle of the third wave may have unfolded today, but it shows weaker momentum than the first wave.
Minuette wave (iv) may not move into minuette wave (i) price territory above 2,583.23.
This wave count would expect to see a very large breach of the teal trend channel on the weekly chart. This has not happened during the life of this trend channel.
The S&P commonly forms slow curving rounded tops. When it does this, it can breach channels only to continue on to make new all time highs. When it breaches upwards channels and then continues onwards, price often will find resistance at the lower edge of the channel. It is possible that Grand Super Cycle wave I may end in this way.
FIRST ALTERNATE HOURLY CHART
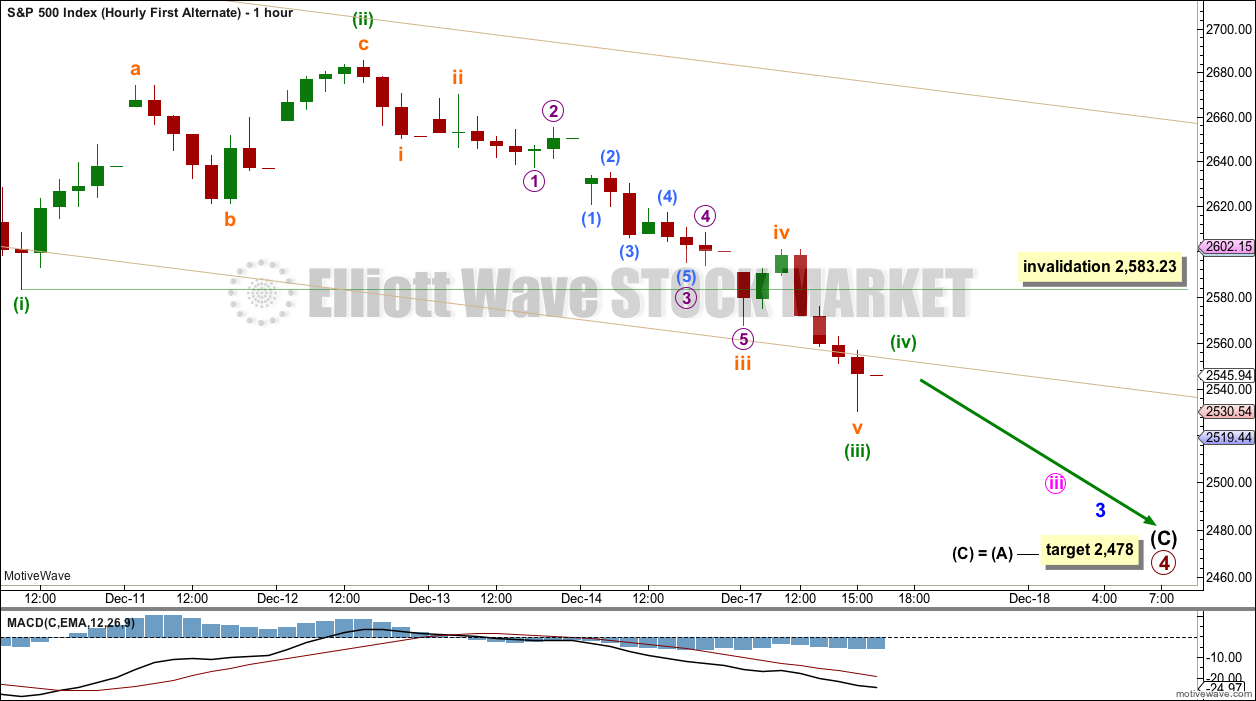
Click chart to enlarge.
An hourly chart is provided for those members who judge this more bearish wave count to be more likely.
Within a zigzag, A-B-C subdivides 5-3-5. Within an impulse, 1-2-3 subdivides 5-3-5. There is no difference in how the subdivisions at the hourly chart level are seen between the main and alternate wave counts. The degree of labelling and the larger picture are different.
If this wave count is correct, then a small series of fourth wave corrections may unfold: minuette wave (iv), then minute wave iv, and then finally minor wave 4. Each is to be followed by a fifth wave down. This may take another week to two to complete.
TECHNICAL ANALYSIS
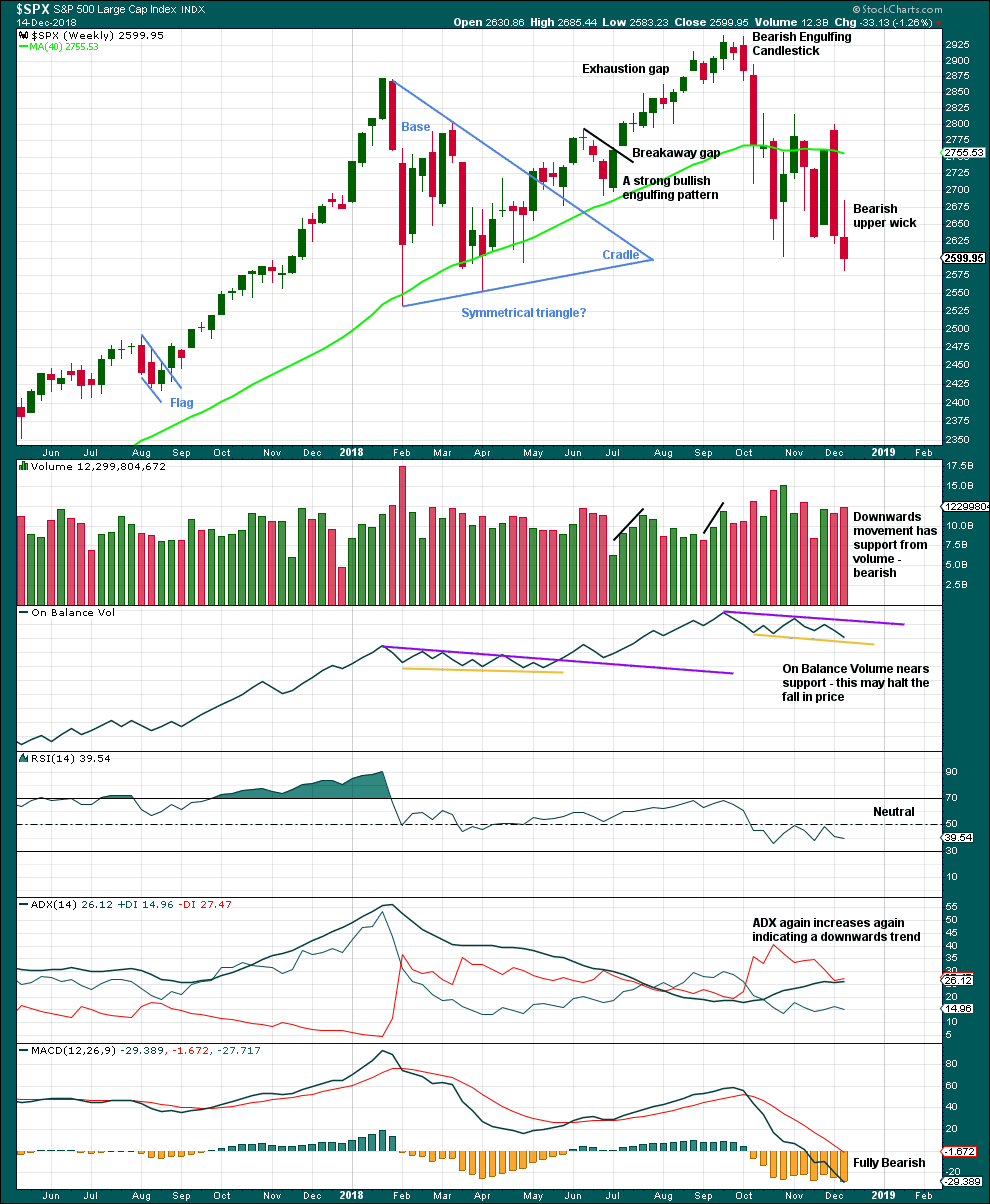
WEEKLY CHART
Click chart to enlarge. Chart courtesy of et=”_blank”>StockCharts.com.
The strongest volume for recent weeks is for the upwards week beginning 29th of October. This short-term volume profile at this time frame is bullish.
For a more bearish outlook a bearish signal from On Balance Volume would be preferred.
The last weekly candlestick has a bearish long upper wick, but it has a smaller real body and has not moved price substantially lower.
DAILY CHART
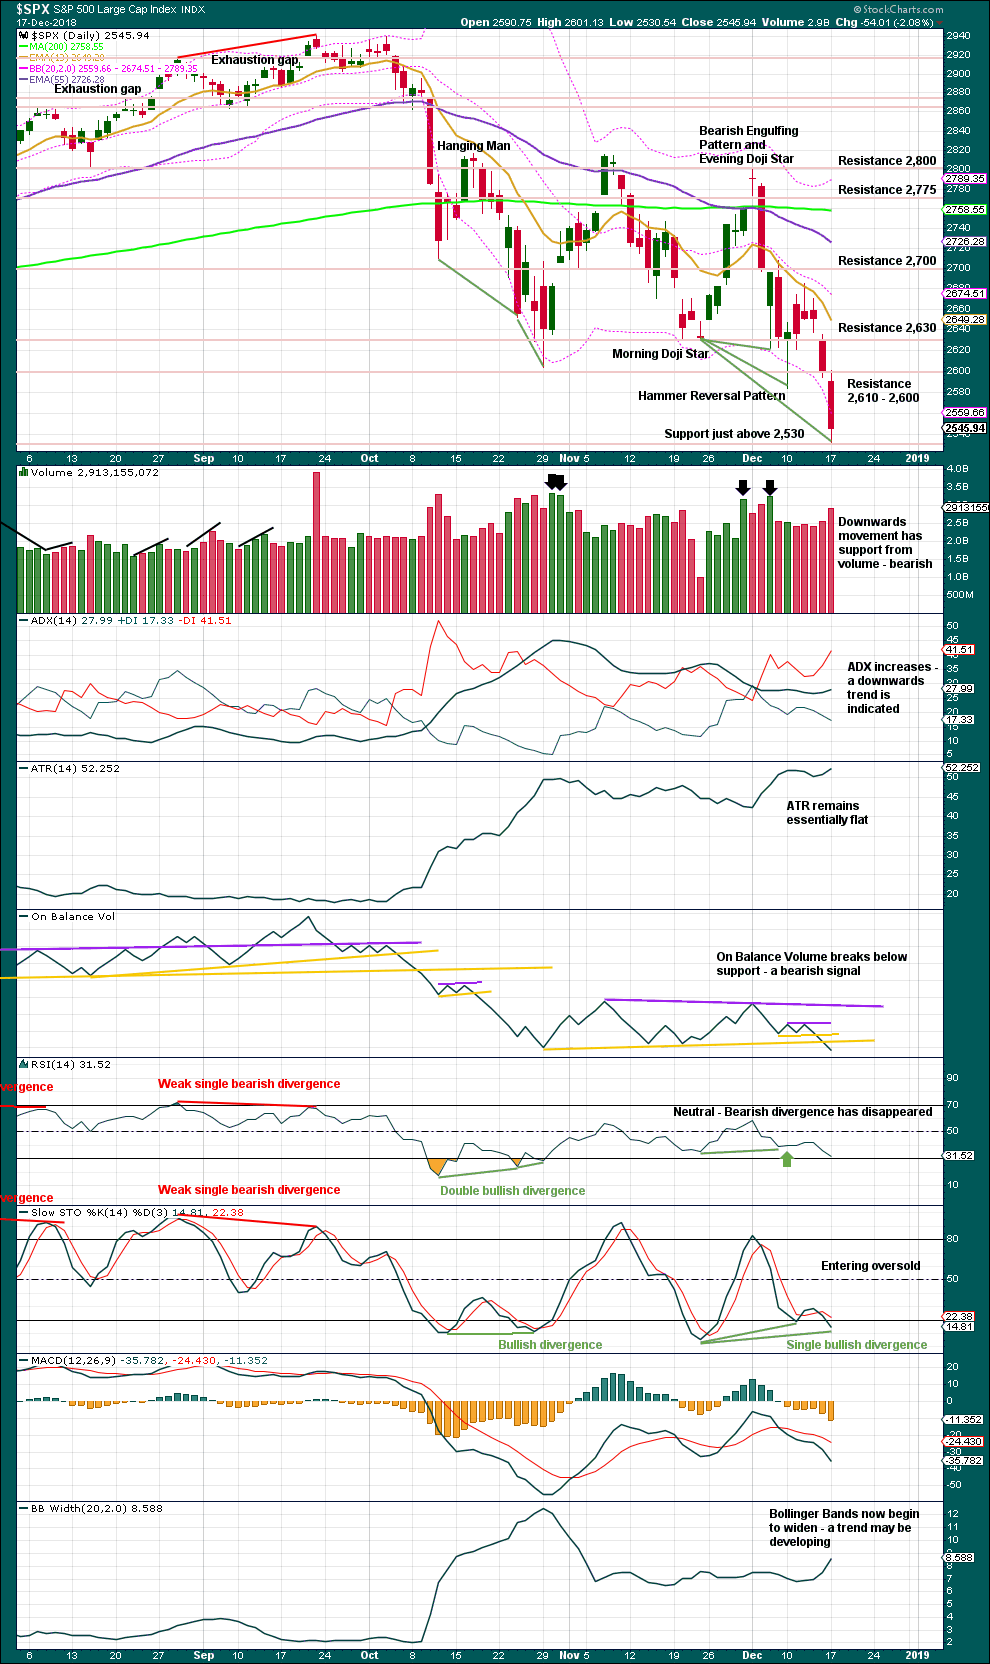
Click chart to enlarge. Chart courtesy of StockCharts.com.
The lower edge of the teal trend channel is not shown on this chart, but it should be considered as part of this technical analysis. This channel is now breached at the daily chart level, but because it is drawn on the weekly chart only a breach at the weekly chart level would be sufficient for a very bearish outlook to be seriously considered.
Today price has closed below support about 2,580 on a downwards day which has support from volume. This is a classic downwards breakout. Volume had indicated the breakout looked to be more likely upwards than downwards (this technique does not always work).
There is however very strong support here about 2,530. This is the lowest price point of cycle wave IV, in early February 2018.
Another bearish signal from On Balance Volume today offers more support to the alternate Elliott wave count.
BREADTH – AD LINE
WEEKLY CHART
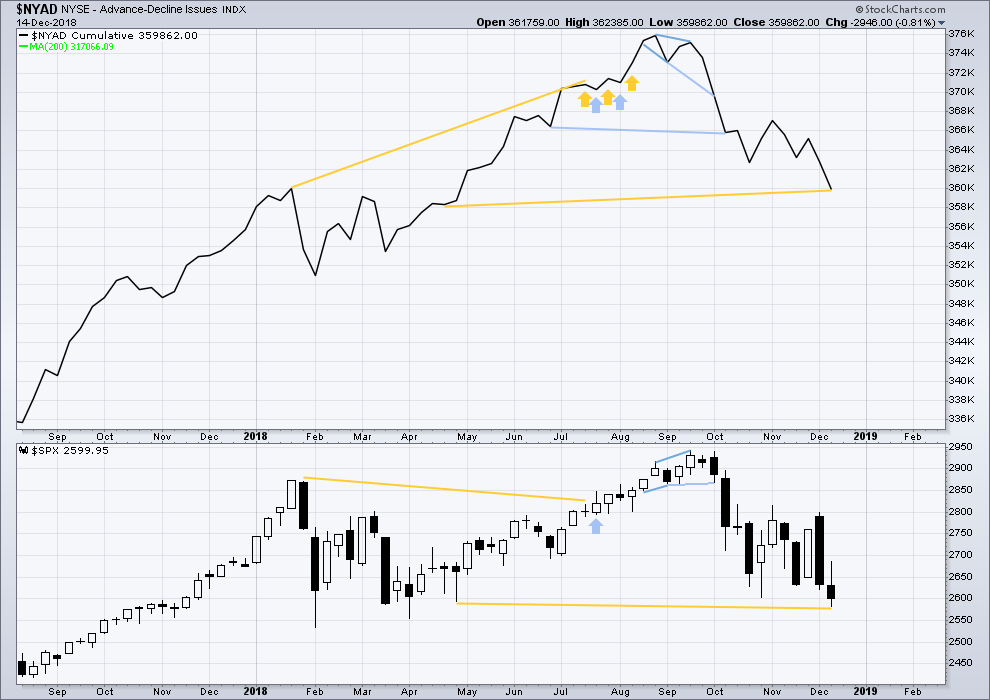
Click chart to enlarge. Chart courtesy of StockCharts.com. So that colour blind members are included, bearish signals
will be noted with blue and bullish signals with yellow.
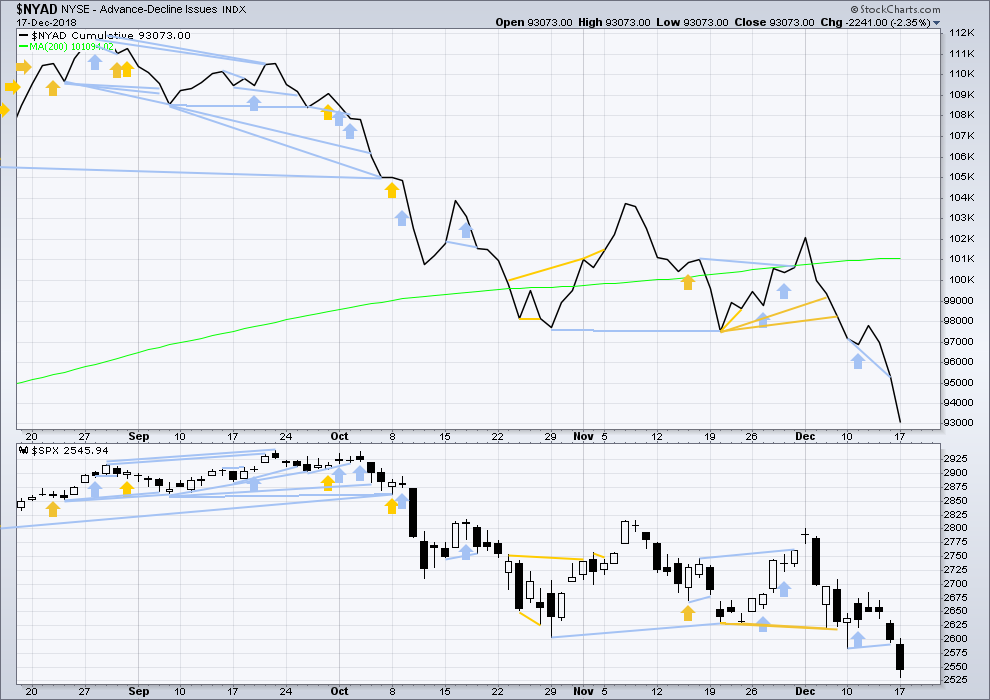
There is mid-term bullish divergence between price and the AD line. Last week price made new lows below the prior low of the week beginning the 30th of April, but the AD line has not. This indicates that downwards movement does not have support from a corresponding decline in market breadth; there is some weakness within price.
DAILY CHART
Click chart to enlarge. Chart courtesy of StockCharts.com. So that colour blind members are included, bearish signals
will be noted with blue and bullish signals with yellow.
There is normally 4-6 months divergence between price and market breadth prior to a full fledged bear market. This has been so for all major bear markets within the last 90 odd years. With no longer-term divergence yet at this point, any decline in price should be expected to be a pullback within an ongoing bull market and not necessarily the start of a bear market. New all time highs from the AD line on the 29th of August means that the beginning of any bear market may be at the end of December 2018, but it may of course be a lot longer than that.
Breadth should be read as a leading indicator.
Bearish divergence noted in last analysis has now been followed by more downwards movement. It may now be resolved, or it may need another downwards day to resolve it.
Nearing the end of this bull market, to the end of primary wave 5, bearish signals from the AD line may begin to accumulate.
VOLATILITY – INVERTED VIX CHART
WEEKLY CHART
Click chart to enlarge. Chart courtesy of StockCharts.com. So that colour blind members are included, bearish signals
will be noted with blue and bullish signals with yellow.
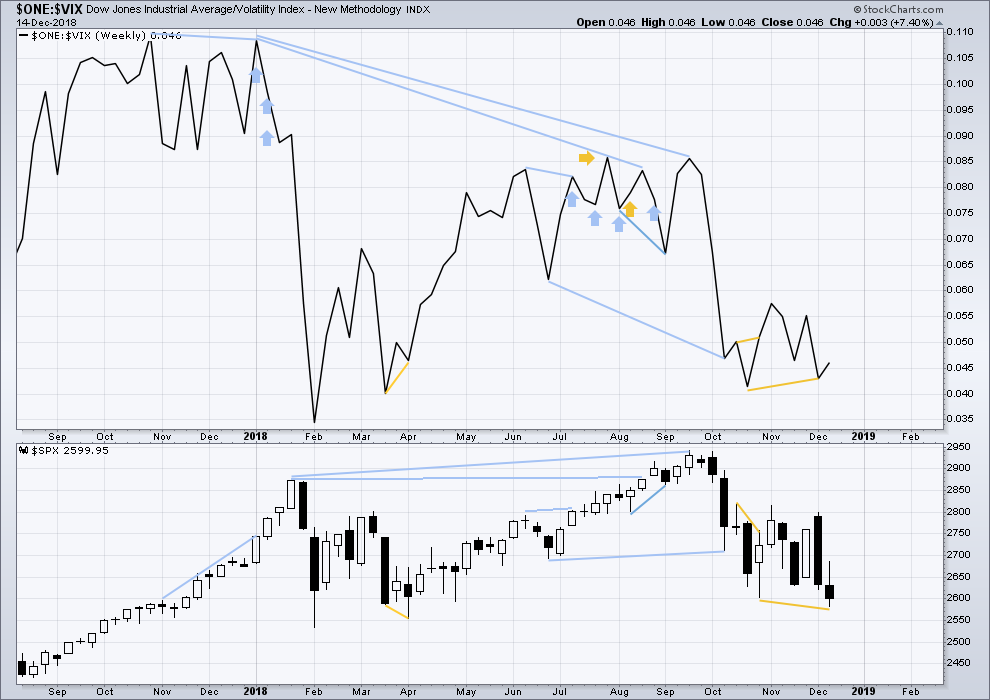
Last week price has made a new low below the prior swing low, but inverted VIX has not. This divergence is bullish and indicates downwards movement last week does not come with a normal corresponding increase in VIX.
DAILY CHART
Click chart to enlarge. Chart courtesy of StockCharts.com. So that colour blind members are included, bearish signals
will be noted with blue and bullish signals with yellow.
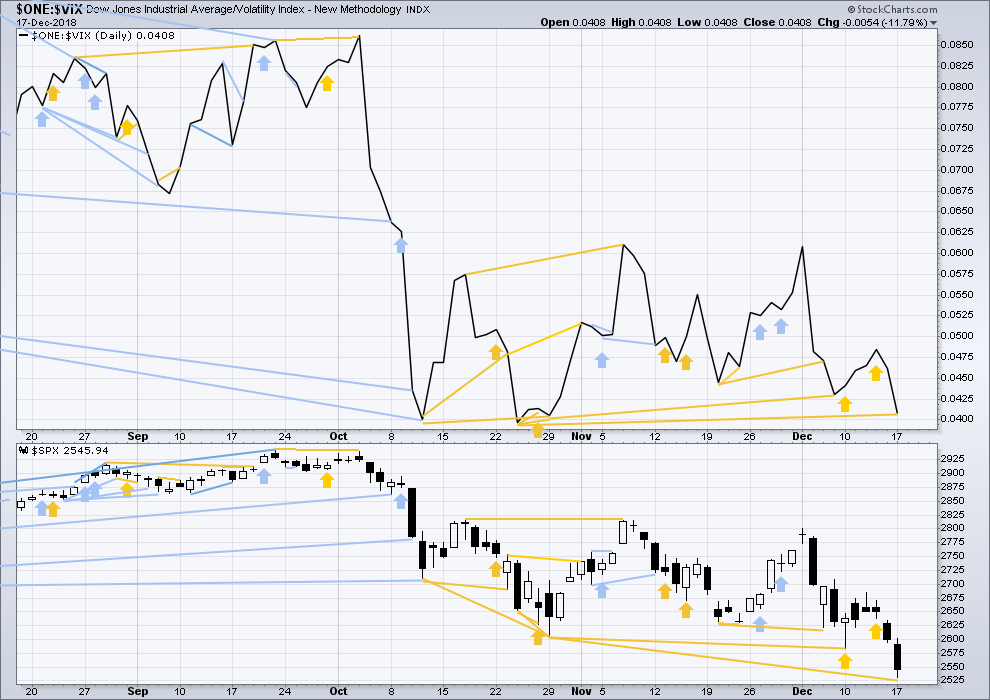
Normally, volatility should decline as price moves higher and increase as price moves lower. This means that normally inverted VIX should move in the same direction as price.
Like the AD line, inverted VIX may now begin to accumulate instances of bearish signals or divergence as a fifth wave at three large degrees comes to an end.
Today price has made a new low below the prior swing low about the 24th of October, but inverted VIX has not. This divergence is bullish. It indicates downwards movement here in price does not come with a normal corresponding increase in VIX.
DOW THEORY
The following lows need to be exceeded (at the close) for Dow Theory to confirm the end of the bull market and a change to a bear market:
DJIA: 23,344.52.
DJT: 9,806.79 – price has closed below this point on the 13th of December.
S&P500: 2,532.69.
Nasdaq: 6,630.67.
Published @ 09:26 p.m. EST.
—
Careful risk management protects your trading account(s).
Follow my two Golden Rules:
1. Always trade with stops.
2. Risk only 1-5% of equity on any one trade.
It’s time to go long ?
Like sell vol and sell down side puts and buy upside calls long ?
As long as you can do it again and bigger at 2478
These swings are crazy. Was that just +35 in 30 mins?
I know this is a gross oversimplication, but it feels like we are in for either an epic rally or fully enter a bear market post Fed decision tomorrow. The catalyst is big enough that the hourly charts almost feel irrelevant. The price action is unquestionably bearish but it can all change so quickly. If we are in a bear market, I think we all understand the medium to long term implications. It doesn’t “feel” like the right trade but I’m buying some more naked calls for Dec 21 – I think 100 pt rally over 1-2 days is realistic. I just get the sense if we are going to hit 2480 and actually hold it would have to be today or tomorrow am before announcement. Every Fed chair is tested by the markets and this one hasn’t really had to support the market yet…market looking for some reassurance that those in charge still support asset prices. Thanks for everyone’s feedback…I’m more macro/event based and much less technical than you all but really grateful for all the commentary.
Verne, a genuine question, how would you interpret this chart?
I would interpret it as VIX indicating weakness in price at this time. Normally, as I understand it, VIX should make new highs as the S&P makes new lows. As the S&P declines, volatility should increase.
But here I see the S&P moving lower to new lows, and VIX not moving higher to new highs.
Do you have another interpretation? Am I missing something here?
Don’t know about Verne, but to me, VIX here is screaming to break out to upside.
VIX is a cash index calculated on a weighted average of SPX options straddling a 30-day maturity (VIX is a 30-day SPX variance swap).
There are 2 exceptional holidays in the next 30-day period (12/25 and 01/01), 1 NYSE half-day (12/24), and 12/31 is a bond market half-day (normal day on the NYSE, but expect lower volumes). Thus, there is less variance expected in the next 30 calendar days because there will be less business (trading) days during that period. SPX options are priced accordingly (i.e. you think you see a much lower implied volatility, but it is just a technical effect), which directly affects the pricing of VIX.
Hence you cannot directly compare the VIX in October (no holidays in the next 30-day period) with the VIX currently (2 holidays + 1 half-day in the next 30-day period). Noting that VIX is not a tradable instrument (only VIX futures – they are forward on 30-day SPX variance swaps – are tradable), I would advise extreme cautious trying to read signal directly from the VIX. Note that VX1 (the continuous front month VIX future contract) has made a double top.
textbook bull flag…
I’m only going to be prepared to publish a wave count that sees an end to the bull market and a the bear market begun, when the channel is fully breached on the weekly chart.
And then, it would only be as an alternate.
Any consideration that a bear market began in September 2018 would mean the bear market began with only 17 days of divergence between price and the AD line. That has not happened in over 90 years. So I must judge it to have a low probability.
And then, as I’ve previously explained with a chart, the Elliott wave count would have a problem of gross disproportion within primary wave 3 of cycle wave V.
Today looks much more like a small consolidation within the ongoing downwards trend. This looks like the alternate wave count may be correct.
Updated chart for the alternate hourly count:
Minuette (iv) could be a triangle. But the labelling within it may change as it continues.
Main hourly updated:
No change. But this upwards movement doesn’t look convincing for this count.
Hi Verne,
I echo the sentiment already expressed here in giving thanks for your posts on this blog. They are very helpful and again, greatly appreciated. I especially appreciate your thoughts about this being a space to freely express opinions as well as presenting facts. Be that as it may, I am the person who several days ago indicated I heard some information regarding the death cross of the 50 day ma below the 200 day ma. Today you stated, “to dismiss bearish crosses is irrational in the extreme imho.”
Well, I admit may be irrational even extremely so. But you asked me why I would take a long position in the face of the ‘death cross’ and I answered by citing a report. I did not have the citation at the time. But I do now. Following is the report.
Beginning at the 32:30 minute mark, Chris Ciovacco in his youtube video of Dec. 7th spoke about the death cross . He said during the 1982 to 2000 secular bull market, the death cross occurred eight times demonstrating that the death cross is not necessarily a show stopper from a longer term perspective. Then he quotes an article in Market Watch dated Dec. 7, 2018 (11:52 ET) written by Mark Hulbert who investigated all DJIA death crosses from 1970 to today. As a result, Hulbert concluded this, “There has been no significant difference since 1970 between the stock market’s performance following Death Crosses and at all other times.”
Ciovacco went on to say in that video that the market is at an inflection point from which really ugly things can happen but equally really good things can happen. My long entry at the time has proven to be a poor choice. But I did not blatantly dismiss the death cross. Rather, I looked at the evidence over the last 48 years of death crosses and concluded it was not a show stopper to use Ciavocco’s words for the longer term trend of the equity markets.
Irrational? Extremely irrational? I don’t know. But I think I rely upon many rational arguments like Lowry’s data indicating in the past 99 years a (long term) bear market has not begun without the AD line breath indicator first demonstrating negative divergence four months previous to the top.
Again, I greatly appreciate your posts and those of all contributors on this blog. If my comments have caused you any hesitancy in posting, I apologize. Please reconsider and continue to provide the significantly helpful posts you have always provided in the past.
May we all have a very Merry Christmas holiday and may 2019 bring health and prosperity to each and every one of us. Blessings to you all.
This “death cross” data you cite Rodney is another example why I discount just about all of these “small sample” theories about the significance of “patterns”, and effectively “derived patterns” (moving average “events”, which is events between different sets of price derived data).
There’s never enough data to make any statistically significant conclusions. Now if something happens 19 times out of 20…then maybe. But usually these things are of the type of “63% of the time the market went up 5% over the next 6 months”, on a data set of perhaps 100 samples. Sorry, but such a result is WELL within reasonable variance given such a small sample size. Hence, I view all of Bulkowski work as mere statistical noise.
Larry Williams had the extreme of this. He’d analyze the “trading day of the month” results a cross 10-15 years of commodity trading data. And he’d conclude that “oh, the 5th trading day of the month is a really good day for gold!”. Well, if you just randomly assign results to every trading day of the month across 15 years, you’ll find that a few of the trading days are REALLY GOOD days! I.e., they randomly were the outliers of of an normal distribution. Yet obviously the next month’s “winning” trading day is going to have a random result with no bias, because that’s how we are generating the “results”. Ergo, his entire logic is a statistical fallacy.
Beware BIG TIME anytime someone tries to use statistics to make a claim about likely market behavior. 99 times out of 100, they are in la-la-land. In my statistical opinion. Showing true correllation requires LOTS and LOTS of data.
99 times out of 100 ….that made me smile.
I will heartily echo the sentiment too that your comments and participation here is most appreciated Verne.
Personally, I value your contribution very highly.
No problem Rod. No need to aologize my friend as you and Ihave known each other too long to take offense at trivia.
Perhaps I should have chosen a different word to express my dismay at anyone’s attempting to down-play the significance of a bearish MA cross, and particularly in the current market context.
I agree with you that historical market precedent is important. However, there is also such a thing as “normalcy bias”
When I see market price action that does not comport with my own ecpectations based on historical expectations, I simply have yo re-examine the validity of those expectations. Think about it. This market has ALREADY done things that are a startling departure from historical precedent
Why would it surprise if it continued to fo the unexpected? 🙂
Thank You Verne for that detailed explanatory post
I second this thanks
Another gap up…. to another sell off?
I like BAC here. Turning off a 78.6% retrace at the weekly/monthly timeframe, and held that level for the last 8 or so trading sessions through this market sell off. Hourly trend has just now shifted to strong up. Price at 25, and upper bollinger/keltner band at daily tf is was up around 28. I have and have added to my Feb calls strike 24.
Note: this is a borderline trade re: “with the trend”. The monthly trend is neutral. Of course the weekly is strong down. But now the potential new up trend is migrating from the 5 minute (strong up) to the hourly (now strong up)….
“The doctrine that the world is made up of objects whose existence is independent of human consciousness turns out to be in conflict with quantum mechanics and with facts established by experiment.” -Bernard d’Espagnat
Something to noodle on while waiting for the market to do something…what you conclude about the nature of reality from this…well, it’s awfully controversial. But not the facts of quantum mechanics. Those are proven 10x over.
Interesting
I love mixing trading with a little esoteric thought
Would you mind giving exact examples of the proofs of quantum mechanics .
Experiments ect … repeated observations
I feel we live in a world sometimes that is more scientism than science ..
So am always I nterested in what people consider concrete proof these days
Especially on very interesting topics
I subscribe to zetetic observation in regards to science
Is it observable .. repeatable.. and scalable
I find if it’s not… it becomes just an over reliance on mathematical formulas and theories
Quantum mechanics is perhaps the most proven set of scientific facts ever developed and rigorously tested. There are many, many sources of information about the history of QM and the testing (and ongoing testing) of the theory. Vast amounts of our current technologies are based on quantum mechanics. Additionally, there have been relatively recent experimental results validating some previously “only theoretical” results such as instantaneous action across large distances (“spooky action at a distance” was the term Einstein used for it; now it’s called “entanglement”).
If you want to understand the fundamental “oddity” at the heart of QM, I recommend the book “The Quantum Enigma”. The essence of the “oddity” (a vast understatement!) is expressed in the quote I provided, but the weirdness really only starts there. And there are many different alternative explanations of what is “really happening” in this reality as a result; these are well described in this book. One is that this is a type of “simulation” (at the quantum level) being operating in a transcendent reality outside of this spacetime continuum. I tend towards that one myself. But check it out; there are others, and each is yet more “insane” relative to our everyday notions of reality.
Are there specific examples that can be pointed to…
That can demonstrate it
That can be witnessed
Not being difficult .. but saying there are dozens of things that factually prove something .. is just relying on literature
If something is a fact … it should be able to be demonstrated clearly
In concept and application
This I feel is the problem with many forms of modern science …
More faith than religion
But in faith in numbers and theories …
So what would an example of proven quantum mechanics be in your opinion …
Like people think this or that .. and objects appear… or reality shifts
I agree on these concepts in some degree and law of attraction
The hermetic principles
Law of rhythm and polarity
Ect
I guess my main interests
Is quantum mechanics the infrastructure behind powers of manifestation
QM describes how things (at the finest unit of matter/energy) “are” in our universe. Essentially, they are “a probability of existing in this area with this velocity”. And it demonstrates that the instantiation of matter/energy (by energy I refer primarily to photons/light waves) only occurs when OBSERVED. By us. This “instantiation” is shown to occur across time. I.e. the state of an unobserved photographic plate will show one thing given the existence of corroborating evidence (specifically a dot of light on the left or right corresponding to which slit in a barrior a photon went through). But if you DON’T observe that evidence (of which slit the photon went through) and DESTROY that , and you haven’t yet looked at that photographic plate (recorded in the past)…oops, it shows a diffraction pattern. You can repeat this experiment ad-infinitum: don’t destroy the corroborating evidence (or look at it), and the plate shows an appropriate dot of light. Destroy the evidence before looking at the plate…then look at the plate…it’s a diffraction pattern. WHAT HAPPENED IN THE PAST DIDN’T HAPPEN AT ALL (didn’t instantiate across time) until NECESSARY due to the potential or fact of conscious observation.
None of this fits with our general concepts of a causal and time order universe. If you require that QM fit in with personal notions of rationality of an external reality operating independently of us, forget about it. QM shows our reality isn’t actually like that. Reality requires an observer. Or there’s only probabilities of reality. And those probabilities instantiate into events across time as required due to observation. Queue the twilight zone music here…
Hi Ari.
I cannot remember a time when the market has behaved in a more bearish way than even I expected. Those of you who have been around awhile will get my drift. I was fairly confident that indicators were pointing to at the very least a test of the Feb lows. I have pointed out a few times that normally bullish signals in a bear market must be viewed with greater cautiion. If, for example, you have been interpreting long candlestick tails as reversal signals the last few weeks, that has been at best a lost opportunity, and at worst, a costly trading mistake. Even positive divergences at all the recent lows have so far failed to produce a serious bounce. I knew I was wrong yesterday when VIX failed to confirm an interim low and you saw what happened.
I think as traders, we need to keep the larger picture in mind. Many of you have heard me comment ad nauseam about the scary vol situation. In my humble opinion, that has STILL not been fully unwound. For VIX to be trading at these levels considering what the market has done in December is absolutely astonishing and shows a very complacent trading and investing community completely divorced from any understanding of the real risks in this market.
The selling we have seen so far has been orderly, and is very likely margin call exits, and forced liquidation of passive instruments as they rebalance to reflect the decline, especially in tech and small caps. We really have not seen true panic selling.
We also have the evidence of important moving averages. I strongly disagree with those who dismiss these kinds of crosses. When you think about what price needs to do persistently over time, and after a bull market of this duration, to dismiss bearish crosses is irrational in th extreme imho.
Finally, it does look as if we have a confirmed H&S pattern with a neckline break. The target is quite a ways lower. Any bounce here in my opinion would have to be viewed as counter-trend.
I also would like to just say that in my experience, traders are generally, (not always, mind you) better at sniffing out important market turns than analysts. When you trade the market daily, you are sensitive to subtle shift changes in momentum and psychology which both affect price action. The persistent uptrend in VIX and UVXY has also been noteworthy. We have some better than average traders on the forum, so I have to confess I have been a bit stunned (yes, AND frustrated) that so few were of the opinion that we had experienced a significant change in trend, and some called for me to demonstrate what was so abundantly clear. We all respect and value Lara’s highly skilled and experienced analysis. As traders we should be also willing to bring our voices to the table to help inform the analysis. I admit I personally was somewhat reticent despite being taken aback at the early call for the end of a primary degree wave, While I may no longer post as often, it is my sincere hope that the forum remains a place where differing perspectives can be expressed freely, provided done in a considerate and respectful fashion.
Merry Christmas, and a most prosperous new year everyone!
Dec vix futures expire tomorrow morning at 10…
There was large positions short on those .. and the constant hammer of selling from a low of 16.35 a couple weeks ago and the trade going against that strategy has put strong down selling on the markets
Algo programs have been using a short near vix futures hammer to drive corresponding buying in s and p futures for quite sometime
That along with a gold short
When that trade doesn’t work.. you see what happens
The roll over into January vix contracts should offer some release as they are high priced and the backwardation into February may turn into contango quickly
I have found the always looking at gold and vix futures behaviors can give you a little edge on how far up the price of the s and p can be pushed
The push above 43 yesterday in VXX did feel a lot like an unwind and capitulation
Unless there is unwelcome news from the fed …
If that happens or some other unexpected bad news in the next day or two
The market is open to a large fall
The fraud that is Tesla was artificially ( I think illegally ) bid up the last few weeks to meet a conversion price of debt at 360
That is why it was going up while the market was in flames around it
That leaves a lot of meat on that bone for people wanting a place to find some downside exposure on concerns of a larger drop
And with the size of the stock some cheap weeklies or bear spreads can be bought mid to late week… that could bring some nice returns
They have been sellling it off after midday on fridays opex
And .35-.85 cent contracts have been turning into $2-5 by end of day…
It’s a great way to dump shares in bulk when you buy up large put positions on the cheap and then sell the underlying
Sold 1/2 my 257-255 put assignment at 256.80 from yesterday’s spreads on the s and p
A nice little profit from..
Also still holding the risk reversal leg of the 259-261 spreads for Wednesday
I am thinking about what I am going to do with those
Will sell the rest of the assignment above 257
Thanks Verne. Yeah I miss your input. Post more often my man
I have been reading that a very large number of Hedge Funds are closing down. Also, in addition to reading… I have been hearing from friends that the redemption requests to Hedge Funds are HUGE… higher than being written about.
The selling and covering is a direct result of all of this… It explains the volatility here in December and that volatility will continue until all of this is completed.
So the key will be figuring out the right count in play and somehow finding signs that this forced selling and covering is about to subside… not sure how to see that part of it. For longer-term trades… that is when to execute the BUY for the specific count in play.
Sp 2583 is the buy signal right?
As far as Lara’s counts
I think “buy signal” is an inaccurate term.
Lara doesn’t give direct trading advice (buy/sell recommendations per se or “buy signals” etc.).
It’s a level that confirms the count and/or invalidates an alternative count. How you use it is up to you.
Yeah man
That’s right
The SPX monthly timeframe trend is neutral. Not down.
Bulkowski’s head and shoulder pattern results show a moderate bias towards being “successful” (predicting a significant market decline) across what, a few hundred data samples? I don’t have the books anymore but usually his data sets were on the order of 70-200 samples. Statistically insignificant.
That said, sure, the market may continue a lot lower. The weekly trend and daily trends are strongly down. We have a wave count model that calls for another 100+ points of selling to finish the P4.
What we don’t have is any wave count model that calls for a radically oversized P4, with prices heading down to 2200 or so (there price range I believe a HS “measured move” would take SPX to).
Not arguing, just sharing my data. As you say, all viewpoints should be presentable here.
Lara has not supplied one
But I have seen several with 2942 being the end of p5
Which would allow for the decline
And this being a 3 of 3 or thereabouts we are in…
With things about to get a little wild
Hi yah Verne! Considering how the day ended today, what’s your outlook. You still think we’ve made an interim low?
I am passing the first comment carrot to whoever posts second.
Sounds good to me, Doc…