
Another downwards day remains above the invalidation point on the main Elliott wave count. Two alternate Elliott wave counts are published for members today.
Summary: With the data in hand, it still looks like a low may more likely be in place. This view has support from mid-term bullish divergence between price and both of the AD line and inverted VIX, with short-term divergence between price and both of RSI and Stochastics, and a bullish candlestick reversal pattern at the last low. The target remains at 3,070 for this bull market to end next year, either in March or October.
Two alternate Elliott wave counts allow for more downwards movement here for the short term. If price makes a new low below 2,583.23, then it is possible a low may be found very quickly. If not, then the target for the end of primary wave 4 would be about 2,478.
New updates to this analysis are in bold.
The biggest picture, Grand Super Cycle analysis, is here.
Last published monthly chart is here, video is here.
MAIN ELLIOTT WAVE COUNT
WEEKLY CHART
Click chart to enlarge.
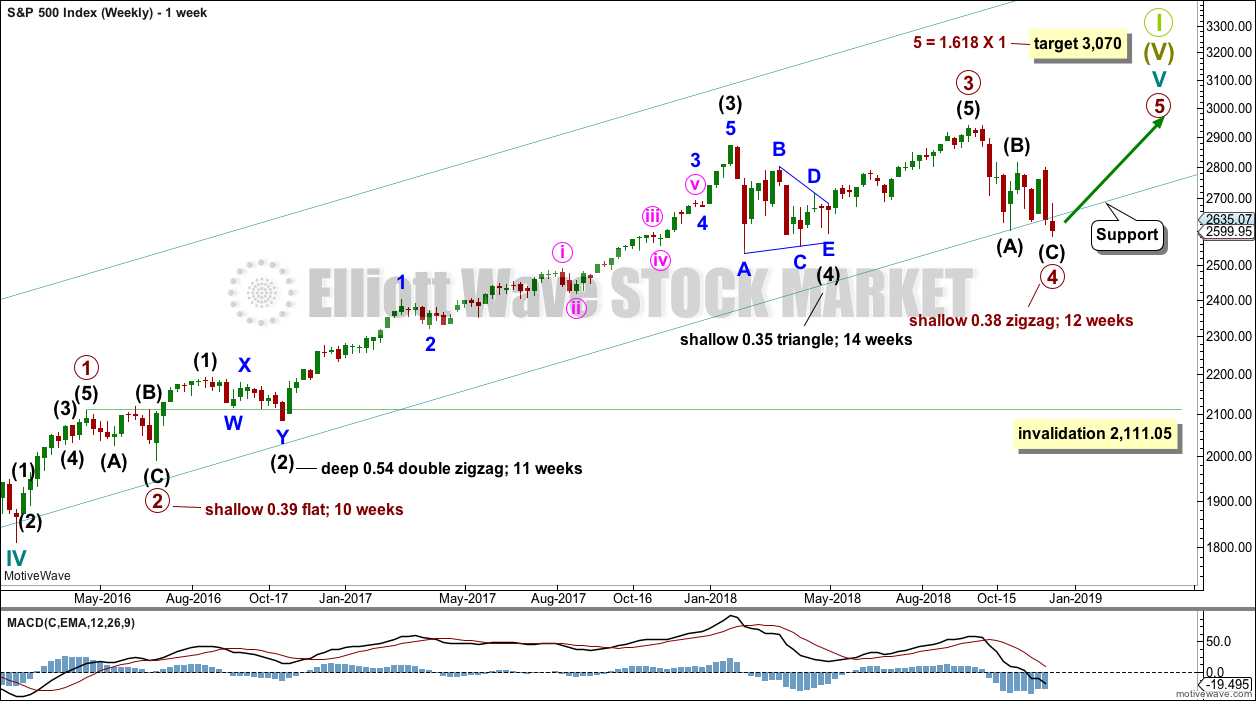
Cycle wave V must complete as a five structure, which should look clear at the weekly chart level and also at the monthly chart level. It may only be an impulse or ending diagonal. It is clear it is an impulse.
Within primary wave 3, there is perfect alternation and excellent proportion between intermediate waves (2) and (4).
Draw the teal channel from the high of cycle wave I at 1,343.80 on the week beginning 3rd July 2011, to the high of cycle wave III at 2,079.46 on the week beginning 30th November 2014, and place a parallel copy on the low of cycle wave II at 1,074.77 on the week beginning 2nd October 2011. Draw this chart on a semi-log scale. A small overshoot, like that seen at the end of cycle wave IV, would be entirely acceptable.
The channel has now been overshot twice at the end of primary wave 4. This is acceptable. If this wave count is correct, then a breach of this channel would be unlikely. A breach may be defined as a full weekly candlestick below and not touching the lower trend line.
This wave count has the right look at the monthly chart level.
If primary wave 5 ends at or after the end of December 2018 and the AD line fails to make new all time highs, there would then be the minimum required four months of bearish divergence between price and the AD line. If this happens, then the conditions for the end of this bull market would be in place.
Primary wave 4 may not move into primary wave 1 price territory below 2,111.05.
Three daily charts are published.
DAILY CHART
Click chart to enlarge.
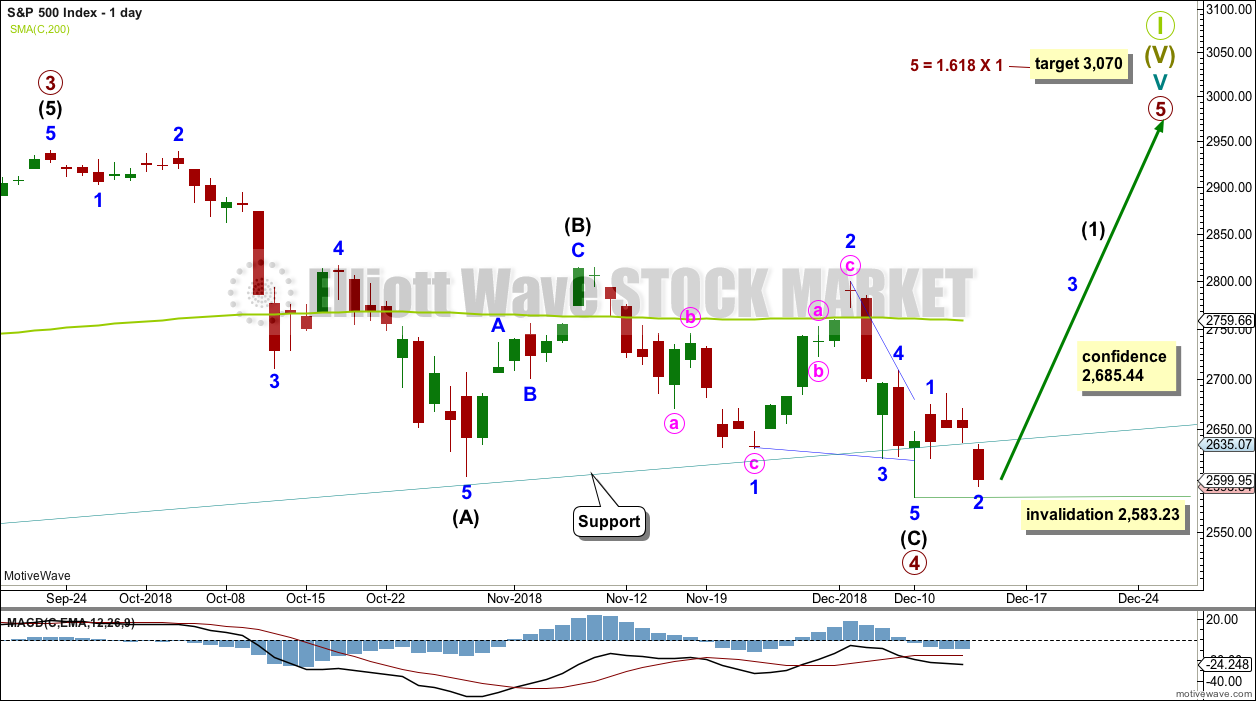
Primary wave 4 may be a complete single zigzag.
Within the zigzag, intermediate wave (C) must subdivide as a five wave structure. It may be a complete ending contracting diagonal.
Within the ending diagonal, all sub-waves must subdivide as zigzags, minor wave 4 must overlap minor wave 1 price territory, and minor wave 4 may not move beyond the end of minor wave 2 above 2,800.18.
Minor wave 5 may have ended with an overshoot of the 1-3 trend line.
If primary wave 5 were to only reach equality in length with primary wave 1, it would be truncated. The next Fibonacci ratio in the sequence is used to calculate a target.
Within primary wave 5, minor wave 2 may not move beyond the start of minor wave 1 below 2,583.23.
HOURLY CHART
Click chart to enlarge.
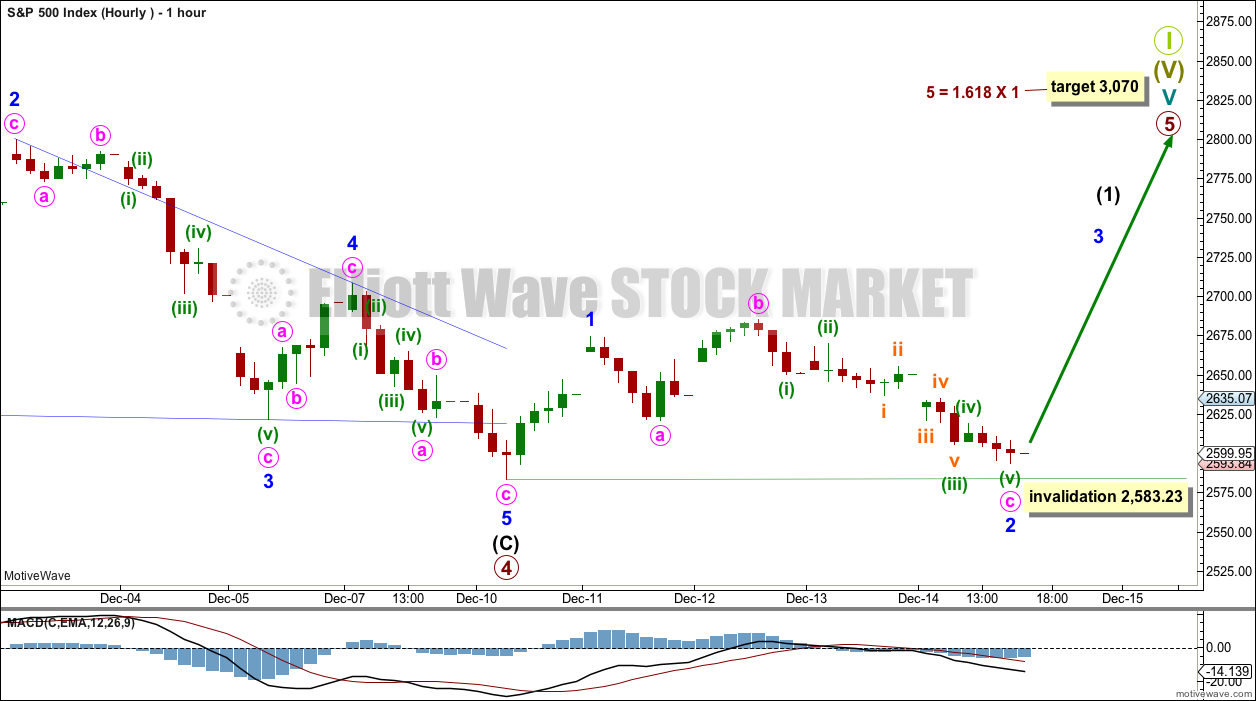
Within the new trend of primary wave 5, minor wave 2 may not move beyond the start of minor wave 1 below 2,583.23.
The degree of labelling is moved up one degree today. Minor wave 1 may have been a relatively quick impulse, and now minor wave 2 may be a complete expanded flat correction. Within the expanded flat, minute wave c is 5.77 points longer than 1.618 the length of minute wave a, and minute wave b is 1.21 times the length of minute wave a, which is within the common range of 1 to 1.38 times the length of minute wave a.
This wave count now expects an increase in upwards momentum to begin on Monday as a third wave upwards begins.
FIRST ALTERNATE DAILY CHART
Click chart to enlarge.
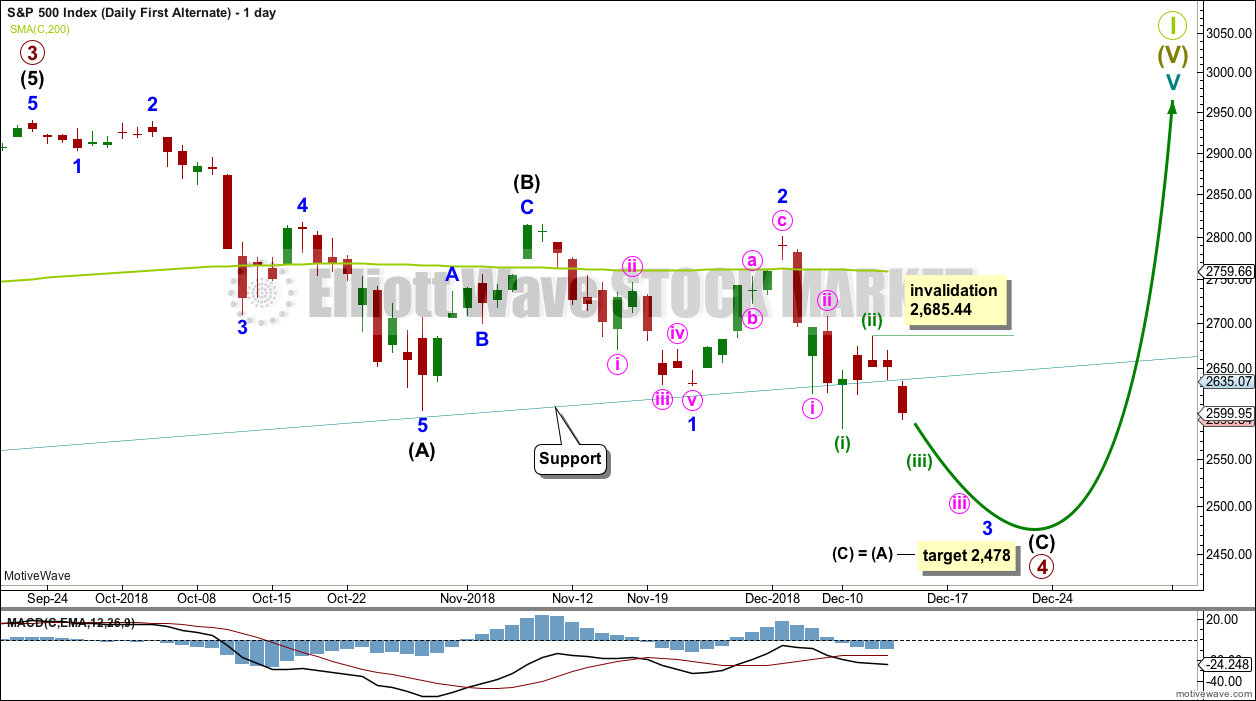
The other possible structure for intermediate wave (C) would be a simple impulse. If intermediate wave (C) is unfolding as an impulse, then it may now have three first and second waves complete. This wave count would expect to see an increase in downwards momentum as the middle of a third wave unfolds.
Within minute wave iii, minuette wave (ii) may not move beyond the start of minuette wave (i) above 2,709.21.
This wave count would expect to see a very large breach of the teal trend channel on the weekly chart. This has not happened during the life of this trend channel.
The S&P commonly forms slow curving rounded tops. When it does this, it can breach channels only to continue on to make new all time highs. When it breaches upwards channels and then continues onwards, price often will find resistance at the lower edge of the channel. It is possible that Super Cycle wave I may end in this way.
SECOND ALTERNATE DAILY CHART
Click chart to enlarge.
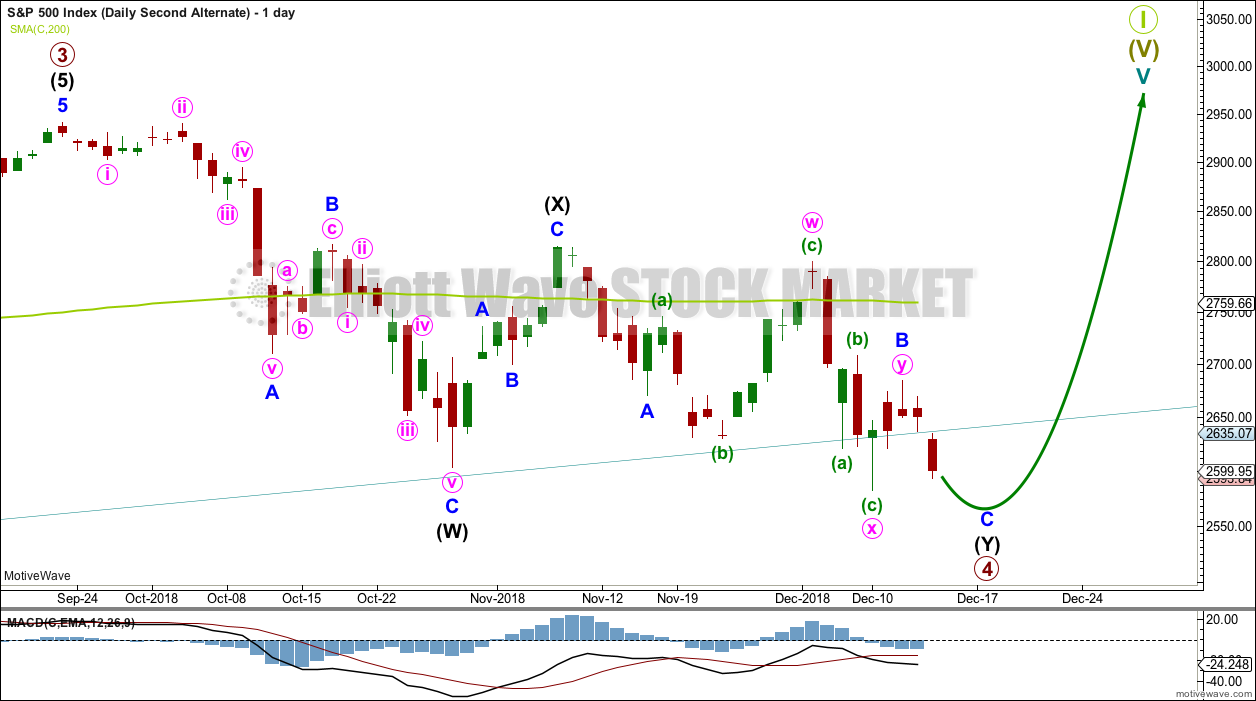
While the first two daily charts consider primary wave 4 as a single zigzag, this second daily alternate chart considers primary wave 4 as a double zigzag.
The first zigzag in the double is complete and labelled intermediate wave (W). The double is joined by a complete three in the opposite direction, a zigzag labelled intermediate wave (X). The second zigzag in the double may be incomplete, which is labelled intermediate wave (Y).
Within the second zigzag of intermediate wave (Y), minor waves A and B may be complete. Minor wave B is labeled as a possible double combination. All subdivisions fit perfectly, but this structure has a downwards slope. Double combinations are fairly common structures, but they normally have a sideways look. This one does not. However, the S&P does not always have normal looking structures. This is an acceptable alternate wave count for this market.
This wave count allows for a very little more downwards movement to a new low next week, followed by a quick reversal. This wave count would expect to see the teal trend channel overshot by next week’s weekly candlestick but not properly breached.
TECHNICAL ANALYSIS
WEEKLY CHART
Click chart to enlarge. Chart courtesy of et=”_blank”>StockCharts.com.
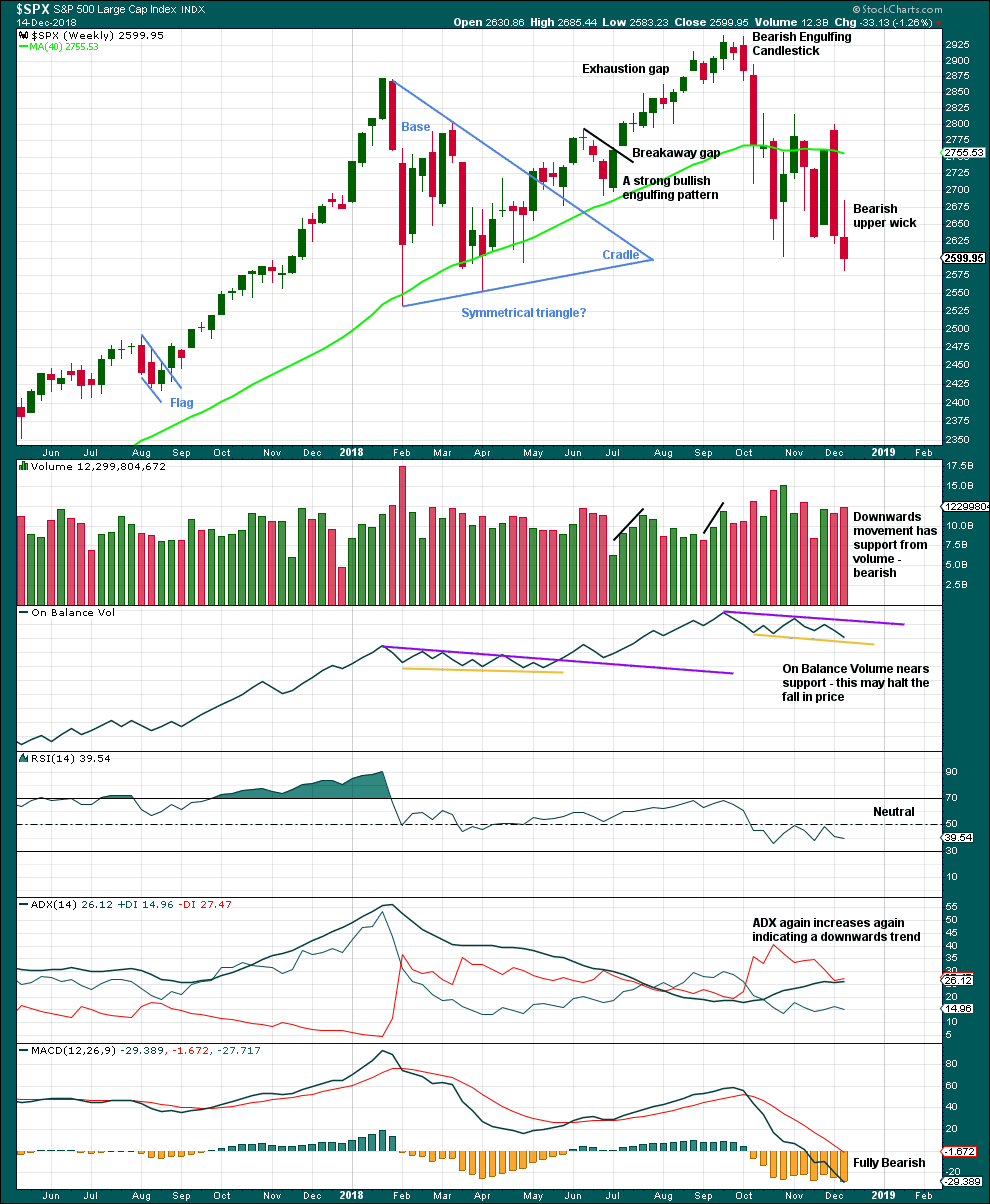
The strongest volume for recent weeks is for the upwards week beginning 29th of October. This short-term volume profile at this time frame is bullish.
For a more bearish outlook a bearish signal from On Balance Volume would be preferred.
The last weekly candlestick has a bearish long upper wick, but it has a smaller real body and has not moved price substantially lower.
DAILY CHART
Click chart to enlarge. Chart courtesy of StockCharts.com.
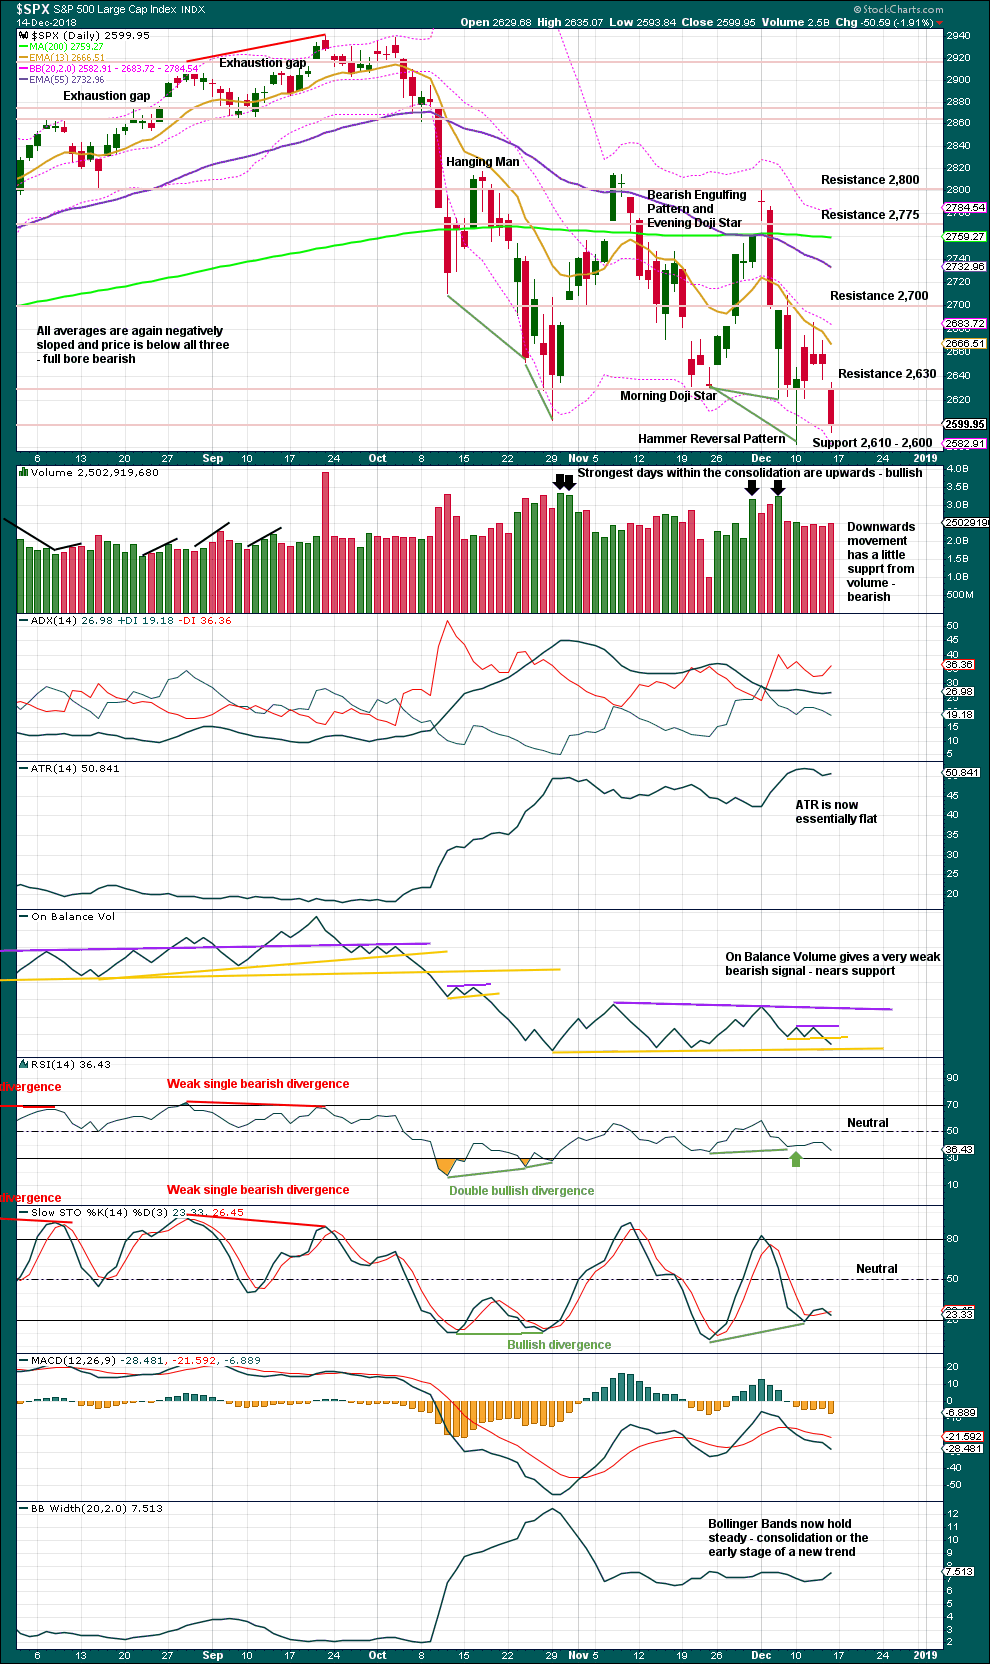
The lower edge of the teal trend channel is not shown on this chart, but it should be considered as part of this technical analysis. Expect that trend line to continue to provide support, until it does not.
A downwards trend ended on the 29th of October and a sideways consolidation began on that date. Price is bound with resistance above about 2,800 – 2,815 and final support below about 2,630 – 2,580. It is four upwards days during this consolidation that have strongest volume. This suggests an upwards breakout is more likely than downwards. This technique does not always work, but it works more often than it fails. In this instance, because the number of days in agreement is four, it has a little more confidence.
While volume has slightly increased on Friday for a downwards day, volume is still weaker than previous upwards days.
The signal from On Balance Volume is very weak because the line breached had only the minimum two anchor points and was very short.
There is still bullish divergence between price and both of RSI and Stochastics.
BREADTH – AD LINE
WEEKLY CHART
Click chart to enlarge. Chart courtesy of StockCharts.com. So that colour blind members are included, bearish signals
will be noted with blue and bullish signals with yellow.
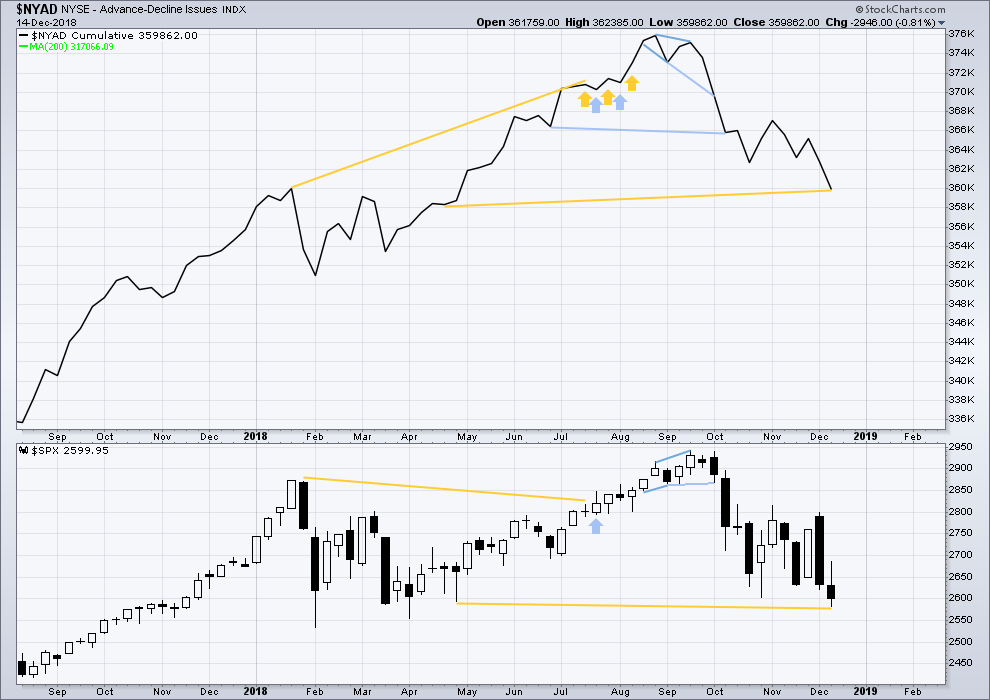
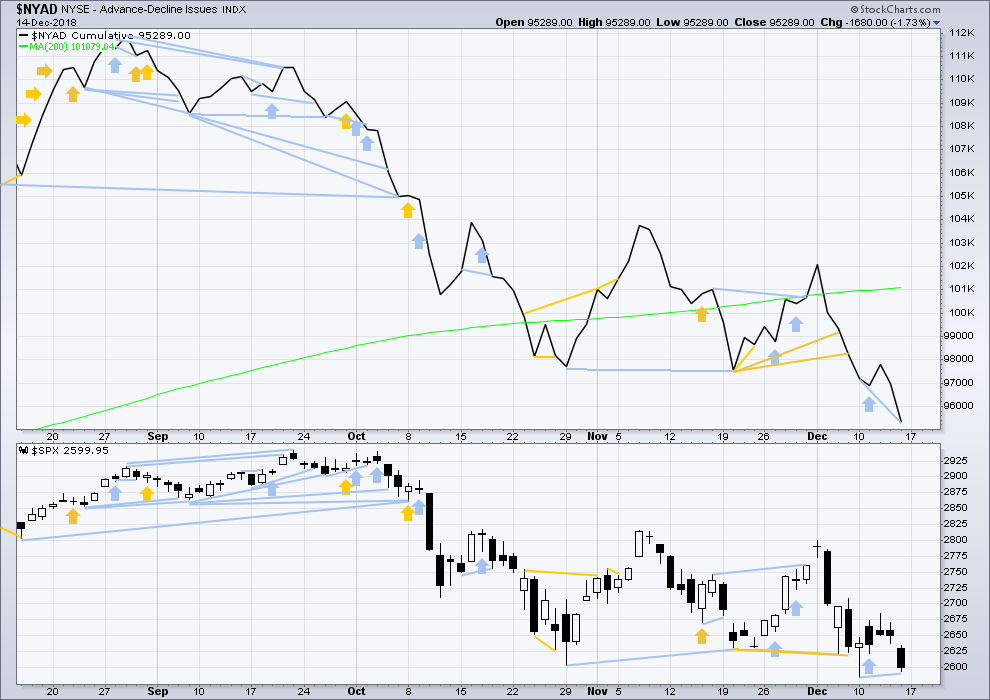
There is mid-term bullish divergence between price and the AD line. This week price has made new lows below the prior low of the week beginning the 30th of April, but the AD line has not. This indicates that downwards movement does not have support from a corresponding decline in market breadth; there is some weakness within price.
DAILY CHART
Click chart to enlarge. Chart courtesy of StockCharts.com. So that colour blind members are included, bearish signals
will be noted with blue and bullish signals with yellow.
There is normally 4-6 months divergence between price and market breadth prior to a full fledged bear market. This has been so for all major bear markets within the last 90 odd years. With no longer-term divergence yet at this point, any decline in price should be expected to be a pullback within an ongoing bull market and not necessarily the start of a bear market. New all time highs from the AD line on the 29th of August means that the beginning of any bear market may be at the end of December 2018, but it may of course be a lot longer than that.
Breadth should be read as a leading indicator.
On Friday the AD line has made a new low below the prior low of 10th of December, but price has not. This divergence is bearish for the short term and supports either alternate Elliott wave count.
Nearing the end of this bull market, to the end of primary wave 5, bearish signals from the AD line may begin to accumulate.
VOLATILITY – INVERTED VIX CHART
WEEKLY CHART
Click chart to enlarge. Chart courtesy of StockCharts.com. So that colour blind members are included, bearish signals
will be noted with blue and bullish signals with yellow.
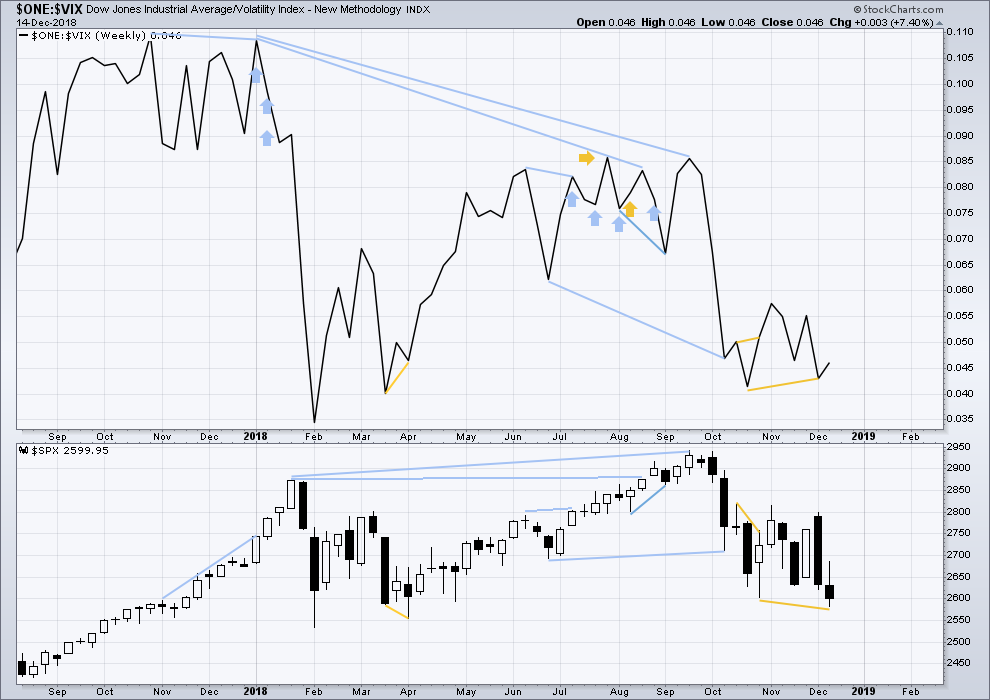
This week price has made a new low below the prior swing low, but inverted VIX has not. This divergence is bullish and indicates downwards movement this week does not come with a normal corresponding increase in VIX.
DAILY CHART
Click chart to enlarge. Chart courtesy of StockCharts.com. So that colour blind members are included, bearish signals
will be noted with blue and bullish signals with yellow.
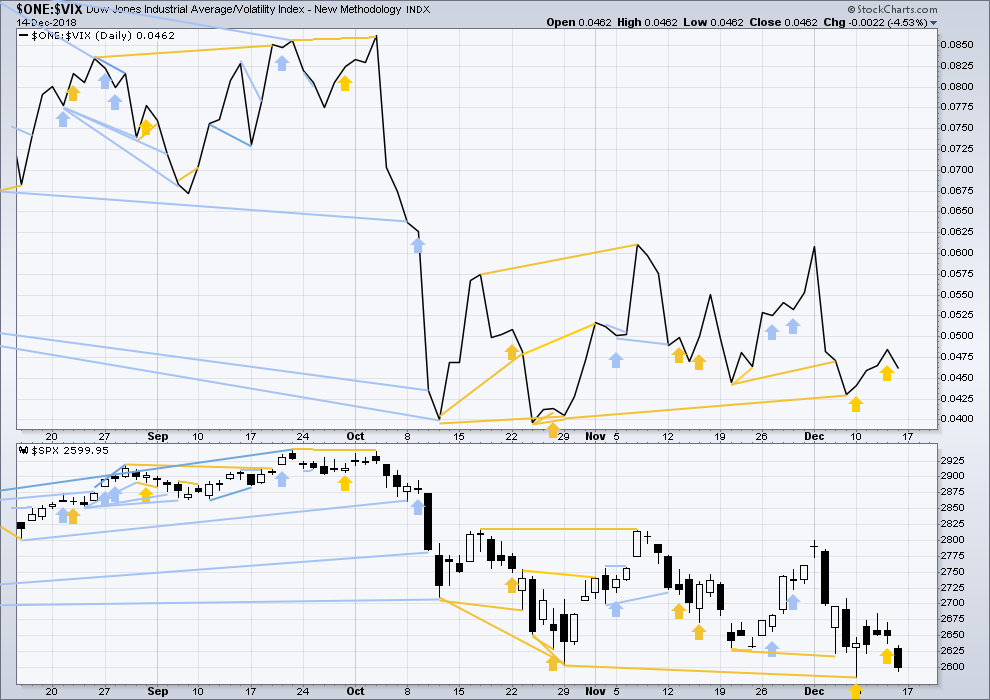
Normally, volatility should decline as price moves higher and increase as price moves lower. This means that normally inverted VIX should move in the same direction as price.
Like the AD line, inverted VIX may now begin to accumulate instances of bearish signals or divergence as a fifth wave at three large degrees comes to an end.
Downwards movement in price for Friday has a normal corresponding increase in VIX. VIX is not increasing any faster than price is falling. There is no divergence.
DOW THEORY
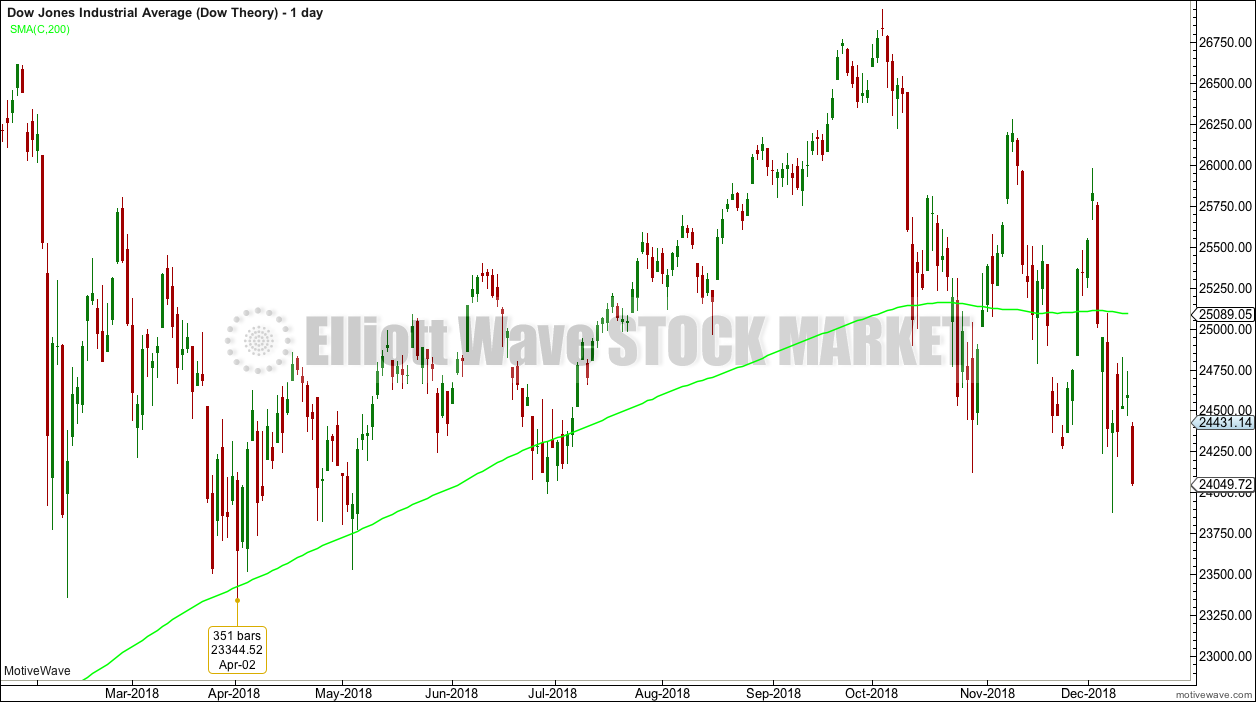
The following lows need to be exceeded for Dow Theory to confirm the end of the bull market and a change to a bear market:
DOW JONES INDUSTRIAL AVERAGE
Click chart to enlarge.
DJIA: 23,344.52.
DOW JONES TRANSPORTATION AVERAGE
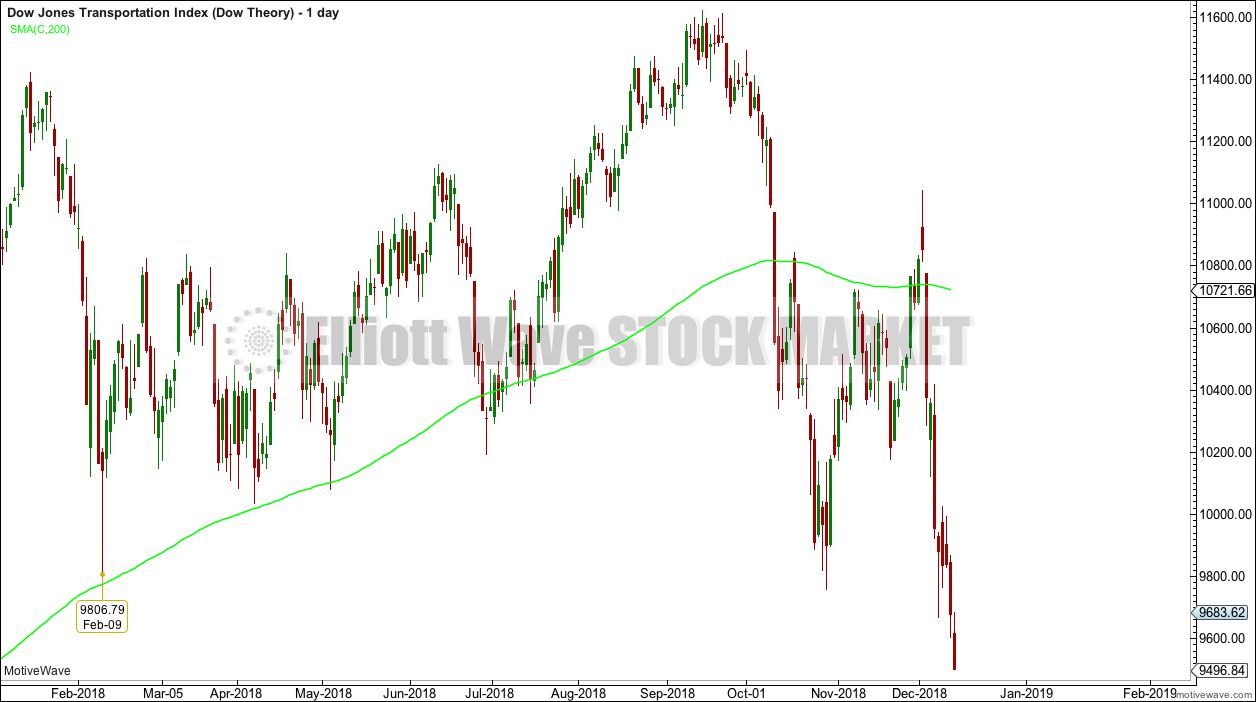
Click chart to enlarge.
DJT: 9,806.79 – price has closed below this point on the 13th of December.
S&P500
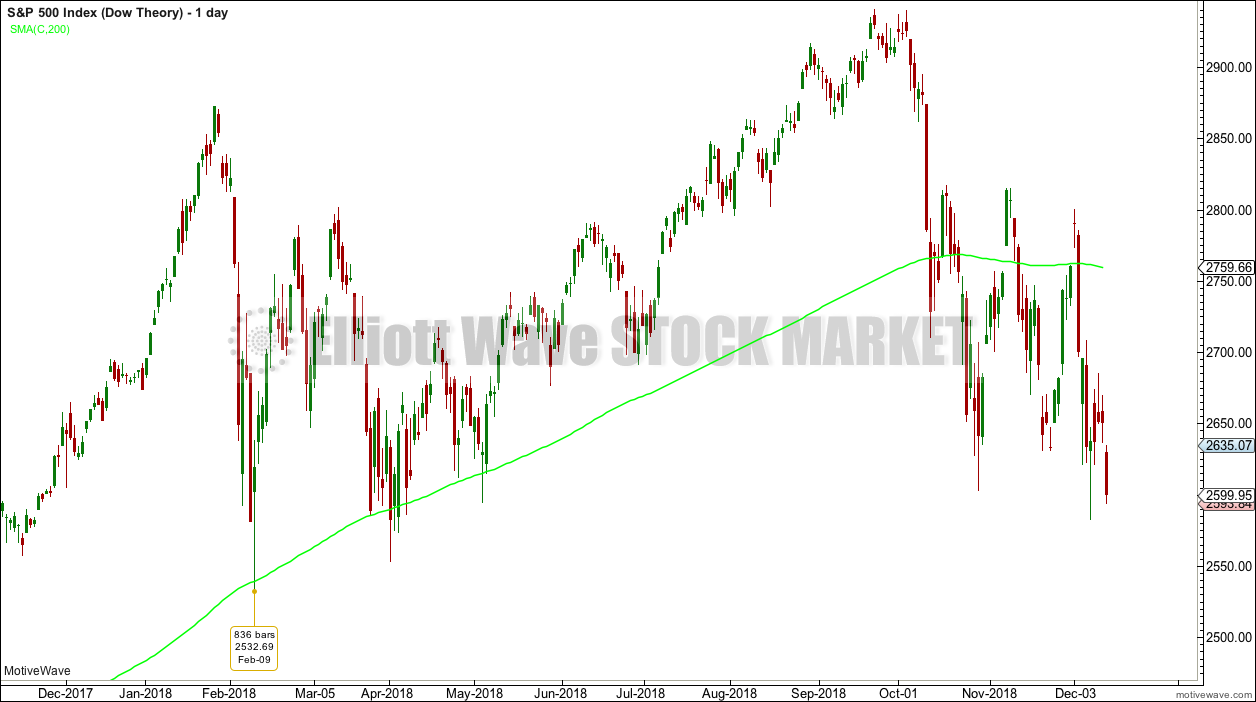
Click chart to enlarge.
S&P500: 2,532.69.
NASDAQ
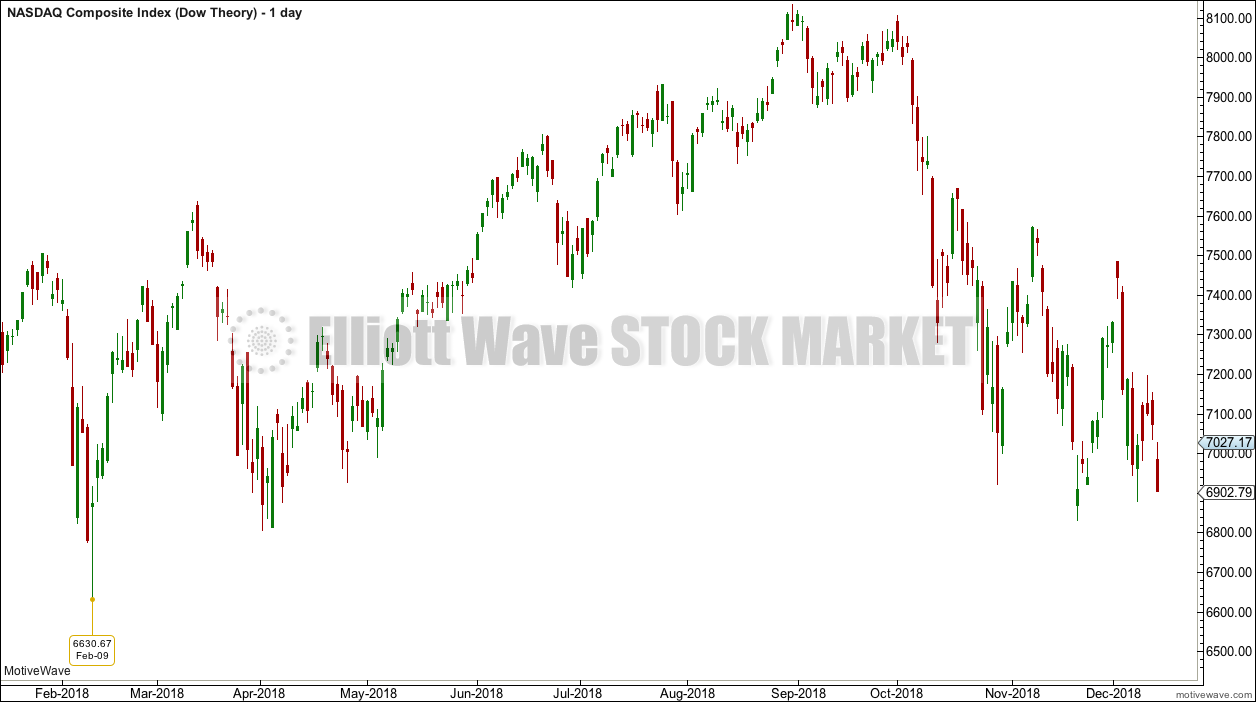
Click chart to enlarge.
Nasdaq: 6,630.67.
Published @ 08:50 p.m. EST.
—
Careful risk management protects your trading account(s).
Follow my two Golden Rules:
1. Always trade with stops.
2. Risk only 1-5% of equity on any one trade.
Joseph: I’ve deleted a comment from you today because it did not make any reference to markets and was politically controversial.
Just so you know I’m trying very hard here to not be biased, I’m also prepared to delete or edit comments which are from the other side. I’ve done this today.
Thank you very much for your understanding.
That was news which proves the basis of how this all started and the people behind it and no media is reporting it or they are burring the story…
It’s now being reported in Zero Hedge a markets publication…
https://www.zerohedge.com/news/2018-12-17/christopher-steele-admits-he-was-hired-help-hillary-challenge-2016-election
Hi everybody, I’ve just sent another email regarding the Christmas / New Year holiday to you all, but I’ll leave this here because there are always a few people who don’t get my emails.
I’ve decided I just can’t leave you all for two weeks with no analysis, particularly for the S&P considering recent price movement.
I’ll be checking in after the close of each session to provide an updated chart in comments. If the main wave count changes I’ll update you with a new post.
I’ll do your usual end of week video this weekend, and next video will update the situation on Sunday 6th January 2019 in preparation for that week.
And so I’ll have a reduced workload, some rest, and flexibility.
Next year I hope there will be no interruption to your analysis because I hope my new trainee analyst will be ready by then to look after my markets for a week or so.
Thank you all.
Thank you Lara. Very wise decision that I’m absolutely sure every member will appreciate your commitment. Merry Christmas and Happy New Year to you and your family.
I think it may be safe to say…. capitulation has begun (and maybe ended?)
Maybe…
Not yet…watch VIX for clues…
2537…buyers, buyers, anyone? Buyers????
the best time to buy is frequently when it seems like the market will sell off forever…
I did my part….
me too
Now the P4 looks…”much more complete”. Bigger and more powerful than the I4, as one would expect. You can trace out a common (highly similar) swing structure of it with the I4, the difference being this C/Y wave down is much deeper (as one might expect) vs. the C of the I4 (turned out to be a triangle). I think the odds are reasonable here it’s over, or close (with a final spike down and V bottom perhaps tomorrow). But by no means certain.
Already notched 2548. 10 points from alternate target.
2539.16, hide yo kids, hide yo wife
This is beginning to turn into some panic. haha
30 Year Treasury is saying that the Fed is ONE more (Dec) and DONE!!!!
That signal is as clear as day!!!! 2:11PM ET… 3.113% Yield
That’s what the betting markets have in place.
Raise, dovish tone, no raise in January… and March is currently 50/50.
That being said, this is what they have said their plan has been all along — regardless of what the President wants.
*edit note from Lara: jmdrew, I’ve changed the reference to the President to be more polite. Thank you.
DONE until Dec 2019 at the earliest and maybe into March 2020!
Remember in order to see the effects of a Fed Funds rate increase on the actual economy it takes 12 to 18 months so last here in Dec … then December 2019 at the earliest for possible next!
The second alternate will now be the main wave count. I’ve calculated a target and drawn a channel about this last downwards wave.
short term no second wave correction within minute v may move beyond the start of its first wave above 2,601.13.
and so a new high above 2,601.13 would indicate this last wave down should be complete and a bounce should have arrived
2538, remarkable, a key fibo level that just happens to almost perfectly align with the I4 low at 2537.
Funny how it all works sometimes. Let’s see what happens. Sometimes “bottoms are an event”, and the first try at such an event today has failed miserably, turning into just another head fake. Maybe a plunging second try might work. “The bottom, the bottom, has anyone seen the bottom?”.
By the way, the Russell 2000 has now lost 20% of its value since it’s all time high in September. Wham bam.
Look like it may be the next FIB Level and the 1st alt count.
Don’t think we have seen real fear and panic yet…. and the daily chart just starting to waterfall…. careful
VIX move below 21.58 confirms reversal…
Trade what you SEE, not what you READ…! 🙂
….ringing and jing jing jingleing
Not yet
Be careful about playing a bounce starting today… Why?
Because look who else is playing it…
Gartman: “We Get The Feeling That A Market Bounce Shall Develop Today”
This stuff is always posted about him, but they hardly announce his other side. He is always hedged.
The majority of those posted headlines posted on what he is doing… the market tends to go the opposite way.
Now I am not saying it’s 100% of the time.
I don’t day trade… I am looking for a longer swing trade entry point and trying to determine which of Lara’s counts are playing out. So this is information for non-day traders.
already took round 1 profits on said bounce. More nimble than gartman! am looking to reenter…later and lower than current day’s high.
Is that the sound of sleigh bells I am hearing??! 😉 😉 😉
Dang! If this holds…
Needs to break and hold over $263 spy for me.
We are left with one of the two alternate counts. The main count is invalidated and out. As of the start of today, Primary 4 is still not bottomed. Will Primary 4 complete today? If we can manage to close positive / green, then I think today will be the completion of Primary 4. If we close down / red, then it is a good chance we have more downside to go.
Starting to look awfully reversal-day-ish now. And we have a Verne buy signal. So maybe it’s the 2nd alternate here. Maybe.
The end of day options clearing will tell
These Monday wed Friday SPY expiration seem to make most of the action late.. when the premiums have decayed
🙂
Rat-a-tat-a-tat…
The vacuum cleaner is running at full speed here, cleaning out the stops and weak hands.
For some reason, 2537 looks very possible here. Oh yes, that would form a double bottom with the I4 low. How symmetrical that would be.
Just a prelude though to the nuclear bombs to come in 2020 and beyond. This is a small potatoes correction on the monthly chart. In fact, my monthly chart trend indicator is still showing neutral for the current month.
and 2532 was just a huge tail. Lowest close of 2018 is 2881.
Could break that today.
Invalidated Daily Chart #1
AAPL trying to save the day, once again.
We should see an interim bottom today.
If you know how to use spreads, the coming bounce represents one of the best set-ups I have seen in quite awhile. Merry Christmas everyone!!!! :-))
I found this interesting article and forecast of the yield inversion and stock market peak posted on September 22nd . The link is:
https://recessionalert.com/yield-curve-inversion-recession-forecast/
They made some updates just this week. The link for the update is:
https://recessionalert.com/yield-curve-inversion-forecast-update-nov-2018/
NOTE: Their forecast for the earliest stock market peak is now forecast as Oct 2019 at the earliest. This matches Lara’s long standing forecast for an Oct 2019 market peak.
Excellent article Rodney, thank you.
The yield curve is very misunderstood. It is not an independent variable dictating equity market direction. Rather it is simply a proxy for whether credit is about to be extended or contracted from the economy. Steepening portends expansion and inversion – contraction. Credit extension is key to support economic activity and to asset price appreciation. As such, despite the recent hysteria in the markets suggesting that you sell equities immediately upon inversion. you would be best to be long the market as equity market returns in the ensuing 12 months are typically very robust SUBSEQUENT to an inversion and can typically average 15-20%. The key to watch for are the coincident indicators of credit contraction such as widening spreads and tightening credit standards in the both the regulated and shadow banking markets. Once you see an inverted yield curve AND significantly widening credit spreads and tightening loan conditions it is time be worried. You have neither of those conditions now.
During the entire consolidation from Oct 29th to today, on-balance volume has essentially gone sideways. If the market is going to break to the downside, I would have expected to see OBV to have drifted down not sideways. Notice OBV peaked about eight days before the September high and the subsequent plunge to the 2600 area. I am thinking that if we are now going to see a downside breakout towards 2500 and lower, we should have seen OBV trending lower at least during these last eight days. in my opinion, this supports the bullish main count.
Numero Uno. Have a great weekend everyone.
Lara, the main hourly is what I was looking at all week. You are a good teacher. Did not expect it to go this low, however. Very interested to hear from and meet (so to speak) your new analyst. Will she be posting during your Christmas break?
You may be right about volume
But if it’s basically computers now
Trading between pennies until it finds a direction …. I would think volume is less important
If sell orders get placed .. and bids are lifted by the algos
You could get a plunge in no volume
We saw this in the futures overnight a couple times
Where circuit breakers had to come on to prevent large drops
We have to be aware of the risk of this type of market that can be dropped on a whim…
There are counts I have seen that show a large drop coming..
So as far as EW it’s possible…
And if there are no buyers and selling the rips becomes the trade…
Then all as traders we have to be able to adapt
There has to be a heck of a lot of overhead supply too
And maybe these drops gets the trapped people to drop their price and get out for a loss…
Then it can drift higher when sellers are exhausted ..
It’s just that computers really change the game … as far as predicting and charting
It’s about hunting and chasing stops and orders …
Yep! 🙂
Scott,
I was not speaking about volume in the comment above. I was speaking about On Balance Volume. There is a big difference between the two.
Gotcha…
I’m putting in risk reversals on spy for today
Selling 257-255 spreads for today’s expiration
Buying 259-261 for Wednesday
Also sold aapl 162.50-157.50 put spreads for 1.05$ For Friday
I’ll be happy to take them long there
Looking to buy the upside calls for this week on a pullback in the underlying
Selling VXX out of the money calls for the Friday be a good idea
She’s posted already.
She did the EURUSD and Bitcoin analysis over at Elliott Wave Gold. With very heavy supervision that is.
She’s just had an intensive two weeks living with us and training. She’ll have another at the end of January.
She is Sophie, and she’s my niece. She is very bright, learns quickly, and has a good head for business (she won a national NZ award for young business people). So I have a lot of confidence in her.
After the last two weeks I can say she’s picking up Elliott wave and TA quickly, and has a great attitude to learning this.
I’m so excited! I hope that by June / July she is ready to begin to provide weekly analysis of currencies, with supervision.