
Upwards movement was expected. A higher high and a higher low today fits the basic definition of an upwards day. The Elliott wave target remains the same.
Summary: A strong bullish Hammer candlestick reversal pattern at the low indicates a trend change. The target for primary wave 5 to end is now 3,070. This may be met next year. March is the first expectation.
If price keeps rising through this first target, then a new target would be calculated and the expectation for the bull market to end may then be in October 2019.
If price makes a new low below 2,583.23, then the target for the end of primary wave 4 would be about 2,478.
New updates to this analysis are in bold.
The biggest picture, Grand Super Cycle analysis, is here.
Last published monthly chart is here, video is here.
MAIN ELLIOTT WAVE COUNT
WEEKLY CHART

Click chart to enlarge.
Cycle wave V must complete as a five structure, which should look clear at the weekly chart level and also at the monthly chart level. It may only be an impulse or ending diagonal. It is clear it is an impulse.
Within primary wave 3, there is perfect alternation and excellent proportion between intermediate waves (2) and (4).
Draw the teal channel from the high of cycle wave I at 1,343.80 on the week beginning 3rd July 2011, to the high of cycle wave III at 2,079.46 on the week beginning 30th November 2014, and place a parallel copy on the low of cycle wave II at 1,074.77 on the week beginning 2nd October 2011. Draw this chart on a semi-log scale. A small overshoot, like that seen at the end of cycle wave IV, would be entirely acceptable. If price does move below the channel, then it should reverse reasonably quickly.
Primary wave 4 may be over at the last low as a complete zigzag. The teal trend channel is overshot, which is acceptable; this has happened before at the end of cycle wave IV.
This wave count has the right look at the monthly chart level.
If primary wave 5 ends at or after the end of December 2018 and the AD line fails to make new all time highs, there would then be the minimum required four months of bearish divergence between price and the AD line. If this happens, then the conditions for the end of this bull market would be in place.
Primary wave 4 may not move into primary wave 1 price territory below 2,111.05.
Two daily charts below are published in order of probability.
DAILY CHART

Click chart to enlarge.
Primary wave 4 may be a complete single zigzag.
Within the zigzag, intermediate wave (C) must subdivide as a five wave structure. It may be a complete ending contracting diagonal.
Within the ending diagonal, all sub-waves must subdivide as zigzags, minor wave 4 must overlap minor wave 1 price territory, and minor wave 4 may not move beyond the end of minor wave 2 above 2,800.18.
Minor wave 5 may have ended with an overshoot of the 1-3 trend line.
If primary wave 5 were to only reach equality in length with primary wave 1, it would be truncated. The next Fibonacci ratio in the sequence is used to calculate a target.
HOURLY CHART

Click chart to enlarge.
Within the new trend of primary wave 5, minor wave 2 may not move beyond the start of minor wave 1 below 2,583.23.
Within primary wave 5, there may now be two overlapping first and second waves to begin minor wave 1. This wave count would now expect some increase in upwards momentum, most likely in the next one or two sessions.
ALTERNATE DAILY CHART

Click chart to enlarge.
The other possible structure for intermediate wave (C) would be a simple impulse. If intermediate wave (C) is unfolding as an impulse, then it may now have three first and second waves complete. This wave count would expect to see an increase in downwards momentum as the middle of a third wave unfolds.
Within minute wave iii, minuette wave (ii) may not move beyond the start of minuette wave (i) above 2,709.21.
This wave count would expect to see a very large breach of the teal trend channel on the weekly chart. This has not happened during the life of this trend channel.
The S&P commonly forms slow curving rounded tops. When it does this, it can breach channels only to continue on to make new all time highs. It is possible that Super Cycle wave I may end in this way.
TECHNICAL ANALYSIS
WEEKLY CHART
Click chart to enlarge. Chart courtesy of et=”_blank”>StockCharts.com.
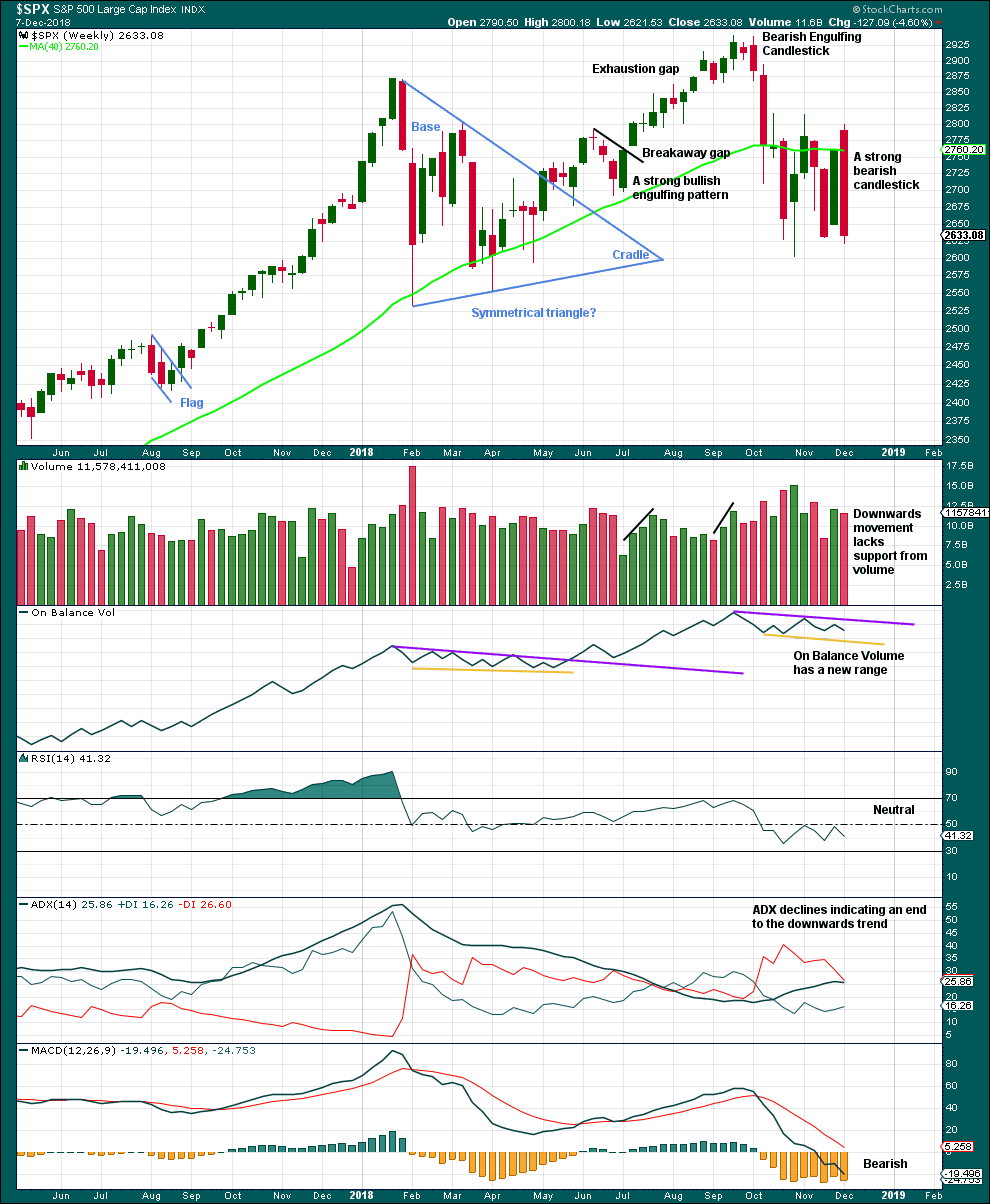
Last weekly candlestick is a strong bearish candlestick, but does not meet all the criteria for a Bearish Engulfing pattern. From Nison, “Japanese Candlestick Charting Techniques” page 43:
“There are three criteria for an engulfing pattern:
1. The market has to be in a clearly definable uptrend (for a bearish engulfing pattern)…
2. Two candles comprise the engulfing pattern. The second real body must engulf the prior real body (it need not engulf the shadows).
3. The second real body of the engulfing pattern should be the opposite colour of the first real body.”
This market is not currently in a clearly definable upwards trend, so the first criteria is not met.
A decline in volume last week may be due to the week being a short trading week, and so it would be best to look inside the week to determine the short-term volume profile.
However, the strongest volume for recent weeks is for the upwards week beginning 29th of October. This short-term volume profile at this time frame is bullish.
For a more bearish outlook a bearish signal from On Balance Volume would be preferred.
DAILY CHART

Click chart to enlarge. Chart courtesy of StockCharts.com.
The lower edge of the teal trend channel is not shown on this chart, but it should be considered as part of this technical analysis. Expect that trend line to continue to provide support, until it does not.
Currently, this market is consolidating with resistance about 2,815 and support about 2,605 to 2,620. It is the upwards day of the 30th of October that has strongest volume during this consolidation, suggesting an upwards breakout may be more likely than downwards. This technique does not always work, but it does work more often than it fails.
With the strong Hammer candlestick reversal pattern, it still looks like a low is in place.
Upwards movement today has a little support from volume.
There is very strong resistance ahead at 2,700 and then at the 200 day moving average. For this consolidation, only a close above the upper edge of resistance at 2,800 on an upwards day with support from volume would give confidence that a new upwards trend is in place. While price remains within the consolidation zone, both Elliott wave counts will remain valid and must be considered.
BREADTH – AD LINE
WEEKLY CHART
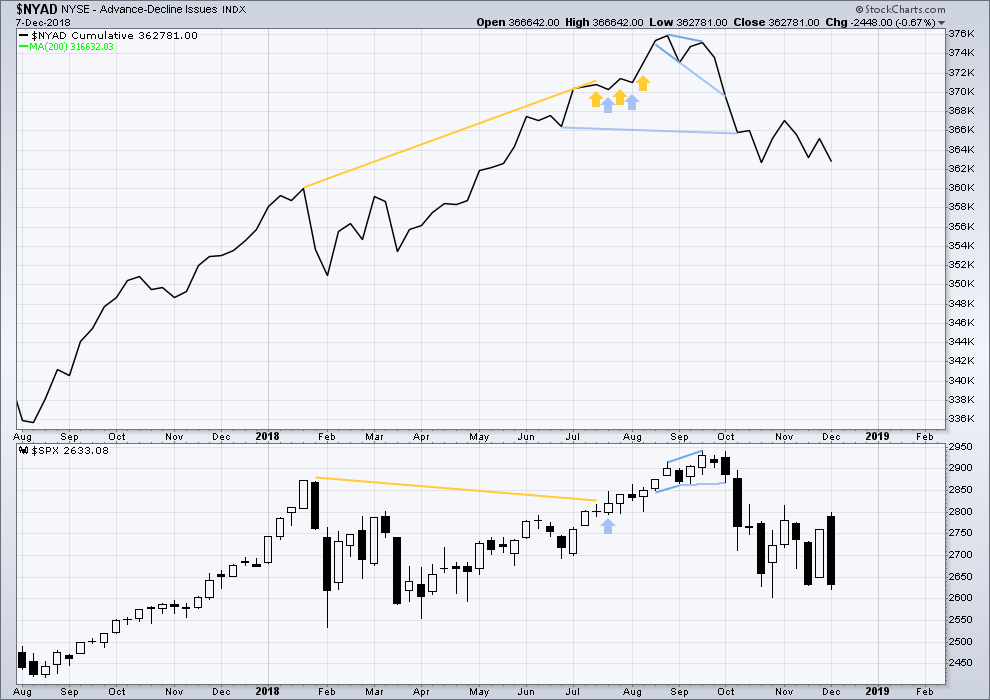
Click chart to enlarge. Chart courtesy of StockCharts.com. So that colour blind members are included, bearish signals
will be noted with blue and bullish signals with yellow.
Both price and the AD line have moved lower last week. There is no divergence, and the AD line is not falling any faster than price here.
DAILY CHART

Click chart to enlarge. Chart courtesy of StockCharts.com. So that colour blind members are included, bearish signals
will be noted with blue and bullish signals with yellow.
There is normally 4-6 months divergence between price and market breadth prior to a full fledged bear market. This has been so for all major bear markets within the last 90 odd years. With no longer-term divergence yet at this point, any decline in price should be expected to be a pullback within an ongoing bull market and not necessarily the start of a bear market. New all time highs from the AD line on the 29th of August means that the beginning of any bear market may be at the end of December 2018, but it may of course be a lot longer than that.
Breadth should be read as a leading indicator.
Short-term bearish divergence noted in last analysis has not been followed by any downwards movement. It may have failed.
Today price and the AD line both moved higher. Upwards movement today has support from rising market breadth. This is bullish.
Nearing the end of this bull market, to the end of primary wave 5, bearish signals from the AD line may begin to accumulate.
VOLATILITY – INVERTED VIX CHART
WEEKLY CHART
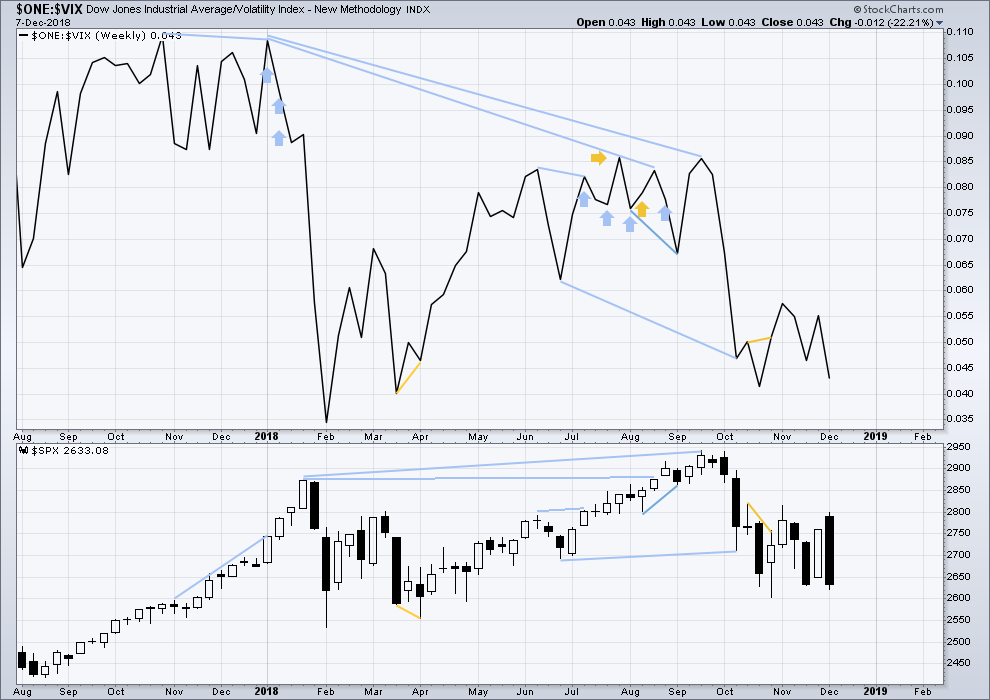
Click chart to enlarge. Chart courtesy of StockCharts.com. So that colour blind members are included, bearish signals
will be noted with blue and bullish signals with yellow.
Both price and inverted VIX have moved lower last week. The fall in price comes with a normal corresponding increase in volatility, but VIX is not increasing any faster than price. There is no divergence and no bearish signal.
DAILY CHART

Click chart to enlarge. Chart courtesy of StockCharts.com. So that colour blind members are included, bearish signals
will be noted with blue and bullish signals with yellow.
Normally, volatility should decline as price moves higher and increase as price moves lower. This means that normally inverted VIX should move in the same direction as price.
Like the AD line, inverted VIX may now begin to accumulate instances of bearish signals or divergence as a fifth wave at three large degrees comes to an end.
Today price and inverted VIX both moved higher. Upwards movement today has support from a normal corresponding decline in VIX. This is bullish.
DOW THEORY
The following lows need to be exceeded for Dow Theory to confirm the end of the bull market and a change to a bear market:
DJIA: 23,344.52.
DJT: 9,806.79 – although a new low below this point has been made, price has not closed below this point.
S&P500: 2,532.69.
Nasdaq: 6,630.67.
Published @ 09:01 p.m. EST.
—
Careful risk management protects your trading account(s).
Follow my two Golden Rules:
1. Always trade with stops.
2. Risk only 1-5% of equity on any one trade.
Apple Dead Cat bounce vs 62% $200+ on the table with our ride up
Yes
AAPL is the secret weapon
Basically is the market
A retrace to 195 takes the market up 5% or more with it
Question is.. when
When computers trade the market
They just keep punishing or pushing (look at Tesla .. algo driven short squeeze in a falling market )… and AAPL is at a breakdown point again
100x more bullish over 62% $2627.50 /ES Mar. 2019
SONG of the year … https://www.youtube.com/watch?v=5akEgsZSfhg SPX 3031.31
SPY down $2 AH.
https://media0.giphy.com/media/XvQXEi09zfmcE/giphy.gif?cid=3640f6095c130932324d4a46672effef
Things could very interesting very quickly
With dec vix futures expiring Tuesday
And they have been shorting the hell out of them since it was $17 a week ago
Any move of substance higher in those futures will cause a lot of pain
And start a lot of buying of them
But there always seems to be an unlimited seller of vix futures
But the time frame is so short
In May force rolling….
The short gold
The Short vix futures is a way they drive the buying in the s and p
When it goes the other way
Things unravel quickly
I think Karen mentioned that triple bottoms usually don’t hold
It will be interesting to see if that trend line can another time…
Lara’s count showing SP at 2550
Looks possible
I just can’t see a big bounce from here after all the seeking of the pops the past few days
Why would people want to buy them again now with all signs and trend averages so bearish?
If the hold VXX down hard all day
It might be worth looking at cheap calls $.50-$1.00 out of the money with an hour or so to go if things look wobbly
The flush could be hard and quick after things levitate
Long way to go… yesterday they were up around this time.
R.I.P. Greatest Bull Market (so far) 2009-2018. Until the next bull market…
https://youtu.be/9tjdswqGGVg
Above is not a trading advice, and it meant for entertainment only :).
Last of the Mohicans?
Lol sure why not.
Intriguing take… probably a tighter arc without AH on. (i always trade with AH on, especially with these 24hr stocks)
Mixed signal galore:
RUT and IYT down huge, XLF down big too. But VIX is down over 3% with SPX modestly in red…
Very confusing 🙁
“consolidation”, “backing and filling”, etc.
May go lower first…but it’s going up soon enough. Maybe in the last 30 minutes, maybe tomorrow, maybe next week. Weak hands getting shakin’ out, smart money is accumulating. IMO. I could be wrong.
As Verne would say … “you know what to do” 🙂
Where is Verne??? He’s been MIA the last couple of days 🙁
His last post, if I recall properly, stated he has taking a rest.
I almost never know what to do with his comments. 🙂
What happens starting at exactly 3:30pm eastern time may be quite telling.
If you remember, RUT was the first to go in October.
If this spy bear flag plays out…. measured move towards $250 (2500 spx or so)
Feb lows were $252?
A lot on one side … 49% which could playout badly for someone
Maverick’s (20 miles south of SF at Half Moon Bay) surf competition may be on early next week…projections are for a swell to hit that could generate 50′ faces, bigger than the massive 2010 competition swell! However, too much wind and it would be a no go. The call hasn’t gone out yet…stay tuned! Should be live streamed on the net when it happens.
A very quiet day. Price will break out of this consolidation, it looks more likely the breakout will be upwards but that is not certain. Which is why I have an alternate bearish wave count.
GAP FILL in 5, 4, 3, (2640.50 KEY)
Imagine if AAPL actually went red. lol
Only time SPX rises is when AAPL does, today.
Doesn’t seem to want to give it up just yet. Quick plunge below was all she got. Falling wedge intraday got me interested in long.
scalped it with spy weekly calls. .93 to 1.32
Love me some falling wedge.
APEX looks like 10:30 AM Friday … (pop and drop on the table)
How do you figure that? (thanks for answering alot of our questions, btw).
hold me closer tiny “c” wave, with a double bottom at 2646? cant get these bull goggles off
boring day…counting the headlights on the highway!
I never trade options until we get a TRUE breakout … love futures up and down all day long.
BAC is squatting on a 78.6% and now squeezing for 5 hours on the hourly tf.
I’m already a little long (bought calls strike 24 for May). I will get more long if/when this thing starts to trigger to the long side. Under 24.28 (the bottom of the wide Darvas box) and I’ll eat my little lunch on this one.
NO breakout yet … (true trend) we can always drop lower on the 3 DAY (i.e. BEAR FLAG)
So what is this “Euphoria” oscillator?
FUN CRASH … off 2940.91
AAPL says don’t worry, I will single handedly pull the market up. (with volume)
Oof, false breakout with tech?
Slow day in the averages so I’m looking for set ups. I rather like XOM (daily shown), serious support at 74.7, strong double bottom right there. Note the active squeeze (red dots bottom indicator); it’s a-gonna go sooner or later, one way or another. I may trigger in on something down at the hourly here, and should oil (/CL) finally rally off the 78.6% it’s squatting on, XOM should move up a good $3-5 anyway.
As Verne says, “know the trend”. Here’s weekly/daily/hourly/5 min trend state (color of most recent bar) for XOM. Not shown is monthly: that’s neutral.
I’m in (April ITM calls) and I like the up movement right after I jumped on it!
IF we are stuck in Wave (b) opens the door for POP AND DROP Wave (c)-2 (i.e. TRAP)
Yes, any thing is always possible. That said, I trade the set ups I see using the tools I prefer, in alignment with the highest probability wave count at the proper time frame. My outlook on the market generally medium term (3-6 months) is absolutely bullish. If the P4 isn’t over…then it will be soon enough. I trust Lara’s higher TF count implicitly (I have learned it virtually never fails; someday of course it will, but it’s all about probabilities). And for oil..it’s squatting on a high potential turn fibo at 78.6% (/CL). Meaning, a very close natural stop level. High reward/risk on this one is my view.
FUNNY THING ABOUT +DIVERGENCE … even with 60 days of it we can always add more on [$NYMO (-7.76% yesterday’s CLOSE) under -40% could TOAST the MARKET] // would love a $3031.31 PING on 10.3.2019
Karenl, I too watch the $NYMO. It is significant that we have seen a series of higher lows on $NYMO since the early October low. This has set up a 2 month positive divergence. This is strongly bullish. Can it all fall apart with an SPX dive? Of course. It is possible. But the much higher probability is that SPX will move much higher. Thanks for the chart and posts.
Keep an eye on the banks. (XLF) and some tech like NFLX, already almost -$6 from HOD. NVDA too. Hate to be early, but today does not look wonderful 25 mins into trading,.
-edit, there goes spy. had my bear goggles on since 2pm yesterday.
Lets. Long term weekly. Lots of support in the 23-24 zone, all the action in late ’16-early 17, a 78.6% and just under a 50%. Price here doesn’t seem stable to me or highly likely re: a turn back up. It pushed through just higher key fibos (removed from chart) and perhaps needs to settle lower before turning.
Rodney, we can always add more +divergence and burn a lot of traders with a bear flag into 2455.50 yet.
#ES_F Triple bottoms never hold … (2647.50) https://www.youtube.com/watch?v=Pw-0pbY9JeU dip under would be sweet
Fun drop … 2647.50 https://www.youtube.com/watch?v=pXRviuL6vMY
Almost 30 points from high of night. Then White House Advisors get on TV at 7am EST and pump it. Administration de pump.
Do or die. Put up or shut up. Poop or get off the pot. etc. etc.
This is where we are at for both counts. One must win out. Both are looking for increased momentum with some 3rd wave. We cannot go on much longer adding another 1-2 to the current counts.
Which will win? I give the edge to the bullish main count. How about you?
Good night all. And congratulations Kevin on your 1st place prize. It is about time. (he-he)
My 2 cents is that SPX can’t rip higher without the financials… so unless XLF rips higher, neither can SPX. I want to believe in the bullish count, but XLF and the Verne indicator holds me back!
My target for minor wave 2 to finish is close to today’s gap open. Ideal scenario would be to have minor 1 end near 2700, with minor 2 coming down to 2635…
We’ll see 🙂
Agreed Ari, financials are critical to SPX. In turn, to get financials going, we need interest rates to stop this counter trend move and start rising again. Signs that may be initiating…watch /ZB and TLT!
If TLT gets below 117.5…we could have liftoff on the financials etc. That is a key level afaiac. Initiates a resumption of the secular uptrend in longer term interest rates.
I believe there is a strong bullish divergence in daily slow stochastics that isn’t identified on the daily TA chart that is in fact there; much deeper price low and a substantially higher bullish crossover.
Let her rip
Until they stop pumping it overnight, its going to sell off every day.
That looks like it could play out
There is also a set up where this thing could fall off a cliff in the next week or so
So investing in some daily s(mon wed fri options )and put positions or some others when the premiums decay may be worth a look
I’ll be looking for vxx calls at end of week for this week and other forms of small window protection that could pay large on a sudden drop
At least until we are over 2815
Especially large $ stocks like amazon and Tesla ect
So if the drop happens it would pay quite large on the leverage and size of point drop
$1000 could turn into $10-$20k in a flash on those
Same for calls as well
So look for the pushes on those days
After the weekly options have decayed
Perfect example the past weeks
On daily expiration the big moves are turning .05-.20 options to $2-3$ or more on last minutes moves
Everyone and their mother sees 2800 or so. So, I am going to assume it will drop before 2800.
If it’s going to make that big a move up
AAPL will have to be involved
Calls just a couple % from price level go dirt cheap in the weeklies
So that is a place to play
That’s another thing that could drive it up
The beaten down heavy weights
AAPL AMZN FB
They could cue them up like an orchestra conductor and the market will fly
Everyone has watched that show over the last few years
As a 3-5% or more move in a week will pay large
That’s a good point Kevin. I missed that!
(bullish divergence between price and Stochastics, the last two swing lows).
#1