Yesterday’s analysis expected a low was in place. Today a higher high and a higher low fits the definition of upwards movement, although the candlestick closed red. The Elliott wave count remains the same and the target remains the same.
Summary: A strong bullish Hammer candlestick reversal pattern at the low indicates a trend change. The target for primary wave 5 to end is now 3,070. This may be met next year. March is the first expectation.
If price keeps rising through this first target, then a new target would be calculated and the expectation for the bull market to end may then be in October 2019.
New updates to this analysis are in bold.
The biggest picture, Grand Super Cycle analysis, is here.
Last published monthly chart is here, video is here.
MAIN ELLIOTT WAVE COUNT
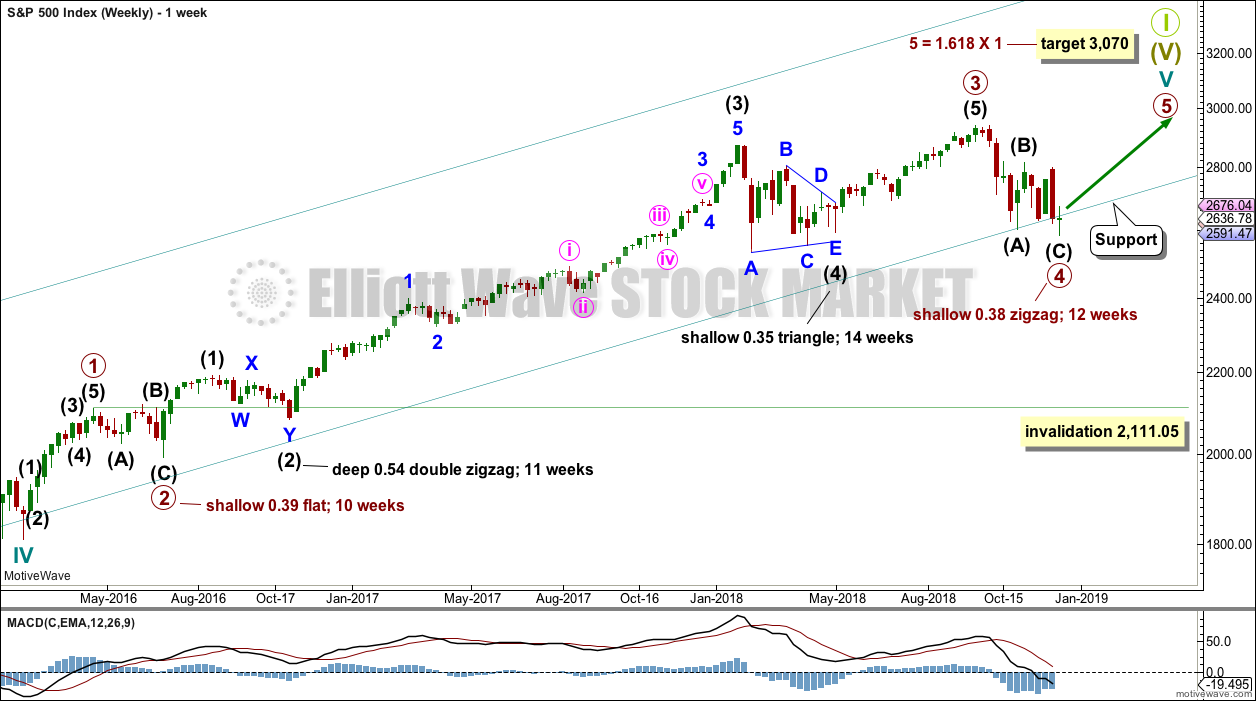
WEEKLY CHART
Cycle wave V must complete as a five structure, which should look clear at the weekly chart level and also at the monthly chart level. It may only be an impulse or ending diagonal. It is clear it is an impulse.
Within primary wave 3, there is perfect alternation and excellent proportion between intermediate waves (2) and (4).
Draw the teal channel from the high of cycle wave I at 1,343.80 on the week beginning 3rd July 2011, to the high of cycle wave III at 2,079.46 on the week beginning 30th November 2014, and place a parallel copy on the low of cycle wave II at 1,074.77 on the week beginning 2nd October 2011. Draw this chart on a semi-log scale. A small overshoot, like that seen at the end of cycle wave IV, would be entirely acceptable. If price does move below the channel, then it should reverse reasonably quickly.
Primary wave 4 may be over at the last low as a complete zigzag. The teal trend channel is overshot, which is acceptable; this has happened before at the end of cycle wave IV.
This wave count has the right look at the monthly chart level.
If primary wave 5 ends at or after the end of December 2018 and the AD line fails to make new all time highs, there would then be the minimum required four months of bearish divergence between price and the AD line. If this happens, then the conditions for the end of this bull market would be in place.
Primary wave 4 may not move into primary wave 1 price territory below 2,111.05.
Two daily charts below are published in order of probability.
DAILY CHART
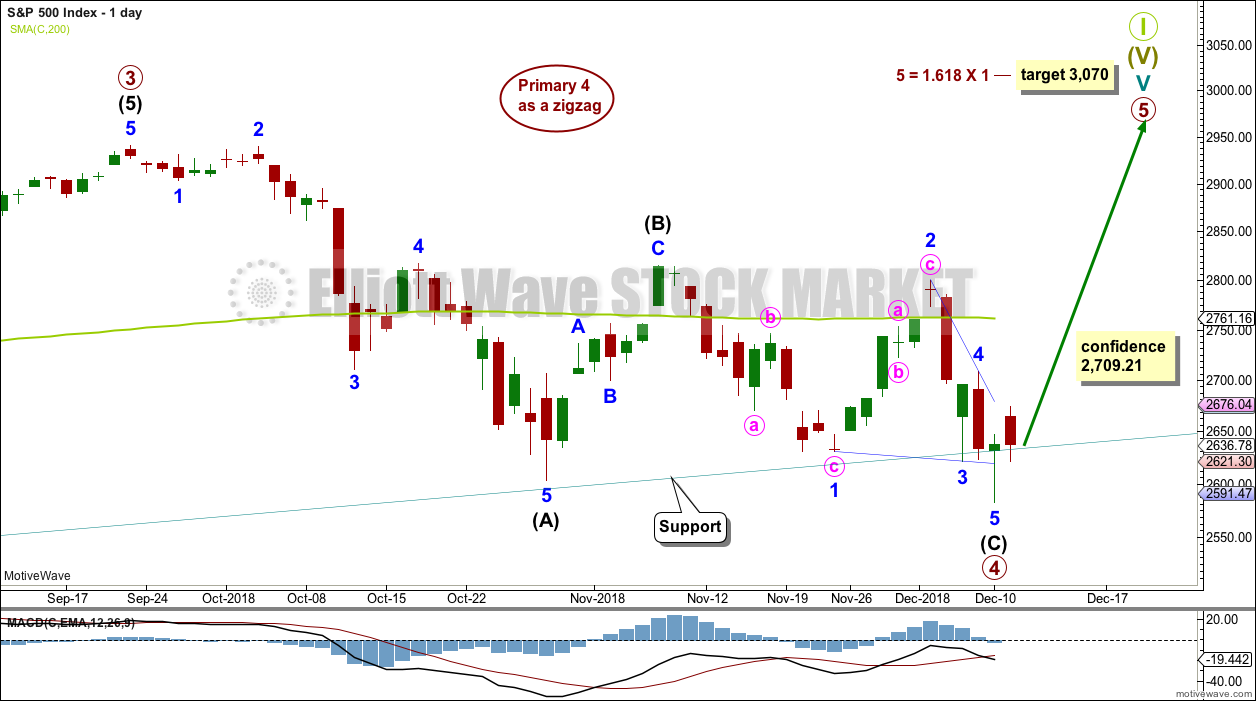
Primary wave 4 may be a complete single zigzag.
Within the zigzag, intermediate wave (C) may be a complete ending contracting diagonal.
Within the ending diagonal, all sub-waves must subdivide as zigzags, minor wave 4 must overlap minor wave 1 price territory, and minor wave 4 may not move beyond the end of minor wave 2 above 2,800.18.
Minor wave 5 may have ended with an overshoot of the 1-3 trend line.
If primary wave 5 were to only reach equality in length with primary wave 1, it would be truncated. The next Fibonacci ratio in the sequence is used to calculate a target.
HOURLY CHART
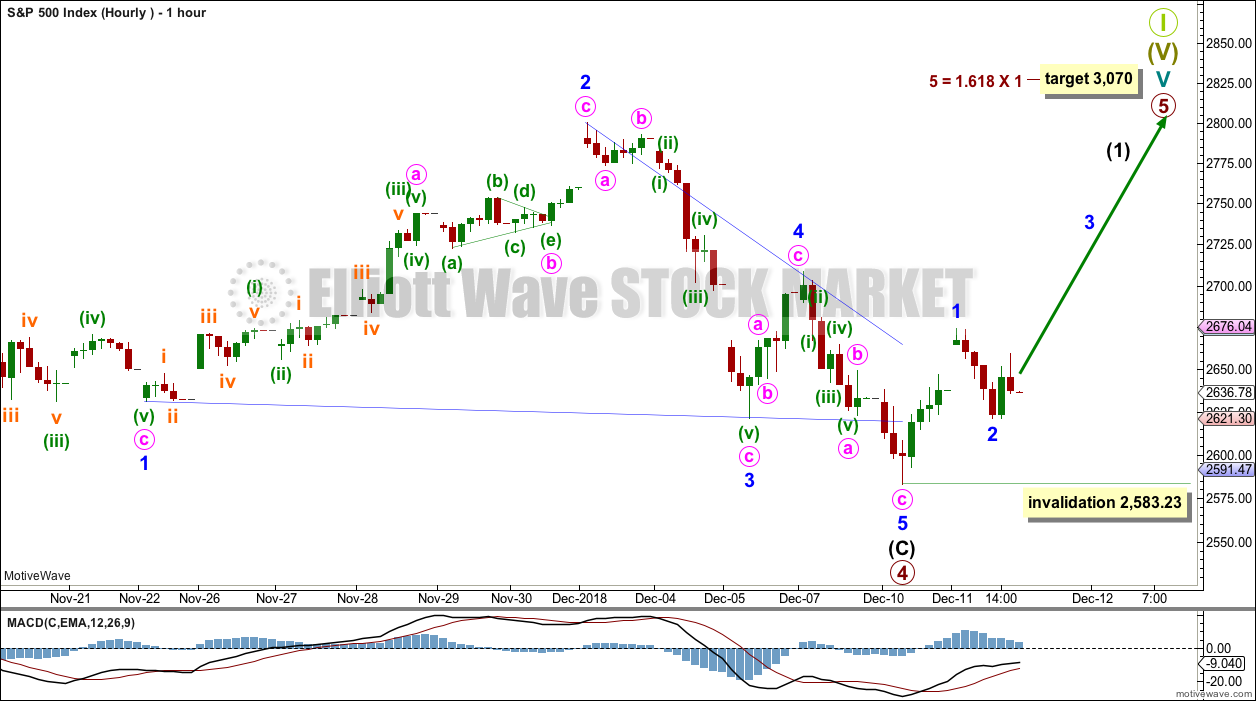
Within the zigzag for primary wave 4, intermediate wave (C) must subdivide as a five wave structure. This main wave count expects it may now be a complete ending contracting diagonal.
Within an ending diagonal, all sub-waves must subdivide as zigzags. Minor wave 4 must overlap minor wave 1, and it may not move beyond the end of minor wave 2. Minor wave 5 has overshot the 1-3 trend line, which is normal for a contracting diagonal.
Within the new trend of primary wave 5, minor wave 2 may not move beyond the start of minor wave 1 below 2,583.23.
ALTERNATE DAILY CHART
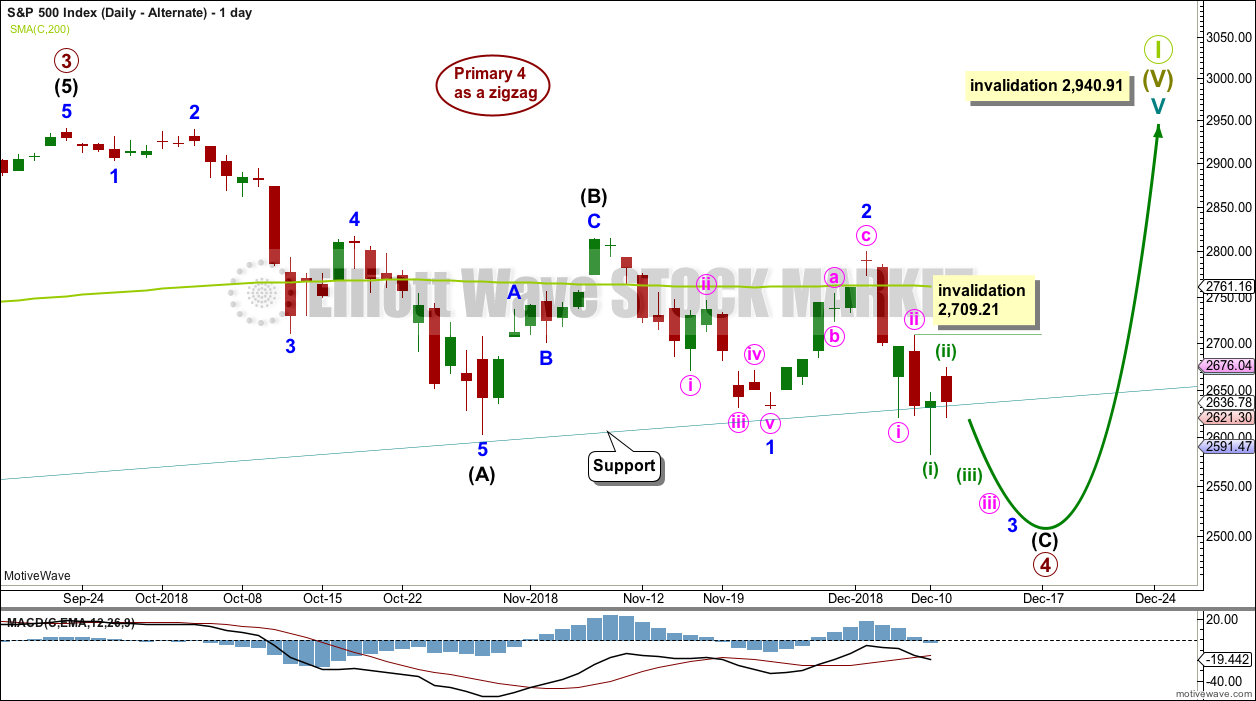
The other possible structure for intermediate wave (C) would be a simple impulse. If intermediate wave (C) is unfolding as an impulse, then it may now have three first and second waves complete. This wave count would expect to see an increase in downwards momentum as the middle of a third wave unfolds.
Within minute wave iii, minuette wave (ii) may not move beyond the start of minuette wave (i) above 2,709.21.
This wave count would expect to see breach of the teal trend channel on the weekly chart. This has not happened during the life of this trend channel.
The S&P commonly forms slow curving rounded tops. When it does this, it can breach channels only to continue on to make new all time highs. It is possible that Super Cycle wave I may end in this way.
TECHNICAL ANALYSIS
WEEKLY CHART
Click chart to enlarge. Chart courtesy of et=”_blank”>StockCharts.com.
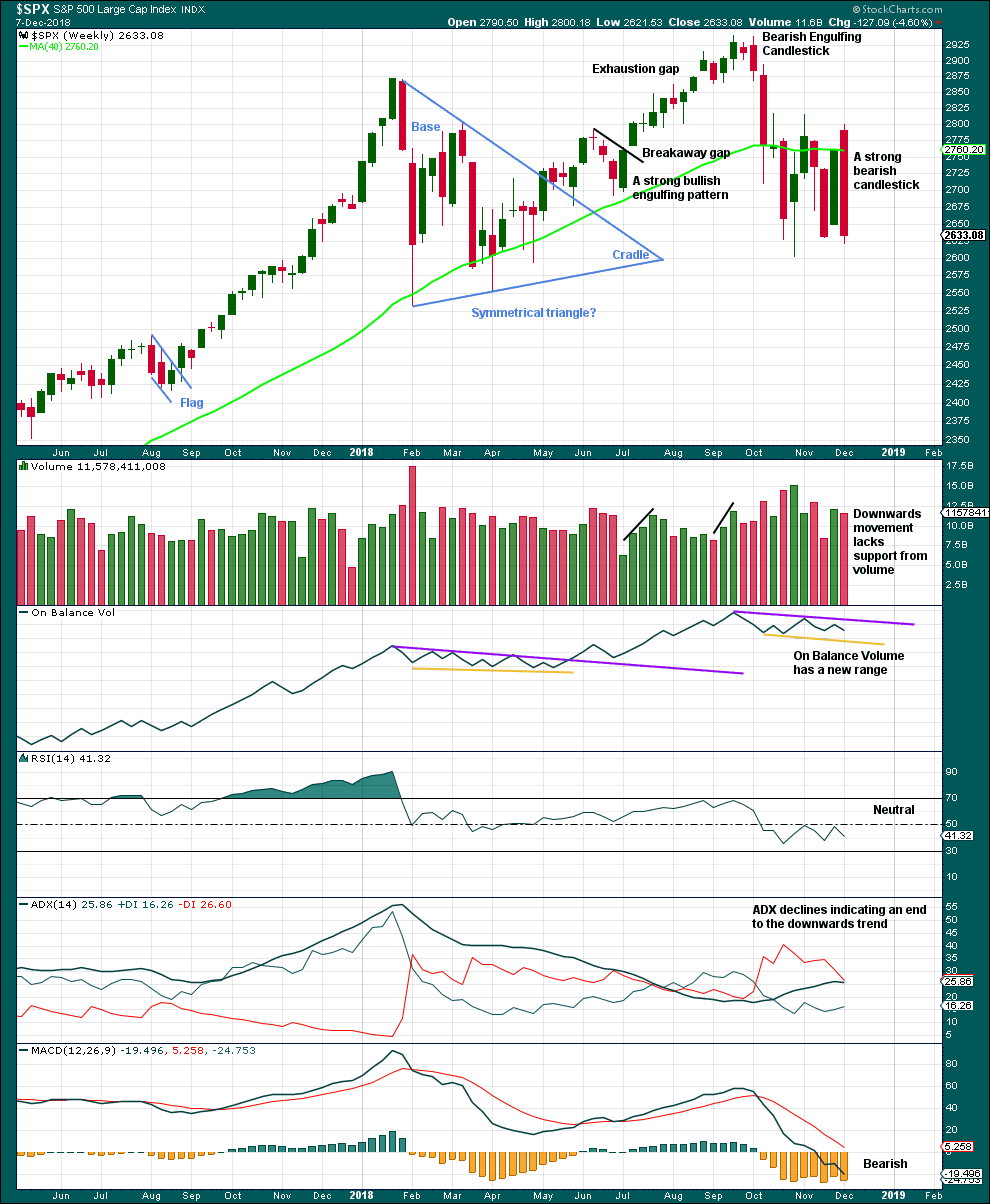
Last weekly candlestick is a strong bearish candlestick, but does not meet all the criteria for a Bearish Engulfing pattern. From Nison, “Japanese Candlestick Charting Techniques” page 43:
“There are three criteria for an engulfing pattern:
1. The market has to be in a clearly definable uptrend (for a bearish engulfing pattern)…
2. Two candles comprise the engulfing pattern. The second real body must engulf the prior real body (it need not engulf the shadows).
3. The second real body of the engulfing pattern should be the opposite colour of the first real body.”
This market is not currently in a clearly definable upwards trend, so the first criteria is not met.
A decline in volume last week may be due to the week being a short trading week, and so it would be best to look inside the week to determine the short-term volume profile.
However, the strongest volume for recent weeks is for the upwards week beginning 29th of October. This short-term volume profile at this time frame is bullish.
For a more bearish outlook a bearish signal from On Balance Volume would be preferred.
DAILY CHART
Click chart to enlarge. Chart courtesy of StockCharts.com.
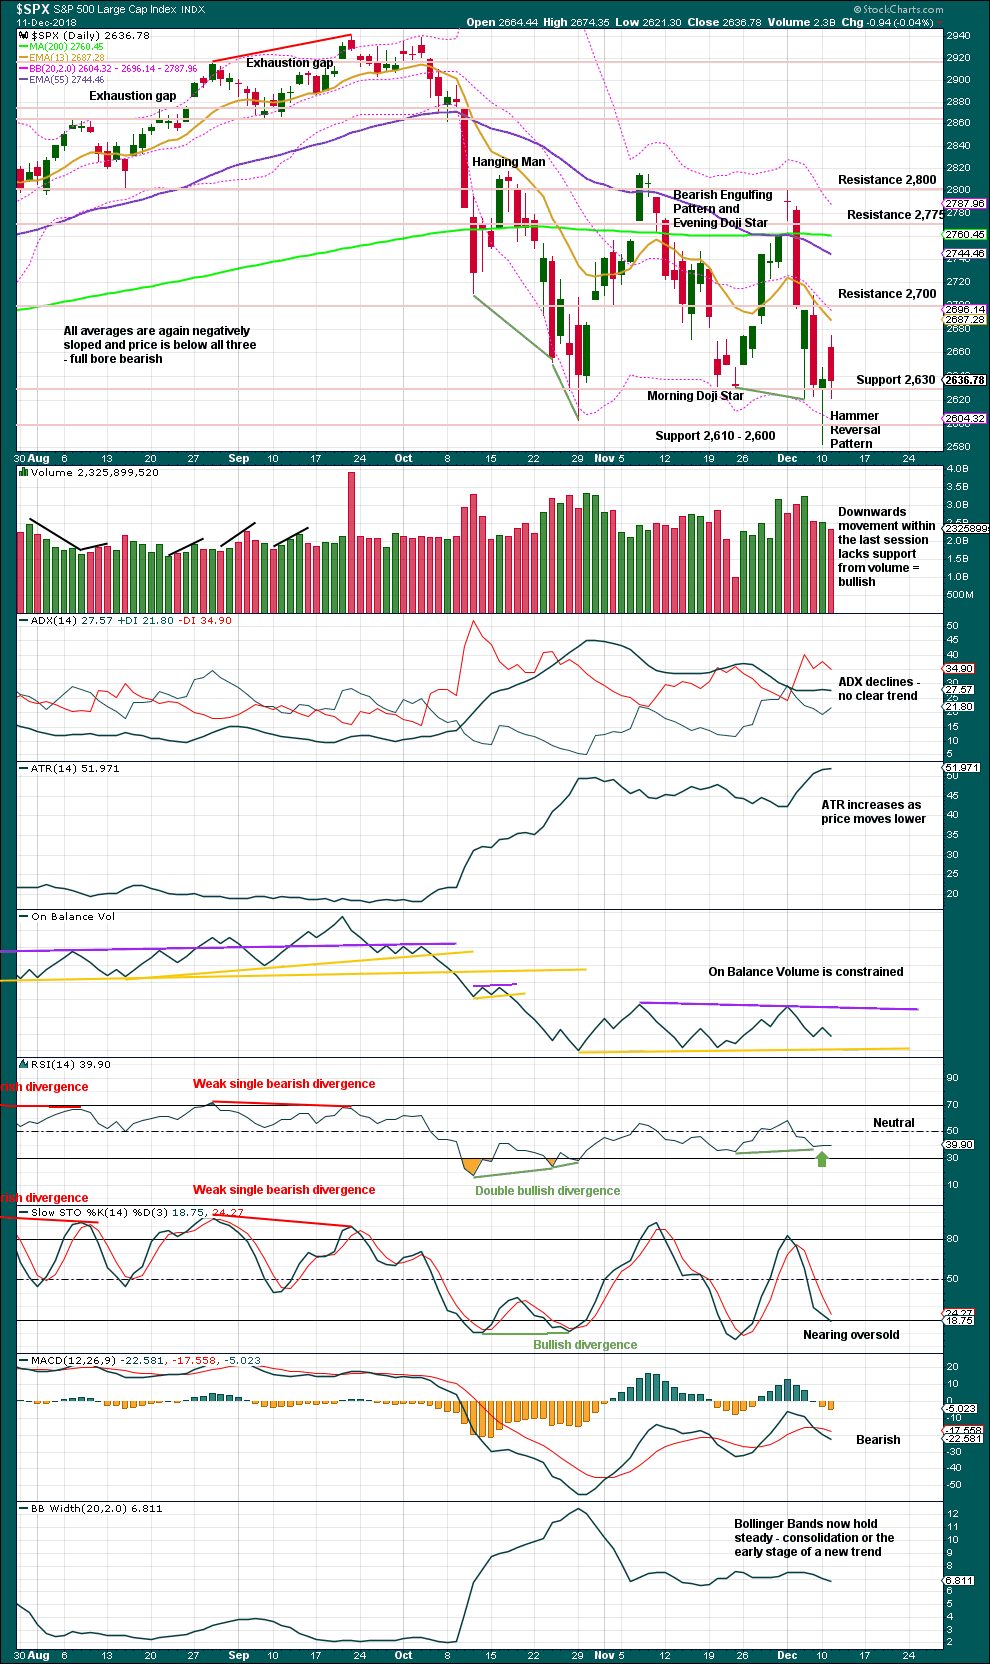
The lower edge of the teal trend channel is not shown on this chart, but it should be considered as part of this technical analysis. Expect that trend line to continue to provide support, until it does not.
Currently, this market is consolidating with resistance about 2,815 and support about 2,605 to 2,620. It is the upwards day of the 30th of October that has strongest volume during this consolidation, suggesting an upwards breakout may be more likely than downwards. This technique does not always work, but it does work more often than it fails.
With the strong Hammer candlestick reversal pattern, it still looks like a low is in place.
Today price moved higher, but the candlestick closed red and the balance of volume was down. Downwards movement within this session does not have support from volume. Volume today is lighter than yesterday, where the balance of volume was upwards. The short-term volume profile is interpreted as bullish.
BREADTH – AD LINE
WEEKLY CHART
Click chart to enlarge. Chart courtesy of StockCharts.com. So that colour blind members are included, bearish signals
will be noted with blue and bullish signals with yellow.
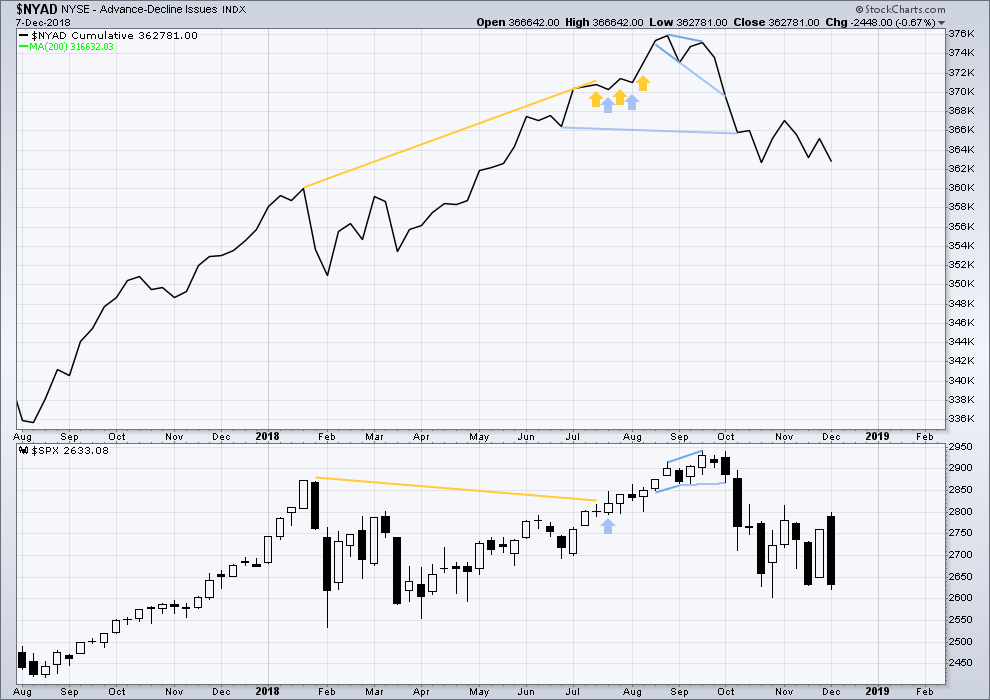
Both price and the AD line have moved lower last week. There is no divergence, and the AD line is not falling any faster than price here.
DAILY CHART
Click chart to enlarge. Chart courtesy of StockCharts.com. So that colour blind members are included, bearish signals
will be noted with blue and bullish signals with yellow.
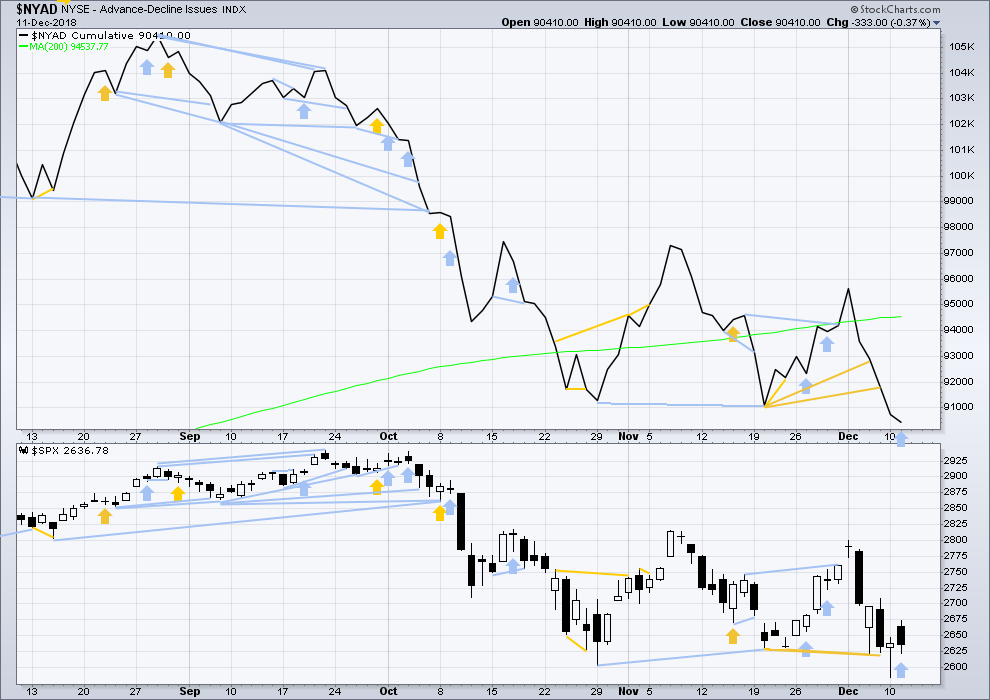
There is normally 4-6 months divergence between price and market breadth prior to a full fledged bear market. This has been so for all major bear markets within the last 90 odd years. With no longer-term divergence yet at this point, any decline in price should be expected to be a pullback within an ongoing bull market and not necessarily the start of a bear market. New all time highs from the AD line on the 29th of August means that the beginning of any bear market may be at the end of December 2018, but it may of course be a lot longer than that.
Breadth should be read as a leading indicator.
Today price has moved higher, but the AD line has moved lower. Downwards movement within this session has support from declining breadth. This divergence is bearish for the short term.
VOLATILITY – INVERTED VIX CHART
WEEKLY CHART
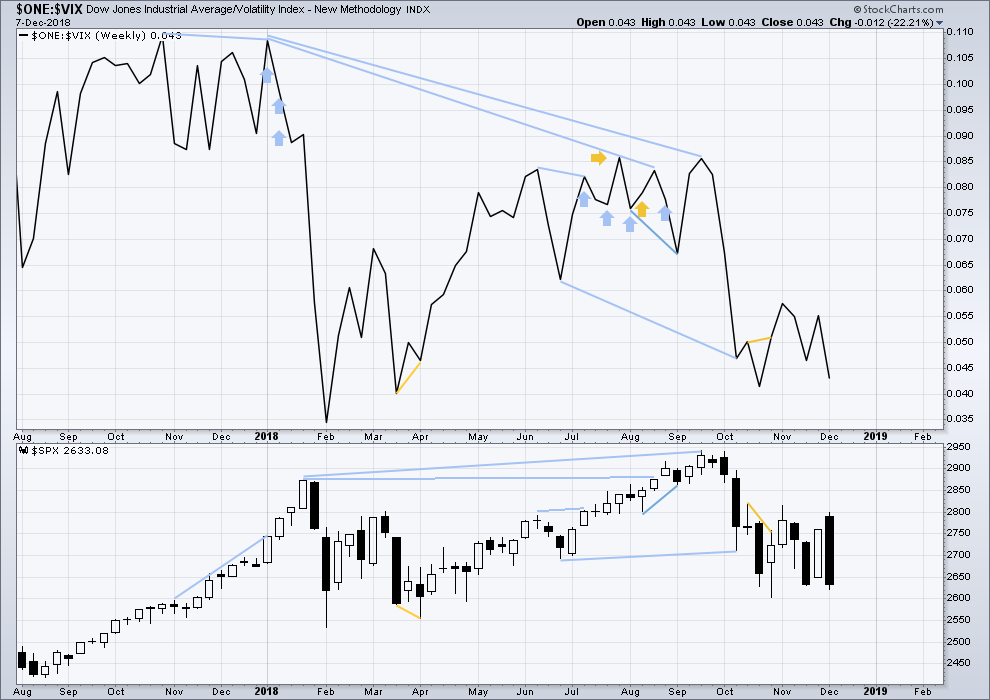
Click chart to enlarge. Chart courtesy of StockCharts.com. So that colour blind members are included, bearish signals
will be noted with blue and bullish signals with yellow.
Both price and inverted VIX have moved lower last week. The fall in price comes with a normal corresponding increase in volatility, but VIX is not increasing any faster than price. There is no divergence and no bearish signal.
DAILY CHART
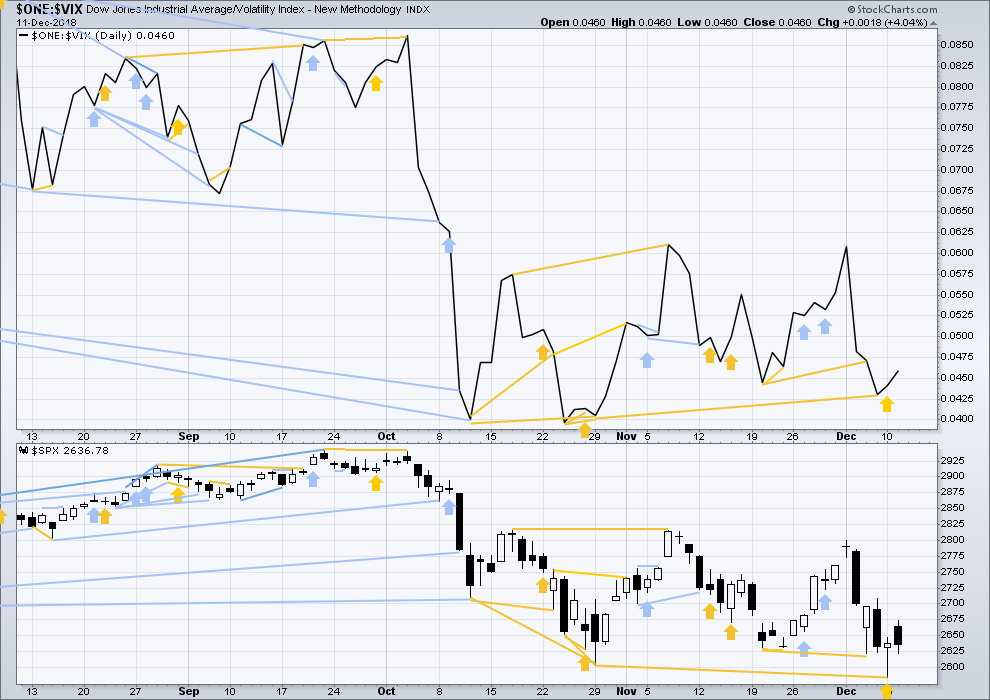
Click chart to enlarge. Chart courtesy of StockCharts.com. So that colour blind members are included, bearish signals
will be noted with blue and bullish signals with yellow.
Normally, volatility should decline as price moves higher and increase as price moves lower. This means that normally inverted VIX should move in the same direction as price.
Like the AD line, inverted VIX may now begin to accumulate instances of bearish signals or divergence as a fifth wave at three large degrees comes to an end.
Bullish divergence noted in yesterday’s analysis has now been followed by one upwards day from price. This divergence may now be resolved, or it may need another upwards day to resolve it.
DOW THEORY
The following lows need to be exceeded for Dow Theory to confirm the end of the bull market and a change to a bear market:
DJIA: 23,344.52.
DJT: 9,806.79 – although a new low below this point has been made, price has not closed below this point.
S&P500: 2,532.69.
Nasdaq: 6,630.67.
Published @ 08:41 p.m. EST.
—
Careful risk management protects your trading account(s).
Follow my two Golden Rules:
1. Always trade with stops.
2. Risk only 1-5% of equity on any one trade.

Gap down open would be sweet low for for a turn back up
Have you seen the pajama players? Buy long long long long long all night.
jmdrew, Go chase a moonbeam https://www.youtube.com/watch?v=sjg08prDzjM
Got a laugh out of me!
This market is a dead man walking. Unless the bulls do something soon, these fades will set us up for another plunge below 2600. We can only bounce so many times before there are no buyers left.
Agree
Or it could be 1-2, 1-2 to the up side.
Curtis….you have it…..1/2…1/2/3/4/5=3 to the upside
AFAIAC, this minuette iv (I think) is a nice opportunity at the bottom to (re)load longs for the move up to the top of the minor 1. Possible turn/buy triggers coming off the 38%. Or it goes deeper. 2645 is the 61.8%.
too deep now, hopefully submin 2
Rug pull time.
I don’t think so. Just a small iv. Lara’s count says so, and there’s corroborating evidence on top of that: the turn here is in no man’s land. Not a fractal price point. Lends weight to it being a small little correction, not a significant pivot. My $0.02 worth less.
Q’s are similar. “Close” to 61.8…but not really at the 5 minute level. There’s more up overall here IMO before we get any significant pullback (looks like it’ll be a minor 2 per Lara’s update).
Took my little Q’s short profit pretty close to the low (maybe first low, could go deeper still). Cream on top of the puff.
I just meant intraday. I would post my twitter feed of how it played out, but not sure if allowed to post that here.
If May does get a surprise oust (or resign), I think you will see this DUMP.
-edit LOD.
What, FUNNYMENTALS? Never………
Funnymentals or not. Markets don’t like change.
Brexit March 29, 2019 too. Funny date all things EW considered.
Q’s got pretty close to a key 61.8% and I took a tactical short on the initiation of the turn here. Plenty of profits in hand for the day, time to splash around in the wading pool for a little bit.
SPX looks like it’s doing a iv of the minute 3.
HIGHER risk building $2710 key for me …
Hi Karen L – can I ask what is the Blue indicator that you have the arrow pointing too ?
Fred >>> “euphoria” +5% with divergence we buy – and start selling at 100% with divergence we sell more.
I’ve searched for “euphoria indicator”, can’t find a thing.
Looks like a type of overbought/oversold oscillator to me.
Kevin, not going to find a thing, because I made it. Until over $2800.18 I love Lara’s bear count falling under $2583.23 again.
Same – nothing “euphoria” standard issue in ToS Study or Strategy, does look oscillator-ish.
Updated hourly chart:
I’m here a little earlier in my summer / your winter because daylight savings. Just in case anyone was wondering.
Anyway, I’m moving the degree of labelling within the start of P5 down one degree to see minor wave 1 incomplete. This looks better on the daily chart.
So far within this upwards movement there may be a 1-2- with 3 incomplete. I’m labelling it minute degree.
Thanks Lara. Have a happy summer Christmas day. We finally have a sunny day but only 9 hours of daylight this time of year. Another Yuk!
Will do Rodney. Hopefully we get a Christmas day surf in!
We have a lot of daily moving averages just overhead; 13, 34, 50, 200. To break above all of them will take some work unless we set off a series of stop loss orders for the bears’ short positions. That could trigger it. Otherwise, slow churn for several days. We want to see the bulls take out the moving averages and reverse the ‘Death Cross” of last week.
The daily MACD for SPX is forming the second higher low in a series coming off the October 29th low. This is positive action and supports the main count. The daily MACD has not yet made a bullish crossover. But the 4 hour is just about to do so and the daily most often follows the 4 hour.
What do you think of the volume approaching these points
It seems light today
And although they are trying to sell vix futures hard to move the indices up
Spot vix is stubbornly high
Only a big announcement I think could cause a spot vix drop needed
This looks more like machines killing puts
Than any real buying action
By the way I thinks. Risk reversal on aapl here
Sell near money puts
Buy near money call spreads
Looks pretty good in the week to two week frame If you feel the markets are going to move higher
Lara has noted many times that this bull market has been rising on low volume. So the question of volume now is sort of a very minor point and difficult to interpret. Her post above, hourly update, looks great and answers all my questions. I will be looking to enter long on my short term account near the end of Minor 2 provided I am not in the surgery room having my shoulder joint cut up, ground upon, and hammered. Yuk!
Would this have to be minor 3?
End of p4
Minor 1 up to yesterday
Minor 2 down yesterday
And this is 3?
Rodney I appreciate your occasional updates on the state re: traditional technical analysis tools, thanks.
Well shock and awe: the 1.27% extension of the minor 1 up is 2699. That 2700 pivot will be interesting, and even for bulls…maybe a place to take tactical shorts. Lots of likely resistance above that too: swing high at 2708.5, then the 61.8% retrace of the move down from the 2800 level (top of 2 to bottom of 5 of the ending diagonal C wave I guess it is) at 2720.
TLT may be stalling out/turning at the overlapped fibo’s at 118.8. Chart shows weekly (upper left), daily, hourly, 5 min (clockwise).
My first trigger is a break below the lower Darvas range box on the 5 minute at 118.5. My second trigger will be a break below the lower Darvas range box on the hourly at 117.5.
On second trigger, I add to my shorts. I continue to see this entire up move as a completely nominal counter trend swing, and at it’s current length, it’s quite symmetrical with many recent (over the last 1.5 years) up swings.
That all said, a move up first to the overlapped fibos at 120.5 is still possible.
SPX has now polarity inverted on the hourly, and the hourly trend (as I measure it) is now strongly up.
I hope you are willing to comment on this question….. IF you were going to buy SPY 300 calls in order to reach Lara’s target, which month would you buy them for? Anyone feel free to chime in…… I’m currently picking up March 15th
By my quick count on the weekly, looking at intermediate 5, you are looking at (given a similarly structured move) on the order of 25 weeks.
March is WAY too early…if you want to “get there”. If I was to consider such a trade (not my style), I’d be thinking Sept perhaps. But…you are going to burn all the premium over that time, so I might even think Dec. to reduce my premium loss. I’d never take this trade myself. Why not buy calls at or under market that are longer term, and capture a lot more via growing intrinsic? Buying way OTM calls is a play for a long shot giant move IMO; SPX doesn’t do that to the upside.
Caveat: I am not an options expert. Yet.
thank you
/ES Dec. GAP FILL $2718 Wave (c)=(a) which could end Bear Wave 2. Starting to love Lara’s alternate daily chart and new lows under $2583 coming.
For me will only trade the down waves until we can push over 2800.18 and we see a bigger Wave (B) type of drop once we fill the gap into 2718.
Ascending Triangle pushing price over 2680
Alternate gets invalidated in 30 pts. Needs to turn real soon, if so.
I think it would only be invalidated at the minute level if it hits 2710. That means the wave count could be restructured and still leave the Alternate of Primary 4 continuing. That is why I said yesterday, I am not convinced 100% that Primary 4 is over until much higher, above 2815.
I think we must watch the action to see what sort of momentum builds. If we approach the 2600 level again, it may not hold. I am trying to remain open minded to all possibilities and must remain ready to close positions at any time. That is part of the reason, I am in cash in my short term trading account. It is ready to deploy upon further price action.
Note: We have exceeded the 12/11 high of 2674 giving us a higher high on the hourly tf. One step at a time. Steady as she goes. The 2700 pivot is the next obstacle to overcome.
This long drawn out sideways action after a gap up opening yesterday eventually led to a pretty decent sell off. Repeating pattern today…or do we start seeing some iii of 3 type action in the day session?
Up and away it would appear.
Played some friday $266 spy puts at about 267.10…. felt good at 266.40 and then 60 seconds later, stopped at breakeven.
The moves are so incredibly quick. I am having a really tough time stopping out. 4th time since yesterday.
intra-day trading SPX is brutal. I increasingly avoid it and trade it positionally at the hourly/daily in alignment with the highest probability count.
If you are really intent on trading at that kind of TF, I would suggest you might focus on RUT/IWM. I find the low tf moves in RUT to be much smoother and prolonged. Because it’s an average of 2000 instead of 500, and (perhaps) less subject to either “manipulation” or (alternative interpretation) jerky moves from semi-random big money buys and sells. To put it simply, it tends to “run” often at the 5 min tf.
I hear you. In the last few weeks, per Lara’s charts, we have identified at least 3 possible bottoms to Primary 4. I have gone long three times. The first time I was stopped out at a minor profit. The second time I was stopped out at a minor loss. This time, the third, my short term leveraged trade was stopped out at a minor loss but my long term non-leveraged position is still intact.
Such is the life of this trader. For me, the important part is to keep the losses very minimal and let the winners run. If we go to 2800 I will have a nice profit that will dwarf the losses. If we go above that, I will be doing my happy dance. But I hear you, it can get frustrating. Hang in there my friend.
The move up from yesterday afternoon’s low of 2621 looks corrective. Perhaps Minor 2 is not yet completed as the chart below indicates.
This is essentially what ari mentioned to me late yesterday when I stated I missed going long at the low of Minor 2 in my short term account because I was traveling. Soooo, if it doesn’t work out this way, don’t blame me! (he-he)
BTW, ari, my magnesium taurate has arrived. Thanks.
That’s great. Hope it works out well for your PVC’s. I’ll try to get an update from you after you take it for a couple of weeks 🙂
SPX trend (monthly, weekly, daily, hourly, starting top left then clockwise).
Neutral, strong down, mild down, neutral.
The 5 minute (not shown) is strong up.
That’s a nice array brother
Thanks M. That’s my “overview” look. For trading, I have another page set at daily-hourly-5min-1min.
If anyone ever wants the ToS code for this trend algo (uses DMI and CCI in combination) coloring, I’m happy to post it.
Hi Kevin. Would you please post such .
Trying…I post and it just disappears for unknown reasons. Something about the formatting is causing strangeness…ah, I suspect all the greater than and less than symbols are blowing the mind of the html input parser here. Not sure how to overcome that easily. I’ll work on it when I get a chance Chris. If anyone has an easy solution (like “wrap all the code in some delimiters” or something) I’m all ears.
Whew…found the issue after a lot of debug. There are SPACES I’ve put in in the color assignments (DefineGlobalColor statements) towards the bottom. You have to DELETE these spaces to get the code correct. If I leave those spaces out…the spam filter is throwing this out.
The colors work for me against a dark background. For a light background, you’ll have to make adjustments for visibility.
Please do not repost anywhere, I’m writing a TASC article on this trend tool and would rather it get out more broadly that that channel, thanks.
————————-
input CCILength = 21;
input CCILimit = 100;
input ADXLength = 8;
input ADXTrend = 15;
def ADX = reference ADX(length = ADXLength);
def DIPlus = reference DIPlus(length = ADXLength);
def DIMinus = reference DIMinus(length = ADXLength);
def Tr = if ADX DIMinus then 1 else
if Tr[1] DIMinus and ADX > ADX[1] then 1 else
if Tr[1] == -1 and DIMinus > DIPlus then -1 else
if Tr[1] >= 0 and DIMinus > DIPlus and ADX > ADX[1] then -1
else 0;
def CCI = CCI(21, CCILimit, CCILimit).CCI;
def OverBought = CCILimit;
def OverSold = -CCILimit;
def OB = if (CCI > OverBought) then 1 else 0;
def OS = if (CCI < OverSold) then 1 else 0;
DefineGlobalColor("StrongUp", Color. GREEN);
DefineGlobalColor("Up", Color. LIME);
DefineGlobalColor("Neutral", Color. WHITE);
DefineGlobalColor("Down", Color. DOWNTICK);
DefineGlobalColor("StrongDown", Color. RED);
AssignPriceColor(
if (Tr == 1 and OB == 1) then
GlobalColor("StrongUp")
else if Tr == 1 then
GlobalColor("Up")
else if Tr == -1 and OS == 0 then
GlobalColor("Down")
else if (Tr == -1 and OS == 1) then
GlobalColor("StrongDown")
else
GlobalColor("Neutral"));
Sorry but that code is messed up. The input parser is deleting stuff because I guess I need to escape it, etcetera. Gad.
Chris (and anyone else), email me and I’ll send the code to you. zinc1024 at that google email place.
1
2
3. Darn it!
But I win because the last shall be first…
Then I win