
Downwards movement for Friday remains just above the invalidation point and on the support line.
Two alternate Elliott wave counts are published for members today.
Summary: The main wave count will expect support at the teal trend line to continue to hold. Assume support holds, until it is broken. Only if that line is breached by a full weekly candlestick will a more bearish scenario be seriously considered.
The main wave count now expects this bull market to end at the end of December 2018 at the earliest, and possibly in March 2019, at 3,090.
Two alternates look at primary wave 4 continuing as a zigzag. It is possible it could overshoot the teal trend line.
New updates to this analysis are in bold.
The biggest picture, Grand Super Cycle analysis, is here.
Last published monthly chart is here, video is here.
MAIN ELLIOTT WAVE COUNT
WEEKLY CHART
Click chart to enlarge.
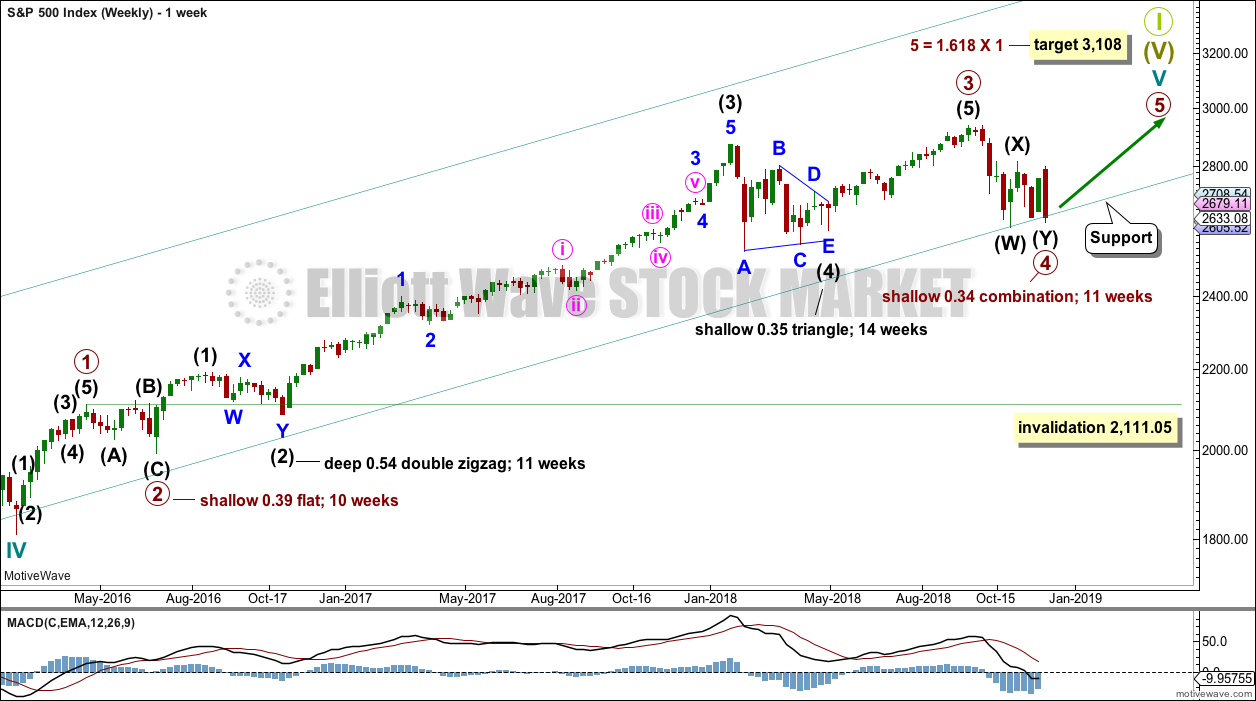
Cycle wave V must complete as a five structure, which should look clear at the weekly chart level and also at the monthly chart level. It may only be an impulse or ending diagonal. It is clear it is an impulse.
Within primary wave 3, there is perfect alternation and excellent proportion between intermediate waves (2) and (4).
Draw the teal channel from the high of cycle wave I at 1,343.80 on the week beginning 3rd July 2011, to the high of cycle wave III at 2,079.46 on the week beginning 30th November 2014, and place a parallel copy on the low of cycle wave II at 1,074.77 on the week beginning 2nd October 2011. Draw this chart on a semi-log scale. A small overshoot, like that seen at the end of cycle wave IV, would be entirely acceptable. If price does move below the channel, then it should reverse reasonably quickly.
Primary wave 4 may be over at the last low as a complete double combination. Price has found support very close to the lower edge of the teal trend channel, with a very small intraday overshoot. If primary wave 4 is over here, it would exhibit perfect alternation in structure with primary wave 2 and almost perfect proportion.
This wave count has the right look at the monthly chart level.
If primary wave 5 ends at or after the end of December 2018 and the AD line fails to make new all time highs, there would then be the minimum required four months of bearish divergence between price and the AD line. If this happens, then the conditions for the end of this bull market would be in place.
A target is calculated for primary wave 5 to end. If primary wave 5 were to be only equal in length with primary wave 1, then it would be truncated. A truncated primary wave 5 would be unlikely as then there could be no bearish divergence with the AD line. The next Fibonacci ratio in the sequence is used to calculate a target for primary wave 5.
Primary wave 4 may not move into primary wave 1 price territory below 2,111.05.
Three daily charts below are published in order of probability.
DAILY CHART
Click chart to enlarge.
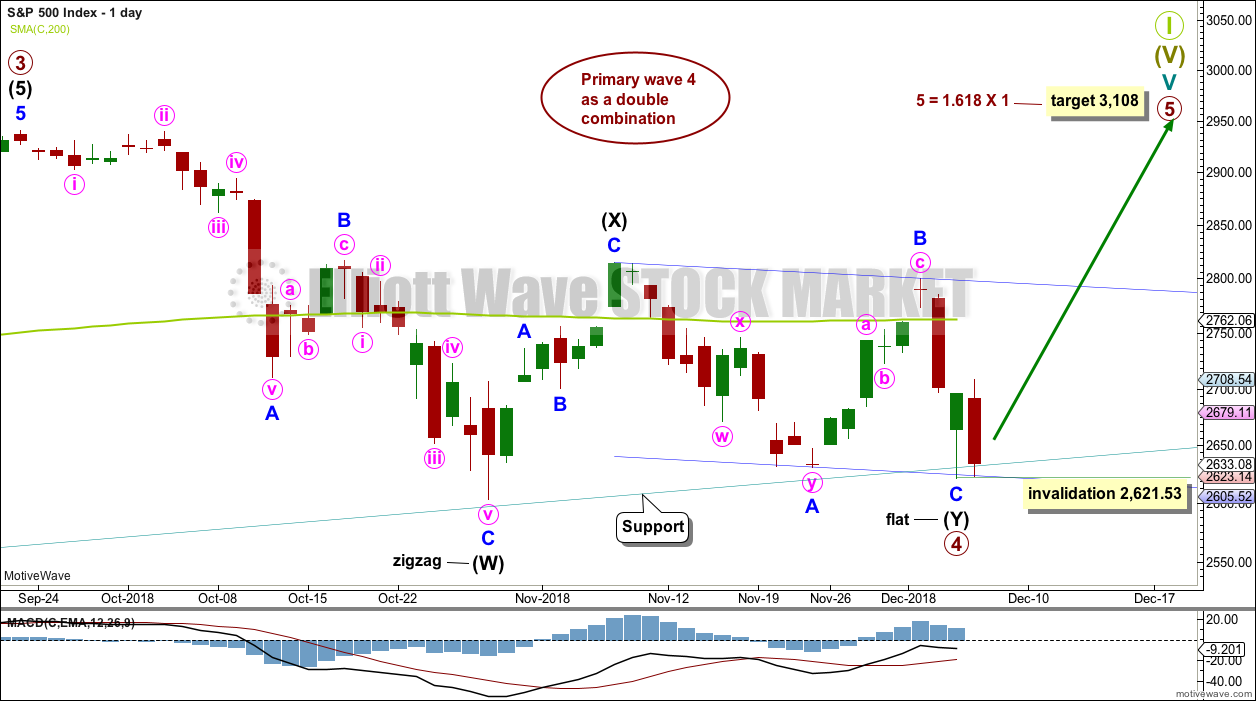
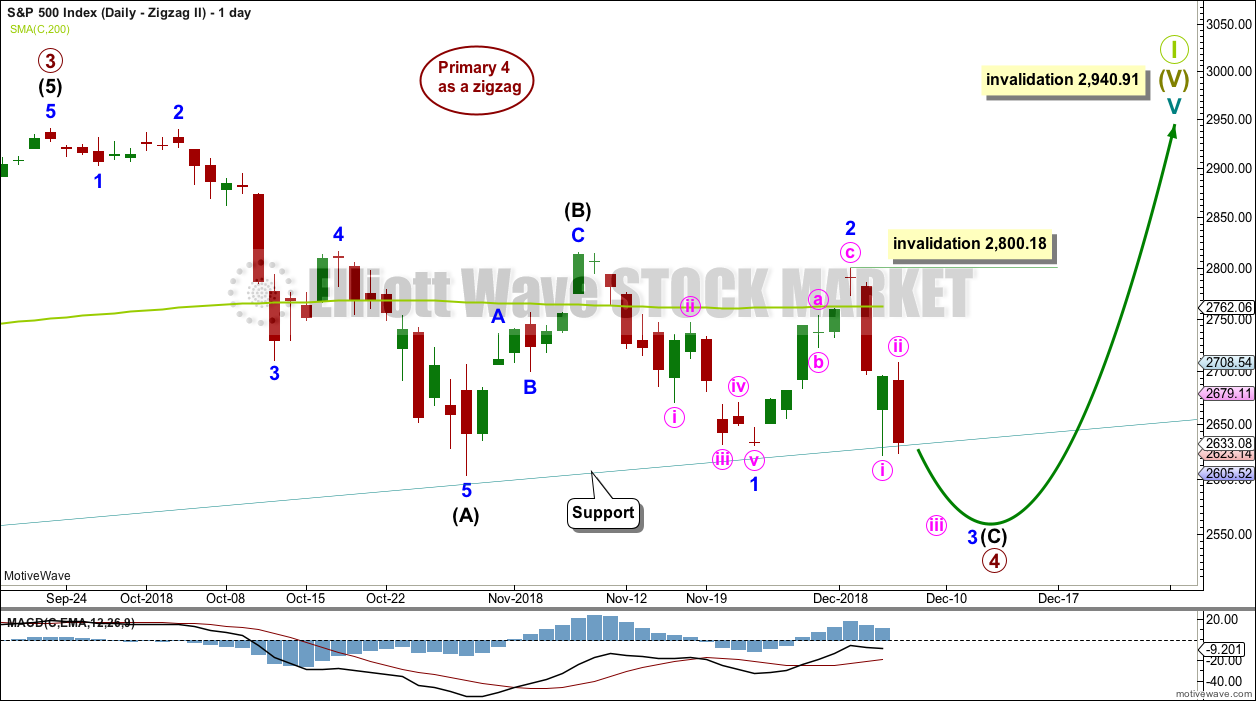
Primary wave 4 may be complete as a double combination. The first structure in the double may be a complete zigzag labelled intermediate wave (W). The double may be joined by a three in the opposite direction labelled intermediate wave (X). Intermediate wave (X) may be complete as a single zigzag; it is deep at 0.63 the length of intermediate wave (W), which looks reasonable.
While double combinations are fairly common structures, triple combinations are extremely rare. The probability that the entire correction is complete is very high when a second structure in a multiple is complete.
Intermediate wave (Y) may be a regular flat correction, subdividing 3-3-5.
Within the flat correction of intermediate wave (Y), minor wave C is 5.41 points short of equality in length with minor wave A. This is close enough to say they have an adequate Fibonacci ratio of equality.
Within primary wave 5, no second wave correction may move beyond the start of its first wave below 2,621.53.
Primary wave 5 at its end may be expected to exhibit reasonable weakness. At its end, it should exhibit a minimum of 4 months bearish divergence with the AD line, it may exhibit bearish divergence between price and RSI and Stochastics, and it may lack support from volume.
HOURLY CHART
Click chart to enlarge.
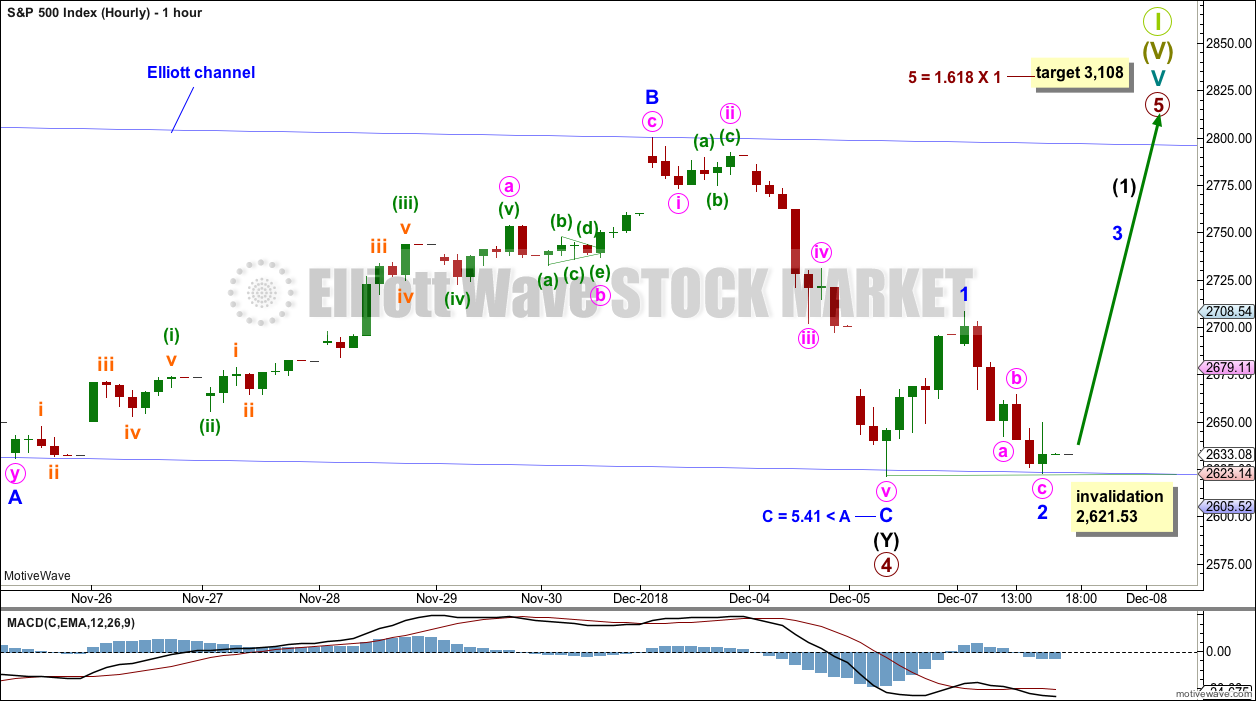
Minor wave C subdivides very well on the hourly chart as a complete five wave structure.
Minor wave C may have ended with a very small overshoot of the lower edge of the blue channel, which contains the regular flat correction of intermediate wave (Y). Regular flats are usually well contained within their channels. When the upper edge of the blue Elliott channel is breached, that shall provide strong confidence that primary wave 4 should be over.
Within the new trend of primary wave 5, no second wave correction may move beyond the start of its first wave below 2,621.53.
If this wave count is invalidated when markets open on Monday, then the next wave count below may be used.
ALTERNATE DAILY CHART
Click chart to enlarge.
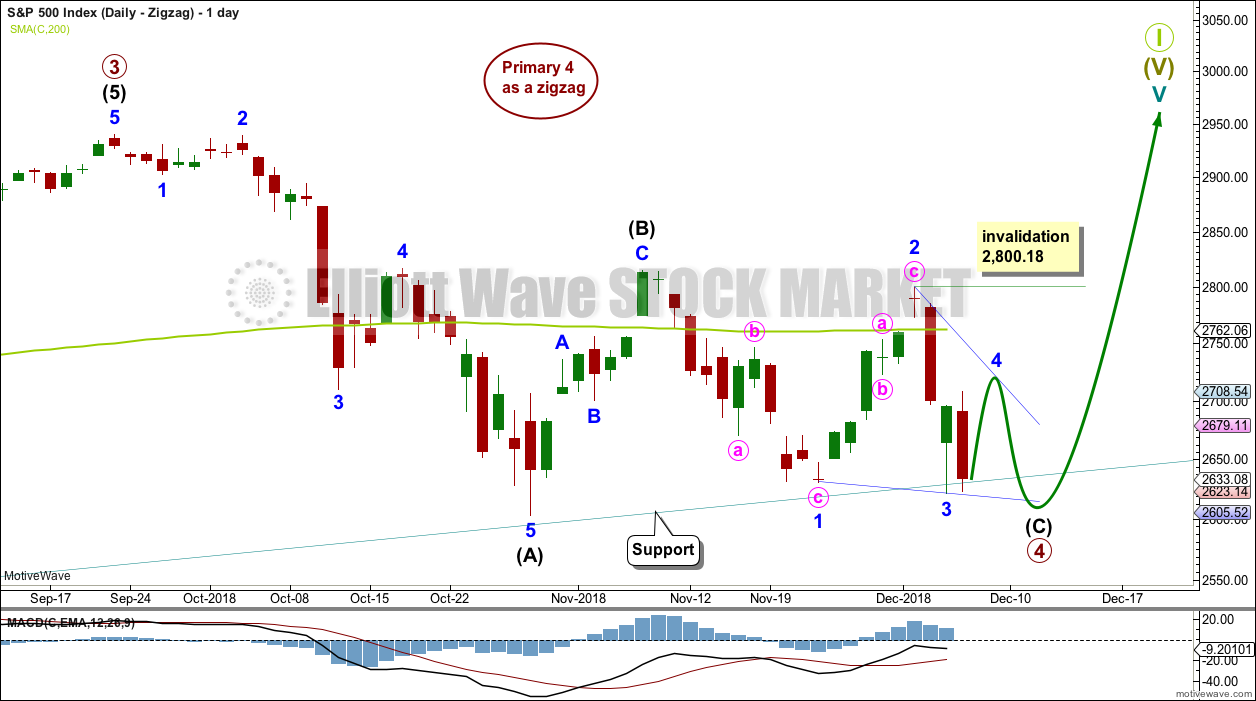
This wave count has been published before with some variation. It considers primary wave 4 continuing as a single zigzag.
Within the zigzag, intermediate wave (C) may be an almost complete ending contracting diagonal.
Within the ending diagonal, all sub-waves must subdivide as zigzags, minor wave 4 must overlap minor wave 1 price territory, and minor wave 4 may not move beyond the end of minor wave 2 above 2,800.18.
Minor wave 5 may end with a small overshoot of the 1-3 trend line.
It is possible that minor wave 4 may move sideways as the arrow suggests. This would give the diagonal trend lines a more normal look. It is also possible that minor wave 4 could be over at Friday’s high and minor wave 5 may continue lower on Monday.
This wave count would expect only a small overshoot of the teal trend channel.
SECOND ALTERNATE DAILY CHART
Click chart to enlarge.
The other possible structure for intermediate wave (C) would be a simple impulse. If intermediate wave (C) is unfolding as an impulse, then it may now have two first and second waves complete. This wave count would expect to see an increase in downwards momentum early next week as the middle of a third wave unfolds.
Minute wave ii may not move beyond the start of minute wave i above 2,800.18.
This wave count would expect to see a strong overshoot of the teal trend channel on the weekly chart, and possibly a breach on the daily chart. This would be acceptable; it has happened before on the 11th of February 2016 for one session.
The S&P commonly forms slow curving rounded tops. When it does this, it can breach channels only to continue on to make new all time highs. It is possible that Super Cycle wave I may end in this way.
TECHNICAL ANALYSIS
WEEKLY CHART
Click chart to enlarge. Chart courtesy of et=”_blank”>StockCharts.com.
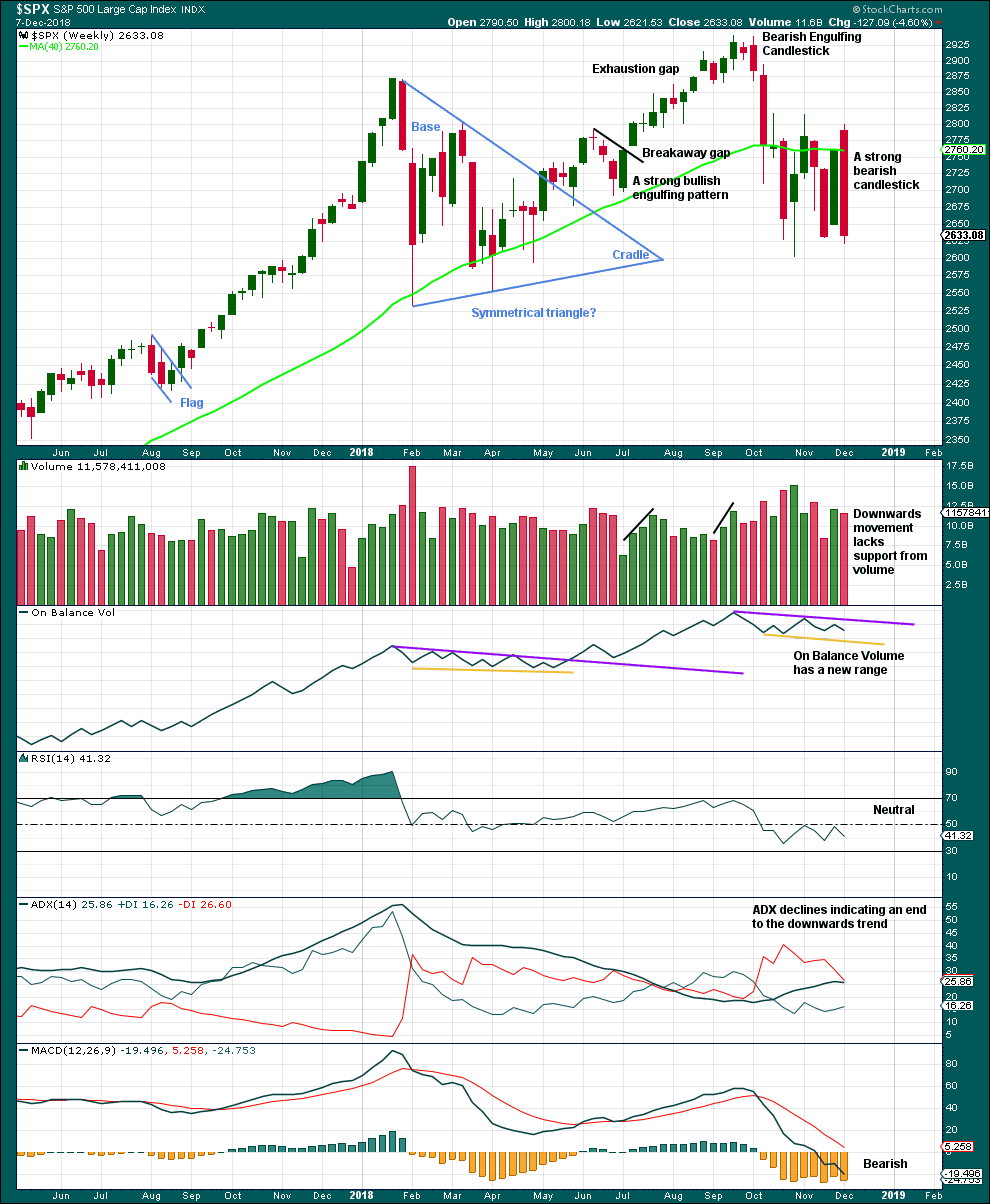
This weekly candlestick is a strong bearish candlestick, but does not meet all the criteria for a Bearish Engulfing pattern. From Nison, “Japanese Candlestick Charting Techniques” page 43:
“There are three criteria for an engulfing pattern:
1. The market has to be in a clearly definable uptrend (for a bearish engulfing pattern)…
2. Two candles comprise the engulfing pattern. The second real body must engulf the prior real body (it need not engulf the shadows).
3. The second real body of the engulfing pattern should be the opposite colour of the first real body.”
This market is not currently in a clearly definable upwards trend, so the first criteria is not met.
A decline in volume this week may be due to the week being a short trading week, and so it would be best to look inside the week to determine the short-term volume profile.
However, the strongest volume for recent weeks is for the upwards week beginning 29th of October. This short-term volume profile at this time frame is bullish.
For a more bearish outlook a bearish signal from On Balance Volume would be preferred.
DAILY CHART
Click chart to enlarge. Chart courtesy of StockCharts.com.
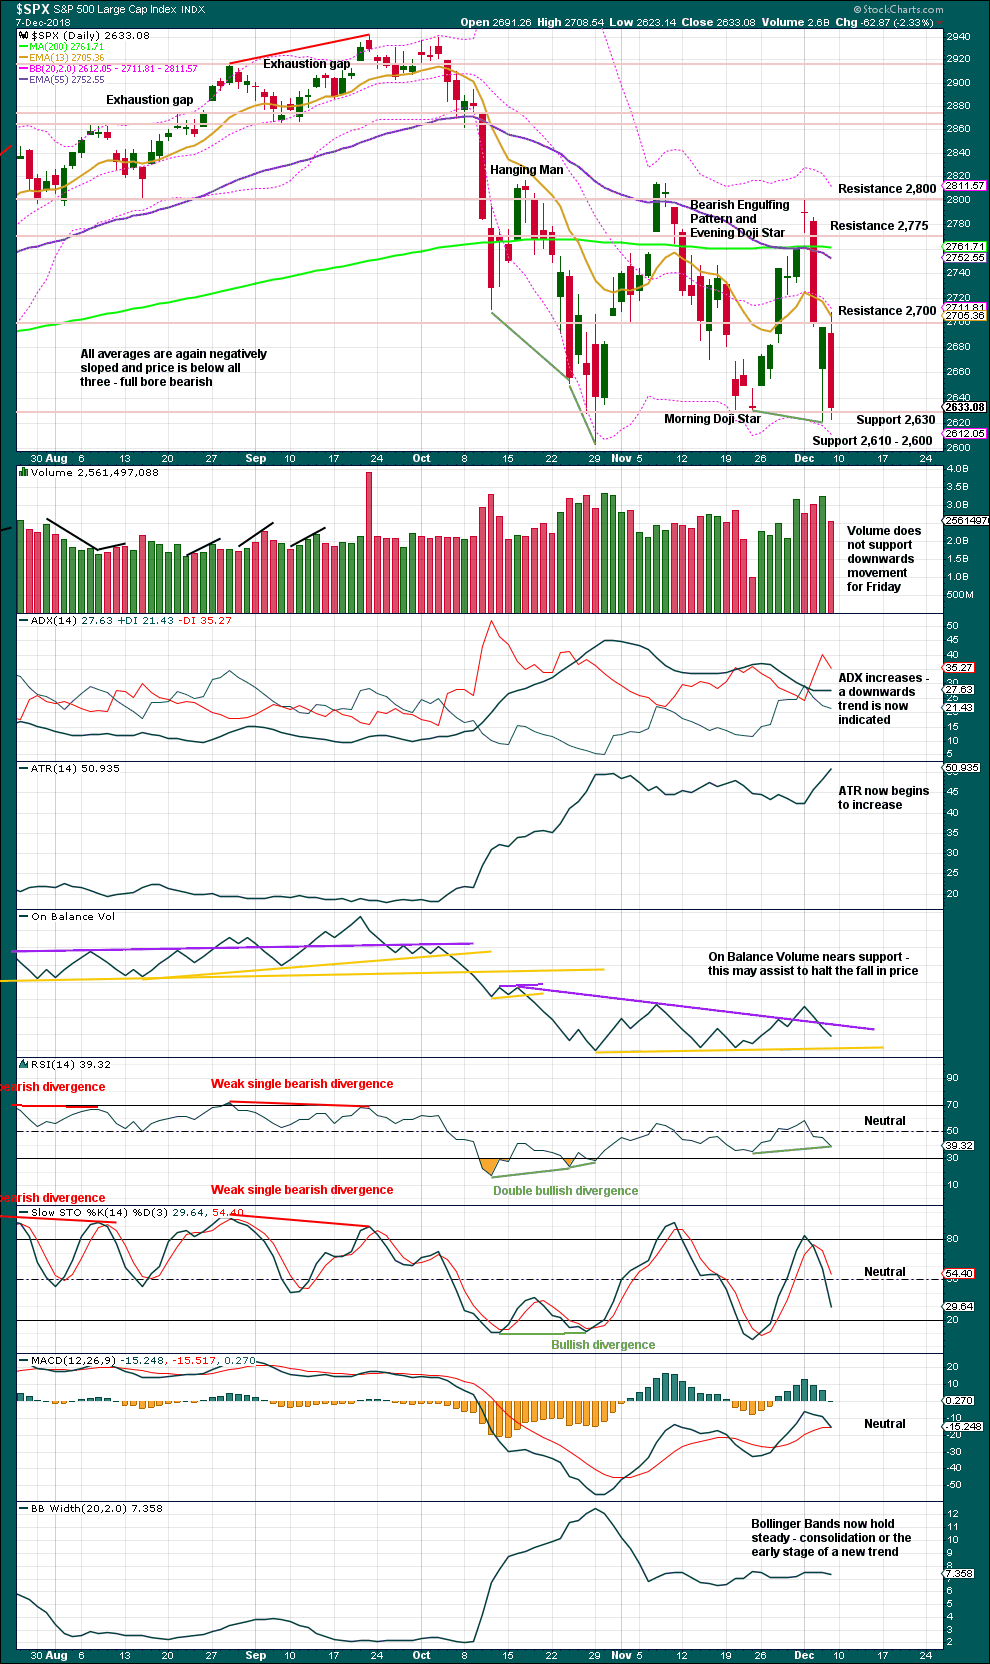
The lower edge of the teal trend channel is not shown on this chart, but it should be considered as part of this technical analysis. Expect that trend line to continue to provide support, until it does not.
Support at the teal trend line holds. While Friday is a strong downwards day, it has not made a new low and volume shows a decline. The market can fall of its own weight though for long distances, and so a decline in volume is not necessarily bullish.
The last bearish signal from On Balance Volume is too weak to support a more bearish outlook here: the trend line broken has some reasonable slope, was only tested three times, and had been breached and weakened before a second breach. The lower support line offers stronger technical significance, which may assist to halt a fall in price if price does continue lower here.
Bullish divergence between price and RSI remains, although it was weakened on Friday.
Currently, this market is consolidating with resistance about 2,815 and support about 2,605 to 2,620. It is the upwards day of the 30th of October that has strongest volume during this consolidation, suggesting an upwards breakout may be more likely than downwards. This technique does not always work, but it does work more often than it fails.
On balance it is my judgement that there is not enough strength in downwards movement yet for a more immediately bearish outlook.
BREADTH – AD LINE
WEEKLY CHART
Click chart to enlarge. Chart courtesy of StockCharts.com. So that colour blind members are included, bearish signals
will be noted with blue and bullish signals with yellow.
Both price and the AD line have moved lower this week. There is no divergence, and the AD line is not falling any faster than price here.
DAILY CHART
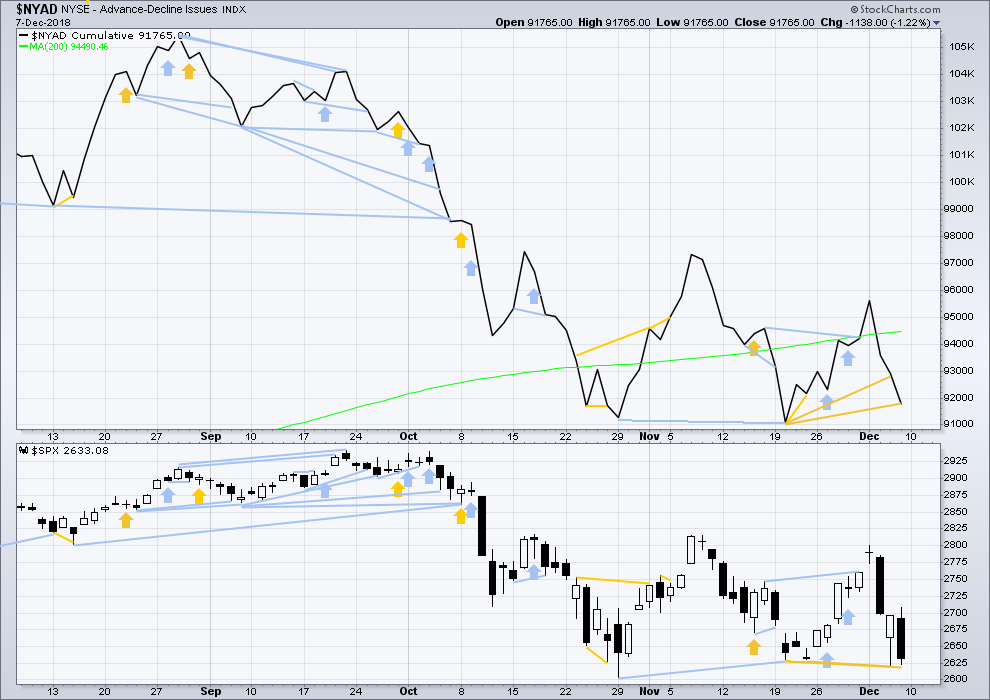
Click chart to enlarge. Chart courtesy of StockCharts.com. So that colour blind members are included, bearish signals
will be noted with blue and bullish signals with yellow.
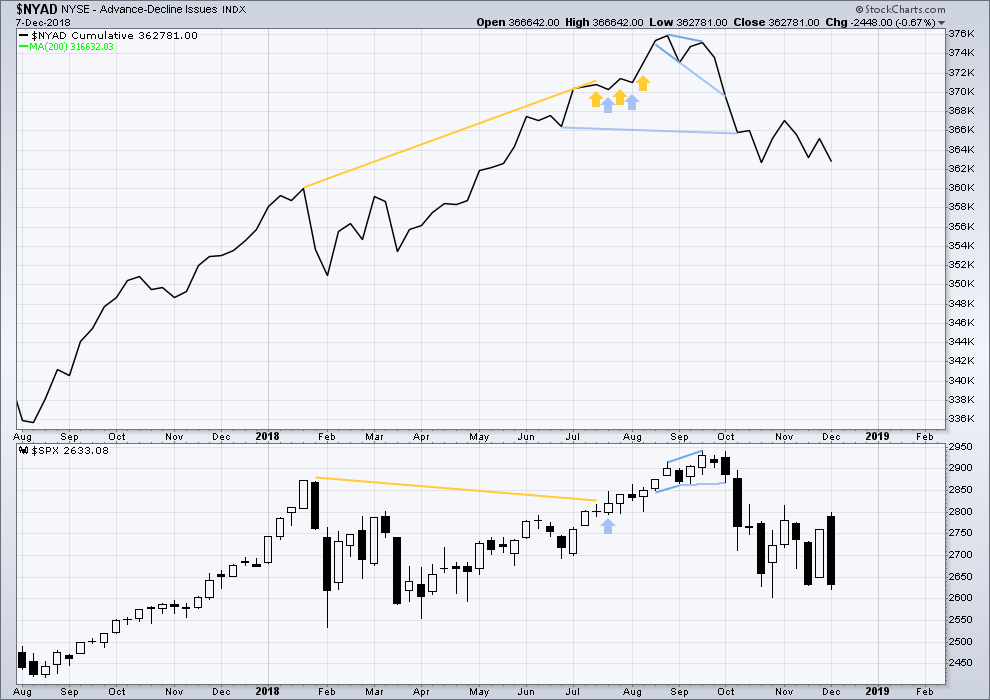
There is normally 4-6 months divergence between price and market breadth prior to a full fledged bear market. This has been so for all major bear markets within the last 90 odd years. With no longer-term divergence yet at this point, any decline in price should be expected to be a pullback within an ongoing bull market and not necessarily the start of a bear market. New all time highs from the AD line on the 29th of August means that the beginning of any bear market may be at the end of December 2018, but it may of course be a lot longer than that.
Breadth should be read as a leading indicator.
Both price and the AD line have moved lower on Friday, but price has made another new swing low yet the AD line has not made a corresponding swing low. The fall in price does not have support from a corresponding fall in market breadth. This divergence is bullish.
VOLATILITY – INVERTED VIX CHART
WEEKLY CHART
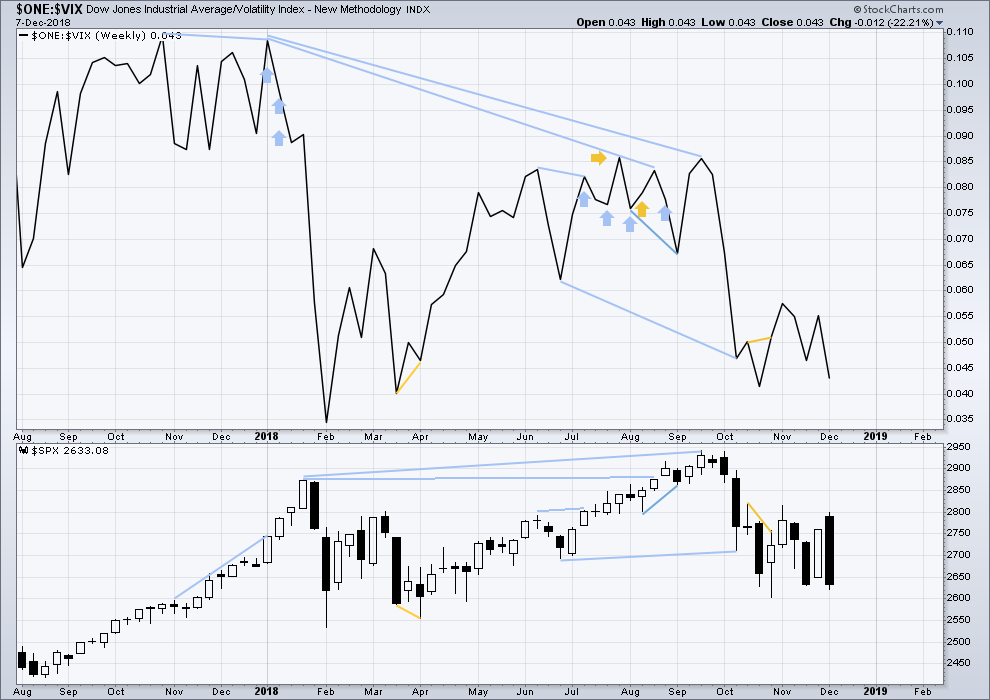
Click chart to enlarge. Chart courtesy of StockCharts.com. So that colour blind members are included, bearish signals
will be noted with blue and bullish signals with yellow.
Both price and inverted VIX have moved lower this week. The fall in price comes with a normal corresponding increase in volatility, but VIX is not increasing any faster than price. There is no divergence and no bearish signal.
DAILY CHART
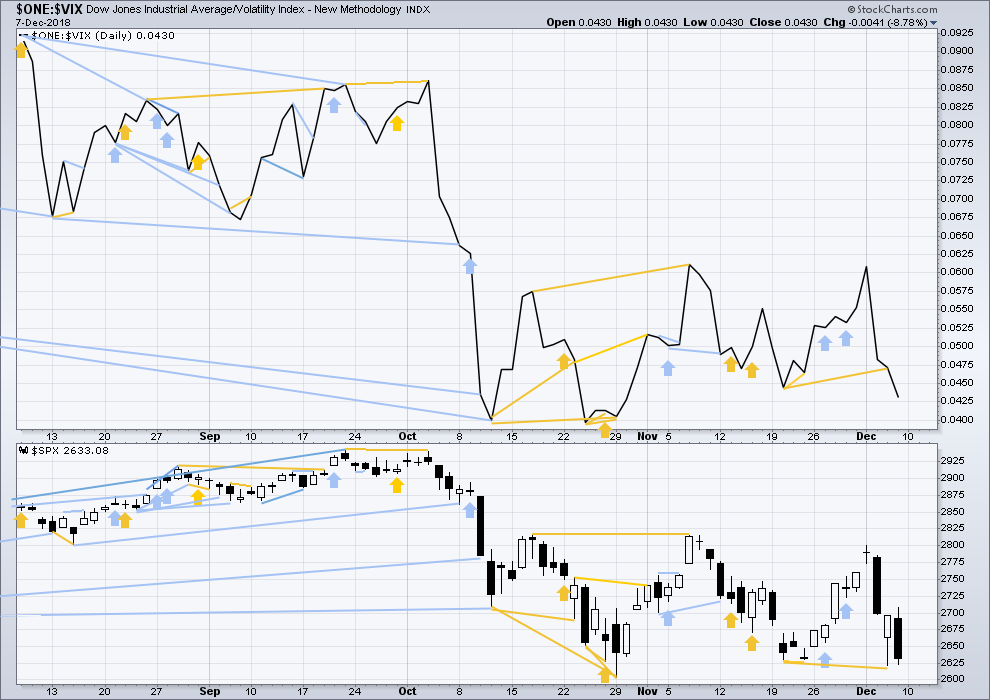
Click chart to enlarge. Chart courtesy of StockCharts.com. So that colour blind members are included, bearish signals
will be noted with blue and bullish signals with yellow.
Normally, volatility should decline as price moves higher and increase as price moves lower. This means that normally inverted VIX should move in the same direction as price.
Like the AD line, inverted VIX may now begin to accumulate instances of bearish signals or divergence as a fifth wave at three large degrees comes to an end.
Bullish divergence noted in last analysis has not been followed by upwards movement, so it is considered to have failed.
Both price and inverted VIX moved lower on Friday. Downwards movement in price has support from a normal corresponding increase in VIX. There is no new divergence.
DOW THEORY
The following lows need to be exceeded for Dow Theory to confirm the end of the bull market and a change to a bear market:
DJIA: 23,344.52.
DJT: 9,806.79.
S&P500: 2,532.69.
Nasdaq: 6,630.67.
Published @ 02:10 a.m. EST on December 8, 2018.
—
Careful risk management protects your trading account(s).
Follow my two Golden Rules:
1. Always trade with stops.
2. Risk only 1-5% of equity on any one trade.
Watch what happens when we roll spreads out a week…lol!
Gorgeous bull pennant in TZA…! 🙂
So….what do we think volatility is saying today? 🙂
I’ll go first: I haven’t got a clue. I would have expected it to move more however (in both directions).
Look at reaction to recent support shelves…. 🙂
Dropping like a rock now
Not EXACTLY like a rock…lol!
It will go lower tomorrow, but look alive people.
The bet set-up of the year dead ahead…!
Please don’t miss it!! 🙂
honestly, I am not even sure if you are talking long or short?
Having a bit of fun with the banksters today. Just for you know what and giggles I opened a colossal bear call spread on SPY at 261.50/ 262.00 expiring today and like moths drawn to a flame they swarmed, all over it…lol!
Will I have to roll it, or are they going to take all their marbles and go home??? He!he!
Under 261.50 before close? Sounds about par for the course today.
You just watch. They are going to do their damndest to shake us out before the close… lol!
So….knowing exactly what they are going to do, what is my advantage? 🙂
So, what we have seen is an intraday piercing of the teal channel line, right? Is this another time it will provide support? Lara said it will take a breach of this line on the weakly chart for it to be properly breached. Is this the week?
At this point, I don’t think so. My stops on trading (short term) action were stopped out today. But the longer term long positions are still in place. I am still looking for positive divergences with this low today. I wouldn’t mind seeing VIX close above its daily BB and SPX below its daily BB which could set up a nice bullish leg up.
Nope. Not breached, and price closed back above the line. This looks pretty bullish to me, at least for the short term.
I can’t tell you how relieved I am to see this hammer pattern today, and not a big red candlestick.
The first alternate wave count updated:
If price closes about here it would complete a bullish Hammer candlestick reversal pattern.
Both alternates remain valid, the main count is invalidated. This is now going to be the main preferred wave count.
OK. Thanks. A single zig-zag, right?
Yes. That’s what I think is most likely happening today.
This candlestick looks like it will be a very strong Hammer pattern.
Or possibly a Dragonfly Doji
That looks right and very consistent with my view that today’s reversal bar is a “classic” ending of both a sharp hard sell off/shake out and an fine end to the overall P4.
I am wearing my bull eyes…but I think the shading isn’t too strong! Lol!!
Of the 18 times that $SPX was down at least -1.89% midday on a Monday only to finish green (which it hasn’t quite done yet at tweetpost time), ???????? happened between 1928-1934.
14 of 18 occurred with $SPX down -20% or worse.
This is not bull market behavior.
@OddStats
Except that conclusions (even tentative hypotheses) drawn from tiny data samples are meaningless. Even a few thousand isn’t really enough. My statistics based $0.02.
I’d agree that anything can happen here. I’d disagree that a few odd data points tell us with high confidence what that “anything” is.
What I do “know” with rather high confidence is eventually this P4 is going to end, here or later/lower. I’ve yet to have Lara be wrong at that level of wave count work. Sure, there is always a first time. I don’t see anything that says this is going to be it, though.
I think the thing to glean from this is that P4 will give us a taste of a real bear market.
These past few weeks have certainly shown that.
It has.
It may be over, too.
VIX flying a cautionary bull flag….the battle rages….the pivot close will probably decide the contest….
ok up and through the pivot. “houston….we have a bottom!”.
For how long…is the eternal question. How about until the end of the GSC? Maaaaaybe….but I guess that old adage applies, “one day at a time”.
Possibly even a Larry Williams “oops” day today…a rather bullish indicator after such a strong multi-day sell off, and a proper way to end a P4 IMO. But the day is not finished.
Hammers Galore at the moment in all indexes.
Verne, what time frame are you thinking with this post, We could get an interim bottom followed by a nice bounce after a new low.
Look for confirmation with a lower VIX high and fat red candle.
and thank you for all your post.
The current cash session…
Looks like it will be a Hard Brexit in March 2019… I don’t see the Globalist EU conceding and I don’t see the UK Parliament voting in favor of anything close to the Globalist EU agreement that is on the table!
UK will leave in March without any agreement… a Hard Brexit!
They will be MUCH better off…what’s more, the people know it. Juncker is as drunk as a skunk, and his politics have the same aroma… 🙂
I agree… they will be better off with a Hard Brexit. I am sure the USA and others would immediately put a trade agreement in place.
We could get an interim bottom followed by a nice bounce after a new low.
Look for confirmation with a lower VIX high and fat red candle. 🙂
SPX 2620 is now the critical pivot to watch. They spent a ton trying to defend it so far.
A move back above is near term bullish. A close below and the “managed decline” likely continues.
Thanks Kevin for doing that research on the Zweig Breadth Thrust Indicator. I appreciate your time and effort to clarify that. My long positions have been stopped out. Sitting on hands awaiting further price action and analysis.
Rod, why did you go long with an impending 50/200 day MA cross?
Sometimes simple is preferable! 😉
I understand and appreciate the strategy. However, I heard / read two commentaries that analyzed the “Death Cross” of the 50 day ma crossing the 200 day ma from above. Both stated that the evidence does not support the conclusion. C. Ciovacco is one of the sources. The other is a citation of a study going back to 1970, if I recall properly. It was cited by Chris C. The conclusion was that there is no correlation between the 50-200 day ma cross over and the direction of the market after wards. In fact, something like 50% of the time, the direction turns back up shortly after the cross.
So, that is the reason, fwiw.
BTW, C. Ciovacco essentialy said this weekend we are at an inflection point where really bad things can happen or equally, really good things can happen. He is reviewing his exit strategy which is implemented in a series of moves.
Considering the pace of these kinds of averages, I would really like to see that study, and how they arrived at such a conclusion. These kinds of crosses simply do not happen unless there are several months of confirming price action so on its face, that study’s conclusion strikes me as being a bit strange. I will try to find it and take a gander. Thanks!
The study struck me as well. I will need to listen again to C. Ciovacco’s youtube submission from this weekend. If not this weekend, weekend before. If I have time I’ll do it but that is not likely today.
By the way, did anyone else see what my beloved Chicago Bears did last evening?
So… the SECOND ALTERNATE DAILY CHART
is the only Chart remaining today! Let’s see what others Lara produces later today.
Also, would like to see what Verne’s view is here as well.
Hi yah Verne!
Let us know when you think P4 is over and you turn bullish! Lol
You’ve been correct predicting this further down movement… I need to know when the Verne indicator turns green 🙂
🙂 upvote this comment! Long the Verne indicator.
Down, and down, and down we go…
Market in search of a bottom today. 2603 would be the major double bottom price for this P4. But it feels like much lower might be in the cards.
LOD 2603.16 as of now. Broke the low of some weeks ago by 50 cents.
I just have no faith in a bounce, which likely means $270 this week. haha
I strive mightily to not have faith in anything. Just let the market inform me, and the various wave counts (“roadmaps”) to guide me.
Probably the way to be. I am the lightest I have been in quite some time.
99.75% cash outside of my retirement accounts. and the 0.25% is in end of Dec SPY calls which are essentially dead now. haha
The first one already invalidated.
Is there a southernly invalidation of the 3rd alternate?
Hi Lara, as
I know you have been talking about this bull ending in october of 2019 previously, citing lowry stats among one of your reasons. I know this is ever changing as data continues to flow in. Recently you stated:
“The main wave count now expects this bull market to end at the end of December 2018 at the earliest, and possibly in March 2019, at 3,090.”
Can you explain/reexplain why the end of this bull market has been moved up so drastically. Has lowry’s data changed?
Thanks.
I’ve been saying since the end of August that at the time the AD line made it’s (last) all time high, the beginning of a bear market may be a minimum of 4 months from that date.
I had expected October next year as the most likely.
Lowry’s data hasn’t changed, the AD line still made it’s last ATH on 29th August.
I can’t calculate a target at primary degree until P4 is over and so I know the price point where P5 begins. I couldn’t do that until very recently. With the target now calculated at primary degree it changes, and so the expectation of time may also change.
The weekend’s first. Hurray fo me.
Karen posted yesterday about the Zweig Breath Thrust Indicator that has given a bullish signal. Good catch Karen. Very significant in my book.
Yikes!
Set VERY tight stops…. 🙁
You always seem to be looking for down down down. What are your thoughts?
What I or anyone else look for, or think, is irrelevant. The important thing is to look at, and listen to, the market itself. Granted we sometimes conclude different things when we do this, but since it is your money at risk, it is worth taking the time and effort to learn how to do it reasonably well. First rule is to get the TREND right.
Marty Zweig Breath Thrust indicator, eh?
Sounds like some kind of Kundalini Yoga technique to raise consciousness to me! I will do some breath thrusts Monday morning before market open to get myself properly prepared.
🙂
Breadth. Sorry about my typo. But I cannot find a confirmation that the signal was flashed.
I found what is supposed to be the ThinkScript code:
declare lower;
plot zw = ExpAverage(data = close(“$advn”), length = 10 ) /( ExpAverage(data=close(“$advn”), length=10) + ExpAverage(data=close(“$decn”), length = 10));
plot forty = 0.40;
forty.SetDefaultColor(Color.RED);
plot sixfifteen = 0.615;
sixfifteen.SetDefaultColor(Color.Yellow);
It says “best applied at the weekly level”. It’s not fired at the weekly level…and hasn’t since 2011!!
I don’t think there’s much value here, myself.
Sorry, my bad. I was looking at a monthly chart. At a weekly level, the indicator is close to firing in the BEARISH direction (but has not). It last fired in a bullish direction on 3/12, which was followed 2 weeks later by the huge C wave down of the intermediate 4.