
Downwards movement has indicated that an alternate Elliott wave count is now more likely.
Today’s signals from the AD line, VIX and candlesticks are used to determine tomorrow’s most likely direction.
Summary: It looks most likely that a low may again be in place. Reasonable weakness is indicated by the long lower candlestick wick, a close at the high for the session, and bullish divergence between price and the AD line and inverted VIX and RSI.
The main wave count now expects this bull market to end at the end of December 2018 at the earliest, and possibly in March 2019, at 3,090.
The last gap may provide support at 2,682.53.
New updates to this analysis are in bold.
The biggest picture, Grand Super Cycle analysis, is here.
Last published monthly chart is here, video is here.
MAIN ELLIOTT WAVE COUNT
WEEKLY CHART
Click chart to enlarge.
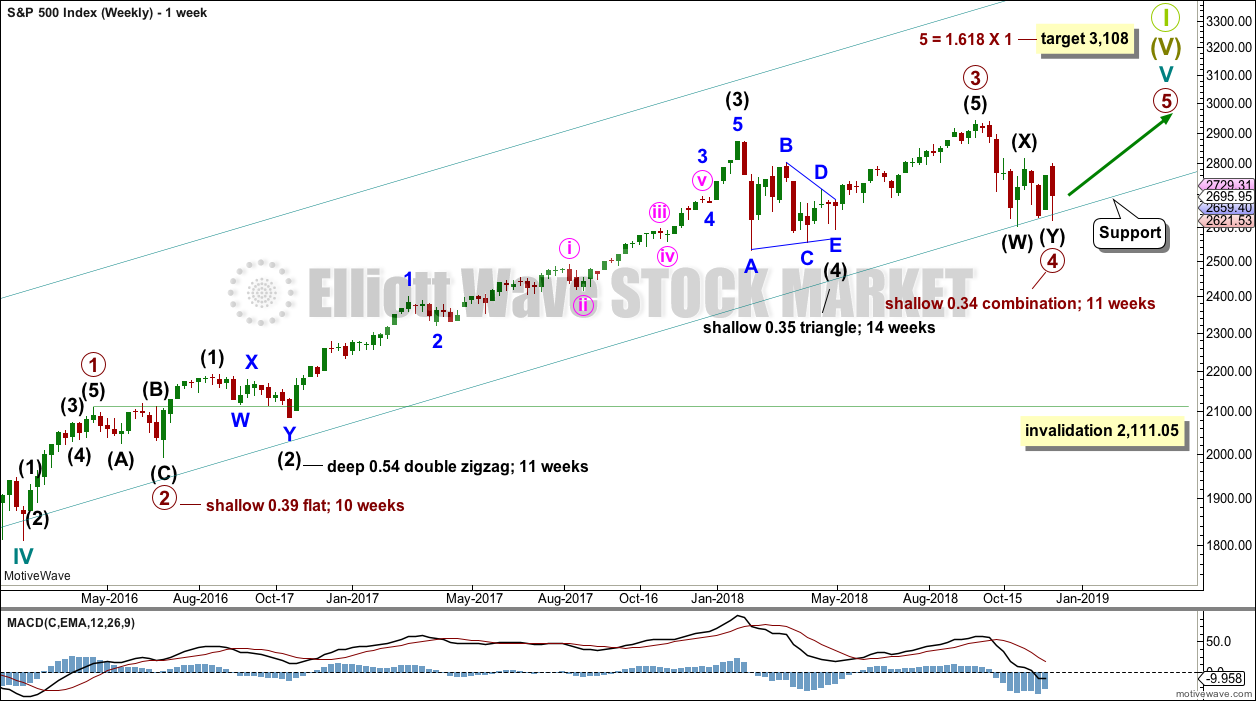
Cycle wave V must complete as a five structure, which should look clear at the weekly chart level and also at the monthly chart level. It may only be an impulse or ending diagonal. It is clear it is an impulse.
Within primary wave 3, there is perfect alternation and excellent proportion between intermediate waves (2) and (4).
Draw the teal channel from the high of cycle wave I at 1,343.80 on the week beginning 3rd July 2011, to the high of cycle wave III at 2,079.46 on the week beginning 30th November 2014, and place a parallel copy on the low of cycle wave II at 1,074.77 on the week beginning 2nd October 2011. Draw this chart on a semi-log scale. A small overshoot, like that seen at the end of cycle wave IV, would be entirely acceptable. If price does move below the channel, then it should reverse reasonably quickly.
Primary wave 4 may be over at today’s low as a complete double combination. Price has found support very close to the lower edge of the teal trend channel, with a very small intraday overshoot. If primary wave 4 is over here, it would exhibit perfect alternation in structure with primary wave 2 and almost perfect proportion.
This wave count has the right look at the monthly chart level.
If primary wave 5 ends at or after the end of December 2018 and the AD line fails to make new all time highs, there would then be the minimum required four months of bearish divergence between price and the AD line. If this happens, then the conditions for the end of this bull market would be in place.
A target is calculated for primary wave 5 to end. If primary wave 5 were to be only equal in length with primary wave 1, then it would be truncated. A truncated primary wave 5 would be unlikely as then there could be no bearish divergence with the AD line. The next Fibonacci ratio in the sequence is used to calculate a target for primary wave 5.
If primary wave 4 continues any further, then it may not move into primary wave 1 price territory below 2,111.05.
DAILY CHART
Click chart to enlarge.
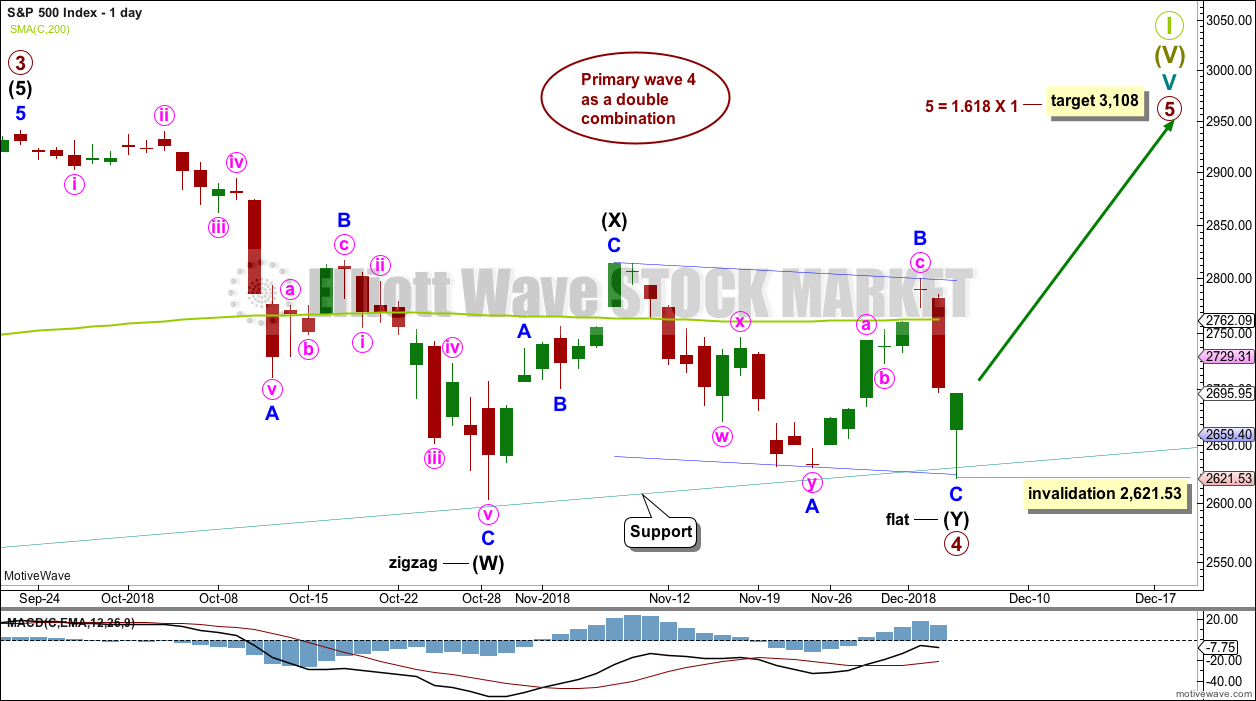
Primary wave 4 may be complete as a double combination. The first structure in the double may be a complete zigzag labelled intermediate wave (W). The double may be joined by a three in the opposite direction labelled intermediate wave (X). Intermediate wave (X) may be complete as a single zigzag; it is deep at 0.63 the length of intermediate wave (W), which looks reasonable.
While double combinations are fairly common structures, triple combinations are extremely rare. The probability that the entire correction is complete is very high when a second structure in a multiple is complete.
Intermediate wave (Y) may now be a complete regular flat correction, subdividing 3-3-5.
Within the flat correction of intermediate wave (Y), minor wave B is 0.92 the length of minor wave A. A regular flat correction may be unfolding for intermediate wave (Y).
Within the flat correction of intermediate wave (Y), minor wave C is 5.41 points short of equality in length with minor wave A. This is close enough to say they have an adequate Fibonacci ratio of equality.
Within primary wave 5, no second wave correction may move beyond the start of its first wave below 2,621.53.
Primary wave 5 at its end may be expected to exhibit reasonable weakness. At its end, it should exhibit a minimum of 4 months bearish divergence with the AD line, it may exhibit bearish divergence between price and RSI and Stochastics, and it may lack support from volume.
HOURLY CHART
Click chart to enlarge.
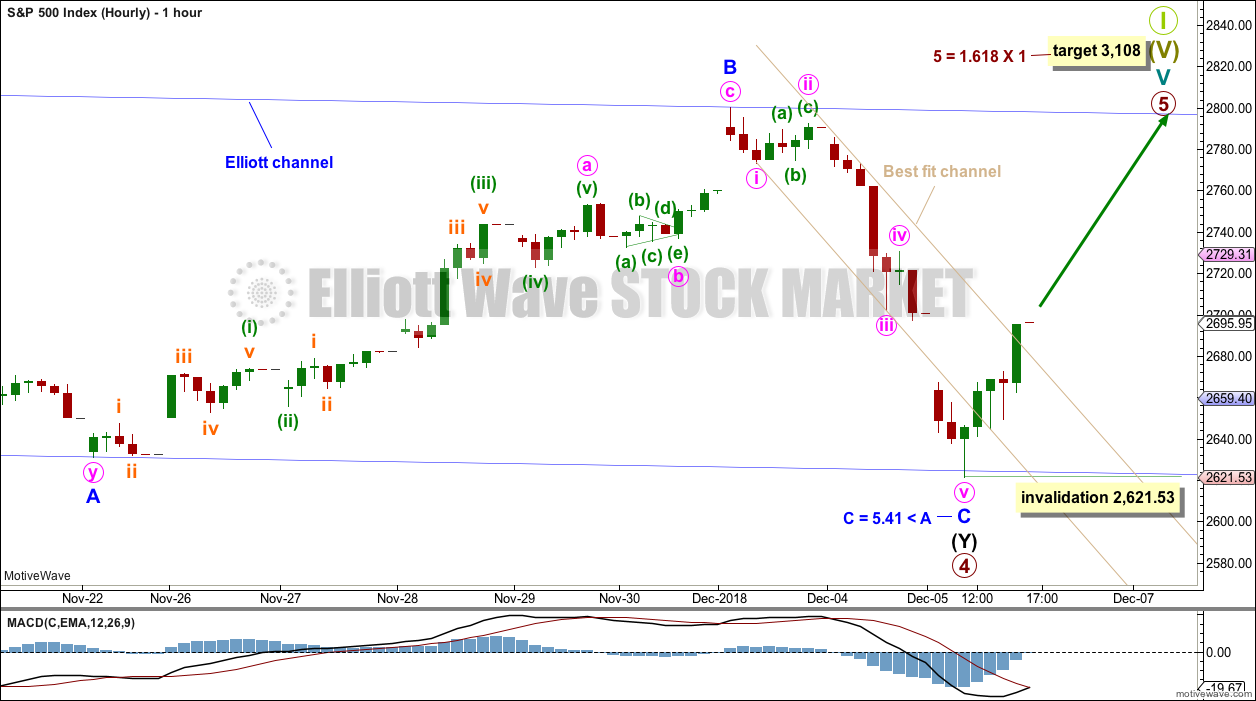
Within intermediate wave (Y), minor wave C subdivides very well on the hourly chart as a complete five wave structure.
Minor wave C may have ended with a very small overshoot of the lower edge of the blue channel, which contains the regular flat correction of intermediate wave (Y). Regular flats are usually well contained within their channels. When the upper edge of the blue Elliott channel is breached, that shall provide strong confidence that primary wave 4 should be over.
For the shorter term, a best fit channel is drawn about the impulse of minor wave C. This channel has been breached in the last hour of this session. This is an early warning that minor wave C may be over. However, although this channel has multiple tests of resistance at the upper edge the steep slope reduces its technical significance.
Within the new trend of primary wave 5, no second wave correction may move beyond the start of its first wave below 2,621.53.
ALTERNATE ELLIOTT WAVE COUNT
WEEKLY CHART
Click chart to enlarge.
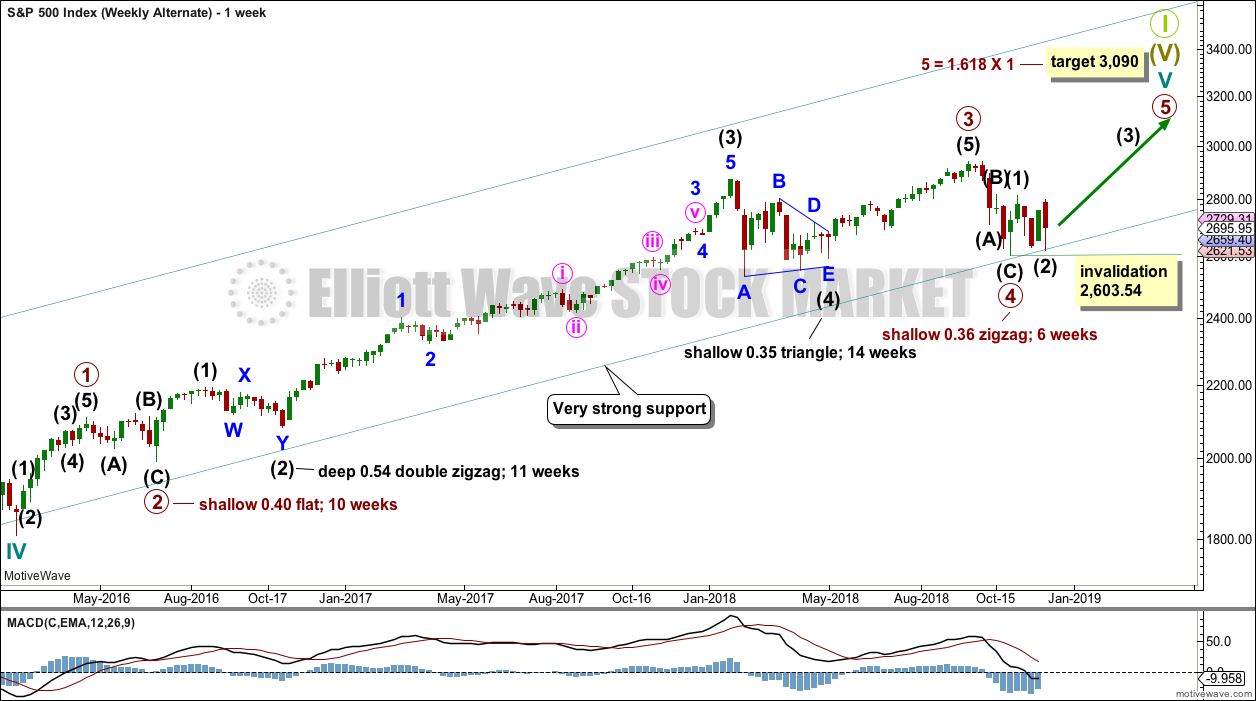
It remains possible that primary wave 4 may have been complete earlier as a single zigzag. This wave count still has reasonable proportion between primary waves 2 and 4: primary wave 2 as a flat correction lasted 10 weeks, and primary wave 4 as a zigzag may have lasted 6 weeks. Zigzags are usually quicker structures than flats, so this is acceptable.
Primary wave 5 may only subdivide as a five wave motive structure, either an impulse or an ending diagonal. Within both of these structures, intermediate wave (2) may not move beyond the start of intermediate wave (1) below 2,603.54.
DAILY CHART
Click chart to enlarge.
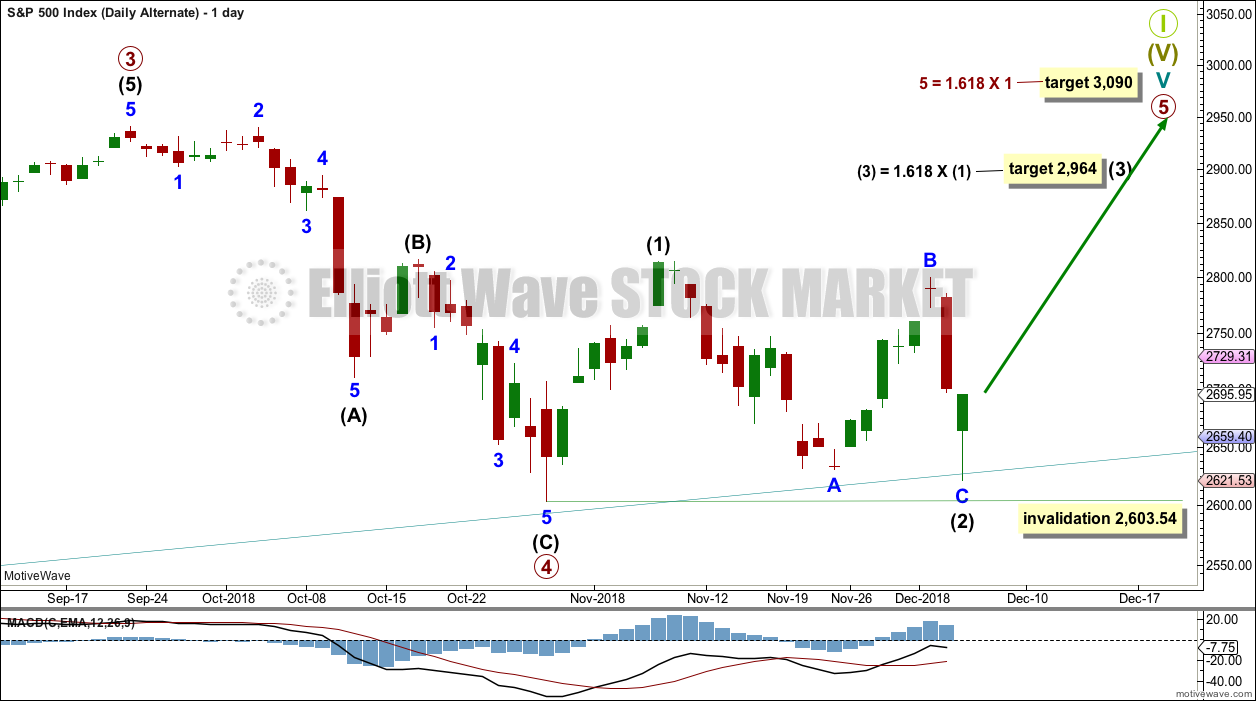
Within primary wave 5, intermediate waves (1) and (2) may be over. Intermediate wave (2) may have moved a little lower today to complete as either a zigzag or a regular flat correction (within it minor wave A may be seen as either a three wave zigzag or a five wave impulse).
Primary wave 5 may subdivide either as an impulse (more likely) or an ending diagonal (less likely). Intermediate wave (1) may be seen as either a five wave impulse or a three wave zigzag at lower time frames, and so at this stage primary wave 5 could be either an impulse or a diagonal.
For both an impulse and a diagonal, intermediate wave (2) may not move beyond the start of intermediate wave (1) below 2,603.54.
A target is calculated for intermediate wave (3) to exhibit the most common Fibonacci ratio to intermediate wave (1).
For both an impulse and a diagonal, intermediate wave (3) must move above the end of intermediate wave (1).
TECHNICAL ANALYSIS
WEEKLY CHART
Click chart to enlarge. Chart courtesy of et=”_blank”>StockCharts.com.
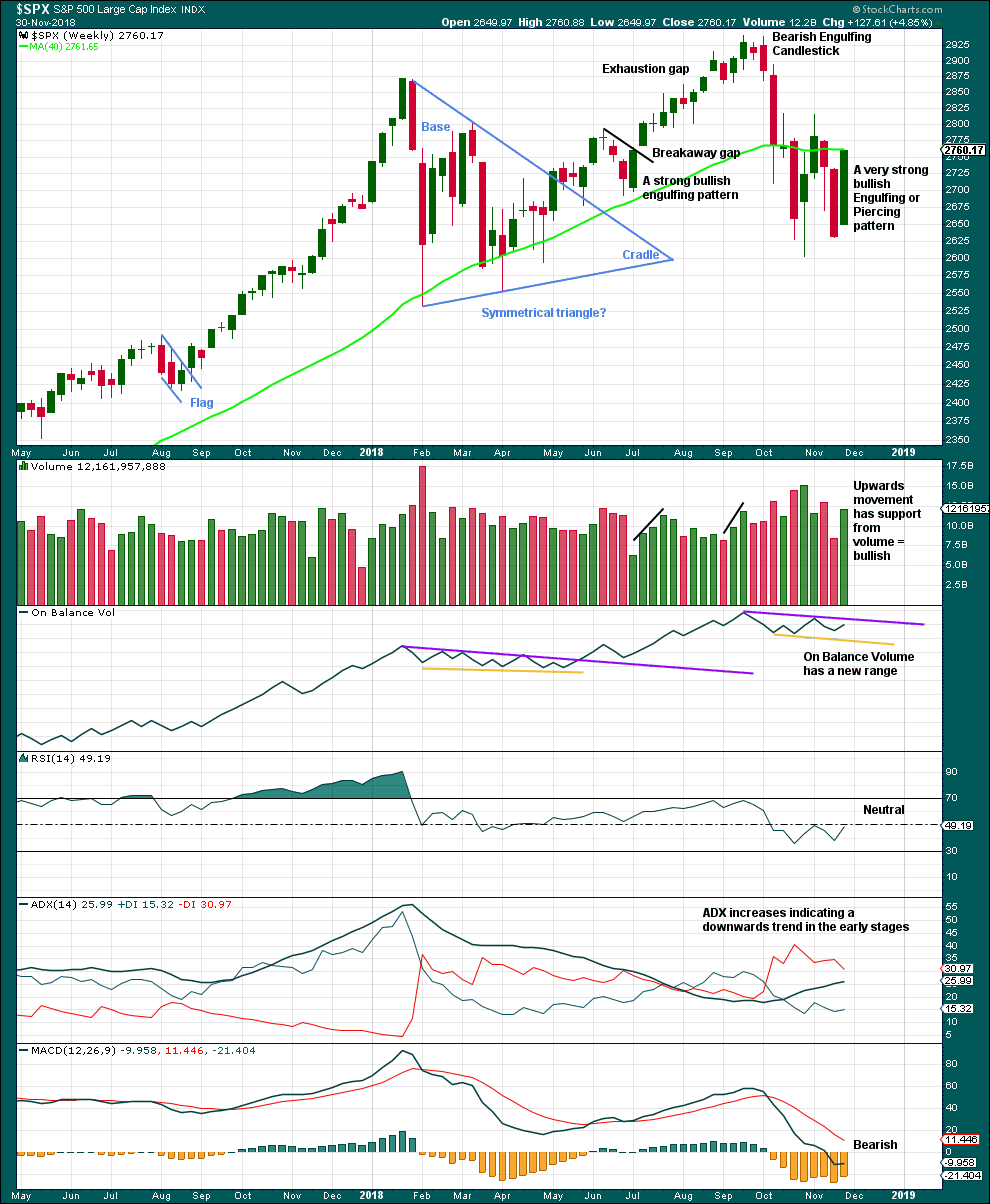
A Bullish Engulfing candlestick pattern requires the second candlestick to open below the low of the first candlestick. Last week’s candlestick opens above the low of last week’s candlestick. However, the most important aspect of an Engulfing pattern is the close of the second candlestick. Here, this week’s candlestick has closed well above the open of last week’s candlestick. This is very bullish.
This candlestick is neither correctly an engulfing nor piercing pattern, but the close is very bullish. It will be read as a bullish reversal pattern.
With support from volume, this weekly candlestick is very bullish. This supports the main Elliott wave count. This does not look like a B wave nor a D wave within a triangle.
DAILY CHART
Click chart to enlarge. Chart courtesy of StockCharts.com.
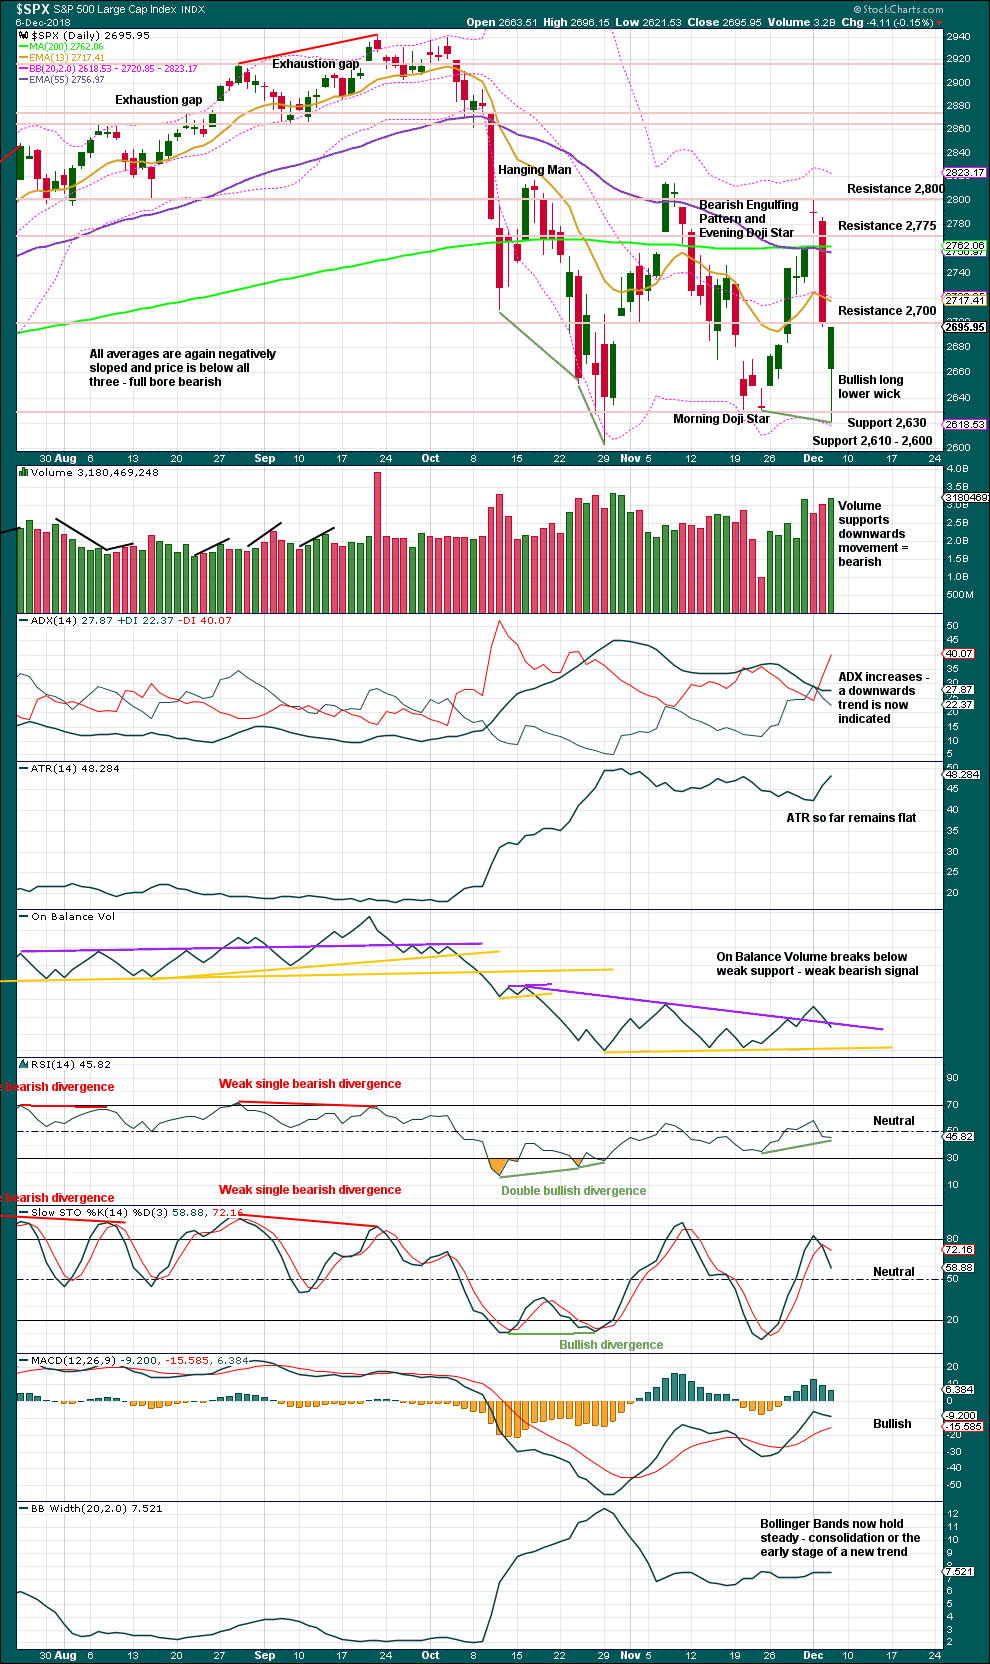
The lower edge of the teal trend channel is not shown on this chart, but it should be considered as part of this technical analysis. Expect that trend line to continue to provide support, until it does not.
Today the short-term volume profile is bearish, ADX is again bearish, On Balance Volume is bearish, and MACD is bearish. However, the short-term volume profile in current market conditions should not be given too much weight. The signal from On Balance Volume is only weak because the trend line breached had only three anchor points, and MACD is a lagging indicator. RSI exhibits single bullish divergence indicating weakness in price today.
More weight should be given to the teal trend line offering support and the long lower wick on today’s candlestick. The candlestick has closed green: bulls managed to rally at the end of the session to push price well above the open, and price has closed almost at the high of the session. Bulls remained in charge at the end of this session, and may also remain in charge when the next session opens.
BREADTH – AD LINE
WEEKLY CHART
Click chart to enlarge. Chart courtesy of StockCharts.com. So that colour blind members are included, bearish signals
will be noted with blue and bullish signals with yellow.
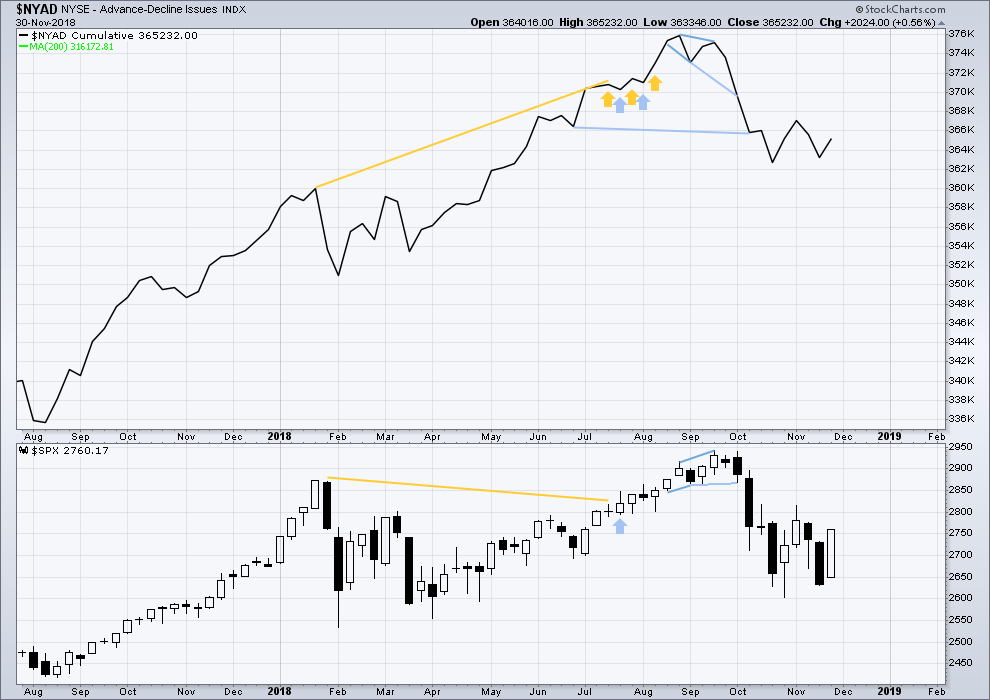
Both price and the AD line have moved higher last week. Upwards movement has support from rising market breadth. There is no short-term divergence.
All of small, mid and large caps are moving higher. Upwards movement has broad market support.
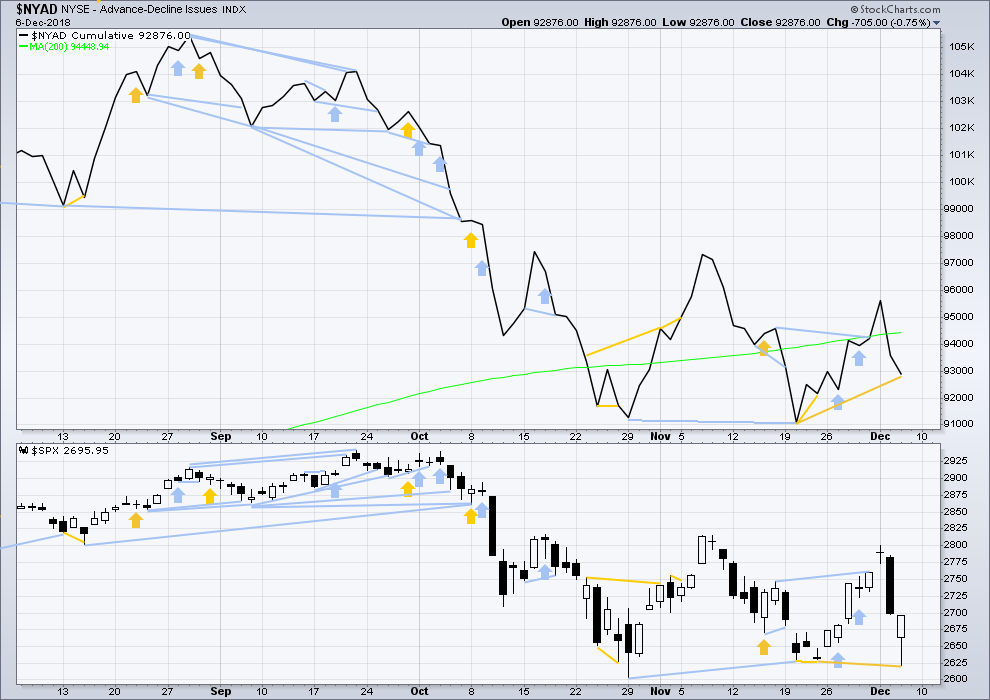
DAILY CHART
Click chart to enlarge. Chart courtesy of StockCharts.com. So that colour blind members are included, bearish signals
will be noted with blue and bullish signals with yellow.
There is normally 4-6 months divergence between price and market breadth prior to a full fledged bear market. This has been so for all major bear markets within the last 90 odd years. With no longer-term divergence yet at this point, any decline in price should be expected to be a pullback within an ongoing bull market and not necessarily the start of a bear market. New all time highs from the AD line on the 29th of August means that the beginning of any bear market may be at the end of December 2018, but it may of course be a lot longer than that.
Breadth should be read as a leading indicator.
Today price has made a new low below the 20th of November, but the AD line has not made a corresponding new low. Downwards movement today for price does not have support from a corresponding decline in market breadth. This divergence is bullish.
VOLATILITY – INVERTED VIX CHART
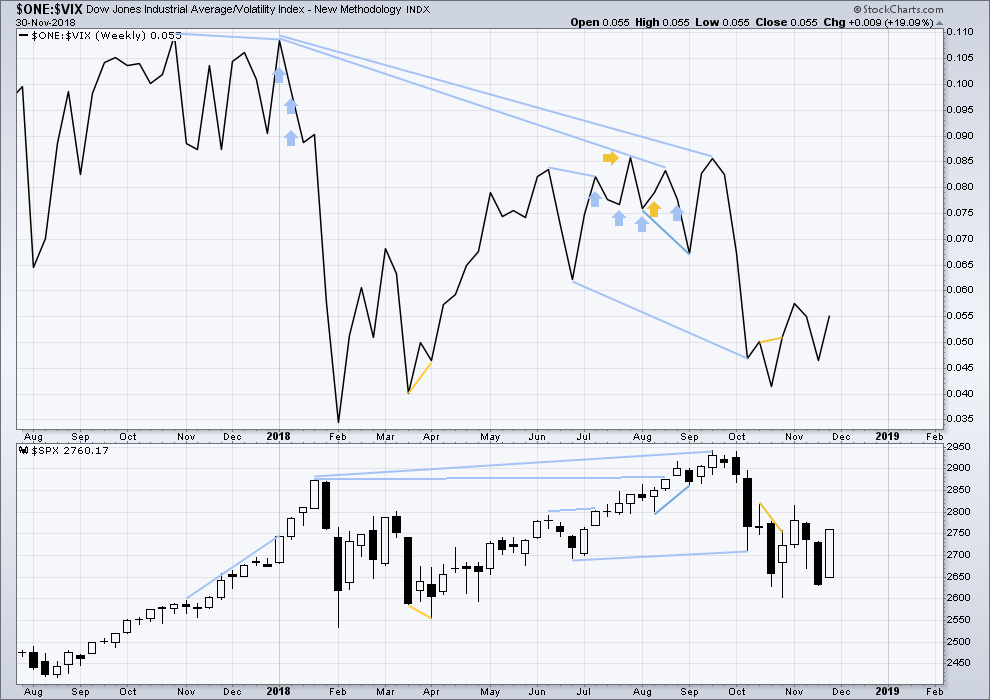
WEEKLY CHART
Click chart to enlarge. Chart courtesy of StockCharts.com. So that colour blind members are included, bearish signals
will be noted with blue and bullish signals with yellow.
Both price and inverted VIX have moved higher this week. There is no short-term divergence.
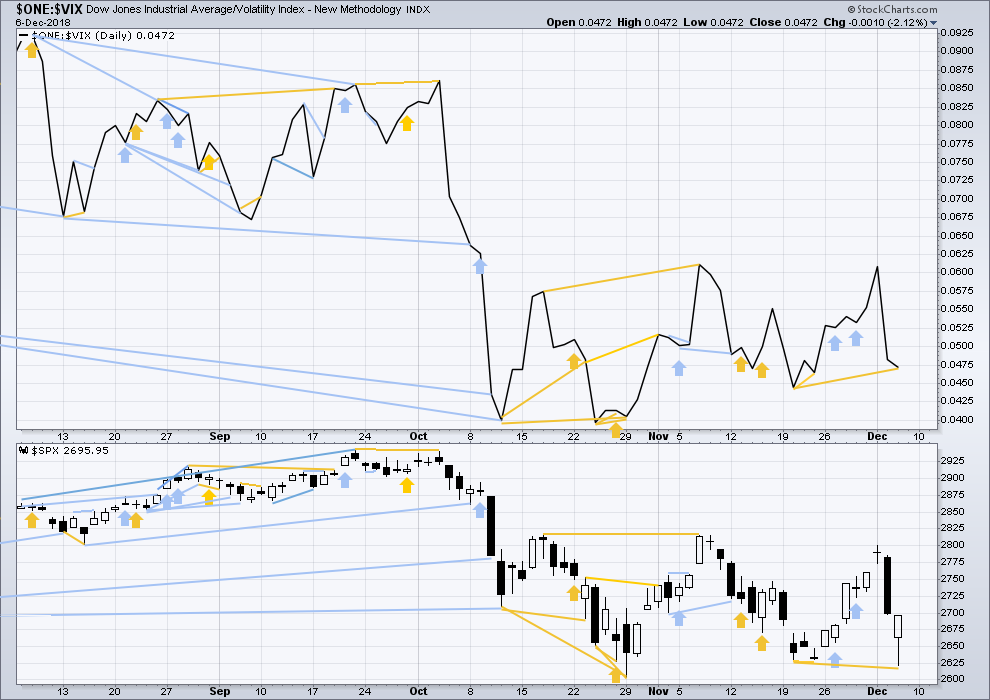
DAILY CHART
Click chart to enlarge. Chart courtesy of StockCharts.com. So that colour blind members are included, bearish signals
will be noted with blue and bullish signals with yellow.
Normally, volatility should decline as price moves higher and increase as price moves lower. This means that normally inverted VIX should move in the same direction as price.
Like the AD line, inverted VIX may now begin to accumulate instances of bearish signals or divergence as a fifth wave at three large degrees comes to an end.
Today price has made a new swing low below the prior low of the 20th of November, but inverted VIX has not. Downwards movement today does not come with a normal corresponding increase in VIX. This divergence is bullish.
DOW THEORY
The following lows need to be exceeded for Dow Theory to confirm the end of the bull market and a change to a bear market:
DJIA: 23,344.52.
DJT: 9,806.79.
S&P500: 2,532.69.
Nasdaq: 6,630.67.
Published @ 09:19 p.m. EST.
—
Careful risk management protects your trading account(s).
Follow my two Golden Rules:
1. Always trade with stops.
2. Risk only 1-5% of equity on any one trade.
Lara
Can you help me understand why the highs in late September cannot be the end of primary wave 5 …. if so this would explain the suspicions that we maybe already in a bear market. In other words I am wondering about the overall labeling of the weekly chart if it is correct.
If the bull market is over and a major bear market has just begun, then that would be the first time in nearly 100 years that there has been such short divergence (17 days only) between price and the AD line. In every bear market in the last almost 100 years there has been a minimum 4 months divergence.
Also, this chart.
The Elliott wave structure is possible to see cycle V complete, but only with great disproportion between intermediate waves (2) and (4).
This chart is published only in response to your question. I will only seriously consider it and publish it as part of my analysis if the teal trend line is breached by a full weekly candlestick below it.
While support remains there and has held so far, I’ll continue to expect it is most likely to hold.
VERY RARE setup -40% to +70.63%
DEFINITION of Breadth Thrust Indicator
A technical indicator used to ascertain market momentum. The breadth thrust indicator is computed by calculating the number of advancing issues on an exchange such as the NYSE divided by the total number of issues (advancing + declining) on it, and generating a 10-day moving average of this percentage. The indicator signals the start of a potential new bull market when it moves from a level of below 40% (indicating an oversold market) to above 61.5% within any 10-day period, a sentiment shift that occurs only rarely.
https://stockcharts.com/h-sc/ui?s=$NYADV:$NYTOT&p=D&yr=0&mn=3&dy=0&id=p14382618021
Good catch Karen. This is significant. Very bullish.
Skew during the downside move this week was incredible.
There were no buyers.
It became abundantly clear when the central banks stepped in and began buying every thing in sight, issuing in virtually a thousand point round trip in DJIA. Limit orders were simply not being filled, forcing prospective sellers to consistently lower ask, and resulting in significant downward price momentum. In virtually every other case we have seen this year, the violent arrest of downward momentum by central banks (and there is simply no other explanation for the sudden broad based bid that came into the market), the next day’s price action would inevitably result in the long tails not being violated by the next day’s price action. Friday came close.
In bear markets, normally bullish signals often fail to see bullish follow through. In my humble opinion, the jury is still out on what we see going forward. These markets remain in a most precarious position based on a plethora of other technical developments. They are now defending SPX 2620, apparently at all costs. A failure there would be noteworthy.Just my two pence!
Thank you… 2019 should be great and been looking at 278% Fib $3031.31 for a long time.
Certainly feels like a bear market, if anything. Classic technicals are looking rougher by the day. Can you say, bearish engulfing?
Let’s check prices on 12/14 $SPY options.
$278 calls: $0.15
$225 puts: $0.15
Things that make you go hmmmmmmmmmmmmmmmmmmmmmm.
Double bottom in.
Does it hold? I’d guess yes but…maybe not.
What a different a single day makes, eh? Lol!!!!!
Maybe a triple bottom on daily. 10/26, 11/23, 12/7
For full disclosure on this slow day, I have opened my long positions again in both short and long term accounts. Stops are set essentially below 2604 region.
It looks like we are going to print a bearish engulfing candle on the weekly…? Unless we get above 2650
Slow day??? SPX is off 2.2%, NDX down 3%, RUT down 2.2%, DJIA down 2.1%.
Oh I get it, you are joking…
SPX 2621 coming fast.
ps: NICE CALL VERNE.
-85 from HOD. These last two days are nuts.
Atleast I am getting a feel for what trading in a bear market will feel like.
Hourly chart updated:
The teal trend line is very close by today. I will continue to assume it will continue to provide support while price remains above it.
I’ve looked at minor 1 on the 5 minute and 1 minute charts.
It will subdivide as either a double zigzag or an impulse.
Minor 2 could be a complete double zigzag, or it could move a little lower to better test the teal trend line (not shown on the hourly chart, that one’s on the daily chart)
where would you say Mr Teal Trend line is …. ?
I think it’s roughly 2635 today, the current low (may not be by this time this is posted!).
Rat-a-tat-a-tat! The big money executing another clean out move today. Classic deep 2 (only…so far!).
Smells to me like a double bottom coming our way very soon now. Could rebound hard off that. Or not.
I have it at 2,630.45 today
NFLX sold off 5%, and is indicating a turn at overlapped 62% (270/268). I sold 230 puts for Jan. NFLX overall down from high at 420 to a recent low of 250. I think selling puts at 230 has exceptional +EV here.
Hey ari,
I have been thinking about the electrophysiology option for PVC’s. It might help you to know that my PVC burden is 0.2% which I understand is very or extremely light. I was told that at 20% burden, cardiologists become much more aggressive in treatment beyond medications because such a high burden can cause long term weakening of the heart.
If you have any thoughts, I’d love to hear them.
Thanks again,
Rodney
BTW you can email me directly, if you’d prefer, at rodneymruk at gmail dot com.
I would strongly consider taking magnesium turate on a daily basis. 600-800mg divides between 2 doses on a daily basis. Take it with some food.
Otherwise, I would follow the cardio advice…
Hope this helps 🙂
Thanks and will do.
Pivot failure at SPX 2700 significant.
Trade carefully!
Could be. Unless this is a nominal low degree ii. In which case, a turn at 2655 (62%) is likely, or if not, then 2640 (78%).
Third down….
Sold TSLA in AM spike (again ). I’m not saying this chart is correct…. but I have been able to rinse and repeat …. good luck
Yea…heck of a range trade opportunity there! I bought me a “cheap” March put at 320. I like it.
2732 is a likely stall/turn spot, 62% retrace of down move and lots of resistance.
If it makes it past 2700…
Key question is, is this an ABC retracement or the start of a much bigger impulse wave?
It will be fascinating to see if 2700 turns the market back down tomorrow (into a lower degree ii?) or not. And of course if it does…does today’s low hold?
I expect it does turn, backs and fills in some kind of ii…then launches in a strong iii up sometimes early next week. We will see, should be fun.
My trend indicators is showing SPX neutral at the monthly, mild down at the weekly, mild down at the daily, and mild down at the hourly. (top left is monthly, then clockwise through lower timeframes). Only at the 5 minute (not shown) does price show a strong up trend. Of course, that’s all “lagging” analysis. What I want to see of course (since I am long) is migration up through the timeframes of a strong uptrend reading…
First ……. but not foremost
Foiled!!!