
A breach of the small channel on the hourly Elliott wave chart in the third hour of today’s session saw an expectation that price may continue lower to either 2,736 or 2,696. A close at 2,700 mostly fits this expectation.
Summary: Minor wave 2 may continue for another one to few days. It may end a little below the 0.618 Fibonacci ratio of minor wave 1. Minor wave 2 may not move beyond the start of minor wave 1 below 2,631.09.
A mid-term target for the next wave up is 2,973. About this target a multi-week consolidation may begin for intermediate wave (4).
The main wave count now expects this bull market to end at the end of December 2018 at the earliest, and possibly in March 2019, at 3,090.
The last gap may provide support at 2,682.53.
New updates to this analysis are in bold.
The biggest picture, Grand Super Cycle analysis, is here.
Last published monthly chart is here, video is here.
MAIN ELLIOTT WAVE COUNT
WEEKLY CHART
Click chart to enlarge.
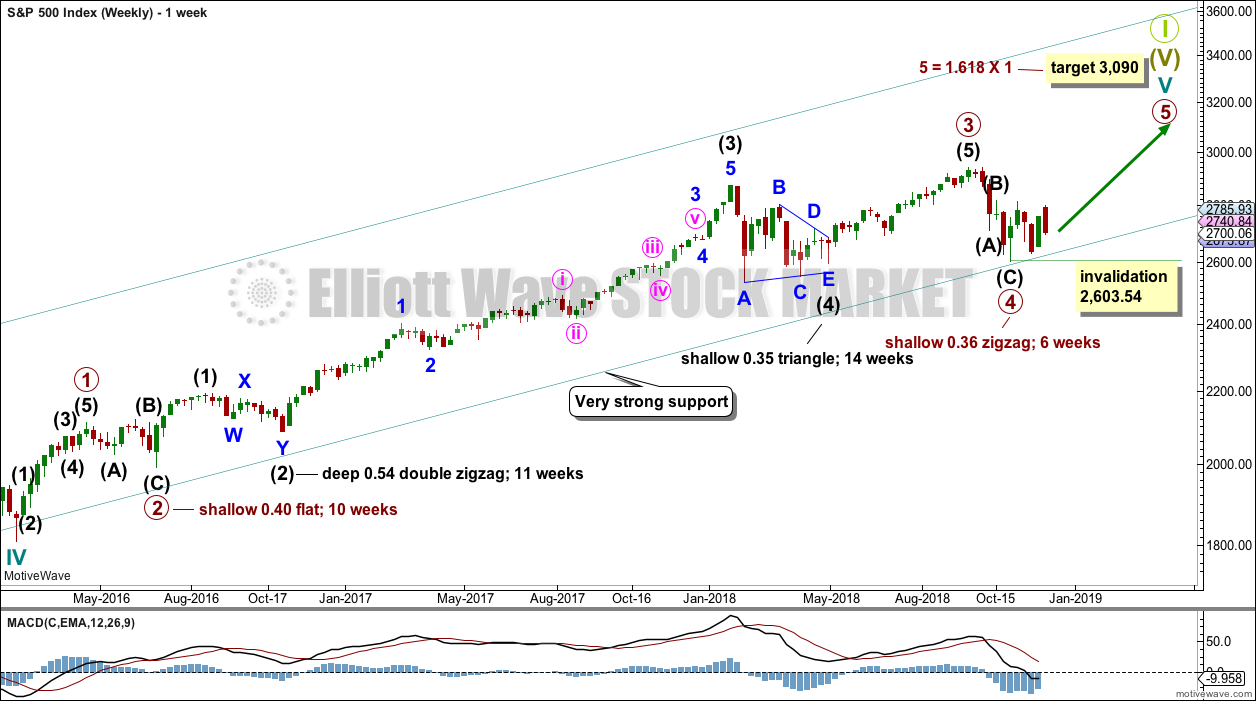
Cycle wave V must complete as a five structure, which should look clear at the weekly chart level and also at the monthly chart level. It may only be an impulse or ending diagonal. It is clear it is an impulse.
Within primary wave 3, there is perfect alternation and excellent proportion between intermediate waves (2) and (4).
Primary wave 4 may have found very strong support about the lower edge of the teal channel. This channel is copied over from the monthly chart and contains the entire bull market since its beginning in March 2009. While Super Cycle wave (V) is incomplete, this channel should not be breached at the weekly chart level.
Draw the teal channel from the high of cycle wave I at 1,343.80 on the week beginning 3rd July 2011, to the high of cycle wave III at 2,079.46 on the week beginning 30th November 2014, and place a parallel copy on the low of cycle wave II at 1,074.77 on the week beginning 2nd October 2011. Draw this chart on a semi-log scale. A small overshoot, like that seen at the end of cycle wave IV, would be entirely acceptable. If price does move below the channel, then it should reverse reasonably quickly.
The proportion between primary waves 2 and 4 is reasonable. Flat corrections tend to be longer lasting structures than zigzags. There would be perfect alternation in structure and inadequate alternation in depth. This is acceptable.
This wave count has the right look at the monthly chart level.
If primary wave 5 ends at or after the end of December 2018 and the AD line fails to make new all time highs, there would then be the minimum required four months of bearish divergence between price and the AD line. If this happens, then the conditions for the end of this bull market would be in place.
A target is calculated for primary wave 5 to end. If primary wave 5 were to be only equal in length with primary wave 1, then it would be truncated. A truncated primary wave 5 would be unlikely as then there could be no bearish divergence with the AD line. The next Fibonacci ratio in the sequence is used to calculate a target for primary wave 5.
Within primary wave 5, no second wave correction may move beyond the start of its first wave below 2,603.54.
DAILY CHART
Click chart to enlarge.
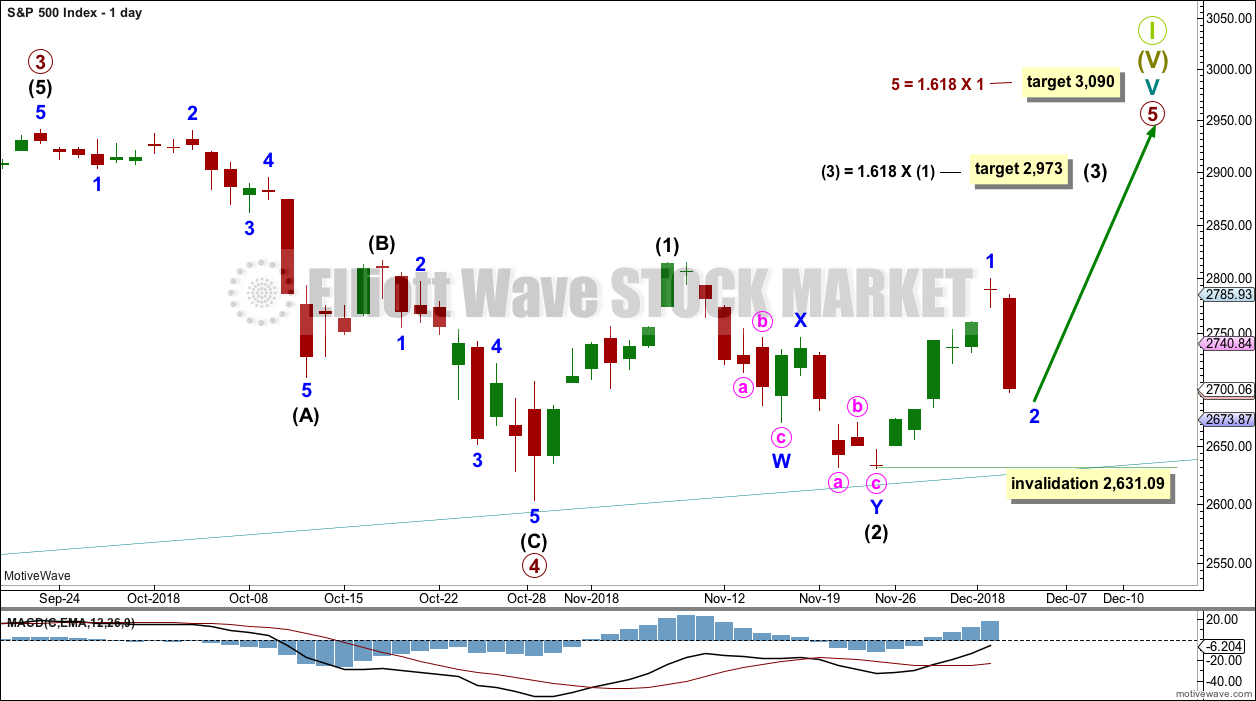
Within primary wave 5, intermediate waves (1) and (2) may be over. Within intermediate wave (3), minor wave 2 may not move beyond the start of minor wave 1 below 2,631.09.
Primary wave 5 may subdivide either as an impulse (more likely) or an ending diagonal (less likely). Intermediate wave (1) may be seen as either a five wave impulse or a three wave zigzag at lower time frames, and so at this stage primary wave 5 could be either an impulse or a diagonal.
For both an impulse and a diagonal, intermediate wave (3) must move above the end of intermediate wave (1).
Primary wave 5 at its end may be expected to exhibit reasonable weakness. At its end, it should exhibit a minimum of 4 months bearish divergence with the AD line, it may exhibit bearish divergence between price and RSI and Stochastics, and it may lack support from volume.
HOURLY CHART
Click chart to enlarge.
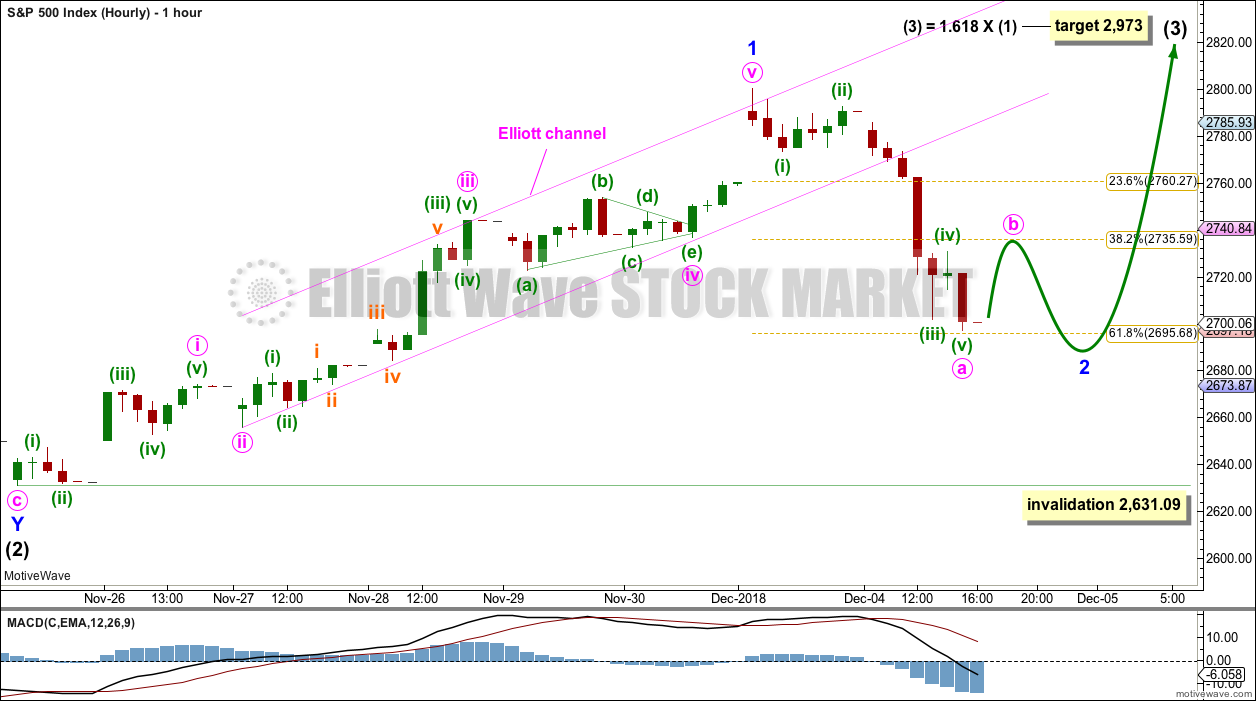
Intermediate wave (3) may only subdivide as an impulse if primary wave 5 subdivides as an impulse.
Within intermediate wave (3), minor wave 1 is now complete. Minor wave 2 may be incomplete.
A channel is drawn about minor wave 1 using Elliott’s second technique. A clear and strong breach of the lower edge of the channel in the third hour of this last session indicated minor wave 1 was over and minor wave 2 had then begun.
Minor wave 2 may be subdividing as a zigzag. So far downwards movement looks best as a five wave structure that may be minute wave a. Minute wave b may bounce up a little higher and may find resistance about the 0.382 Fibonacci ratio. Thereafter, minute wave c may end below the end of minute wave a.
When minute wave b is complete and the starting point for minute wave c is known, then a target may be calculated for minor wave 2 to end using the Fibonacci ratios between minute waves a and c. This cannot be done yet.
Minor wave 2 may not move beyond the start of minor wave 1 below 2,631.09.
ALTERNATE ELLIOTT WAVE COUNT
WEEKLY CHART
Click chart to enlarge.
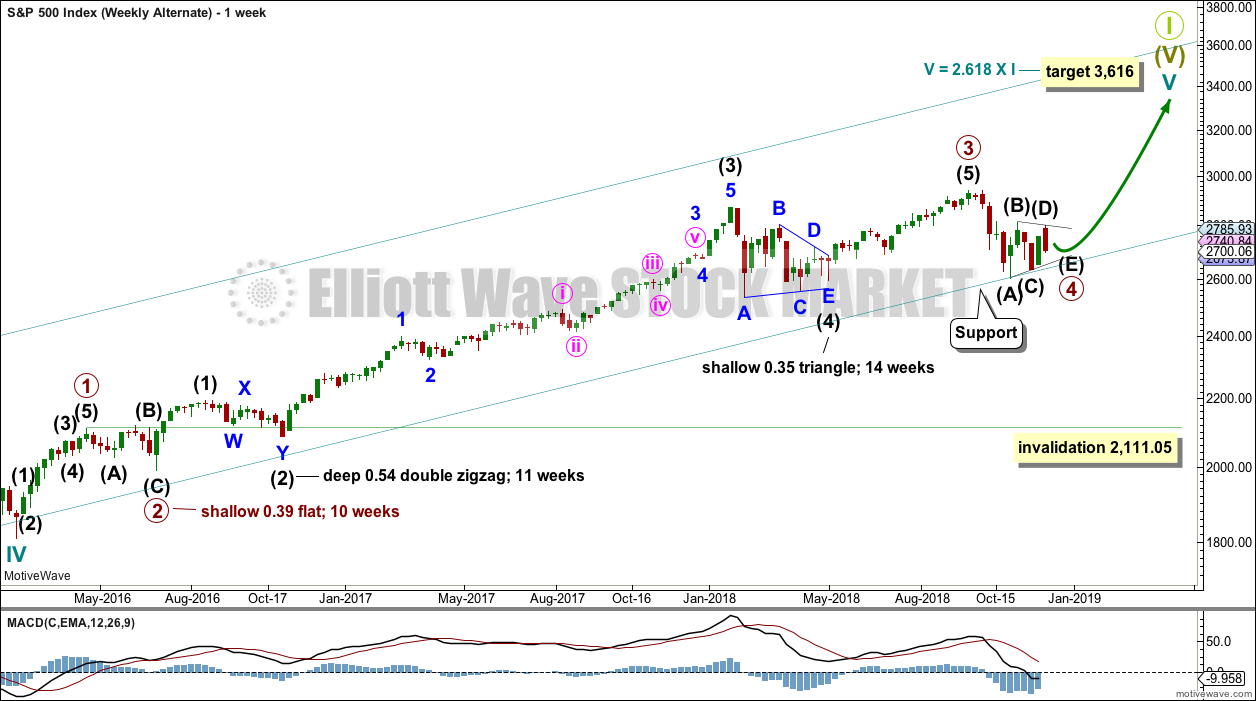
It is also still possible that primary wave 4 may be incomplete. However, at this stage, if primary wave 4 is incomplete and continues for a further several weeks, it would now be out of proportion to primary wave 2. Primary wave 2 lasted 10 weeks. If primary wave 4 is incomplete, then so far it has lasted 10 weeks.
If primary wave 4 is incomplete, then the most likely structures at this stage may be a zigzag, triangle or combination. A double zigzag and flat, and a single zigzag, are discarded based upon the requirement for a large overshoot of the teal trend channel, and poor proportion.
Primary wave 4 may not move into primary wave 1 price territory below 2,111.05.
For this alternate wave count, when primary wave 4 may be complete, then the final target may be calculated at primary degree. At that stage, there may be two targets, or the target may widen to a small zone.
DAILY CHART – TRIANGLE
Click chart to enlarge.
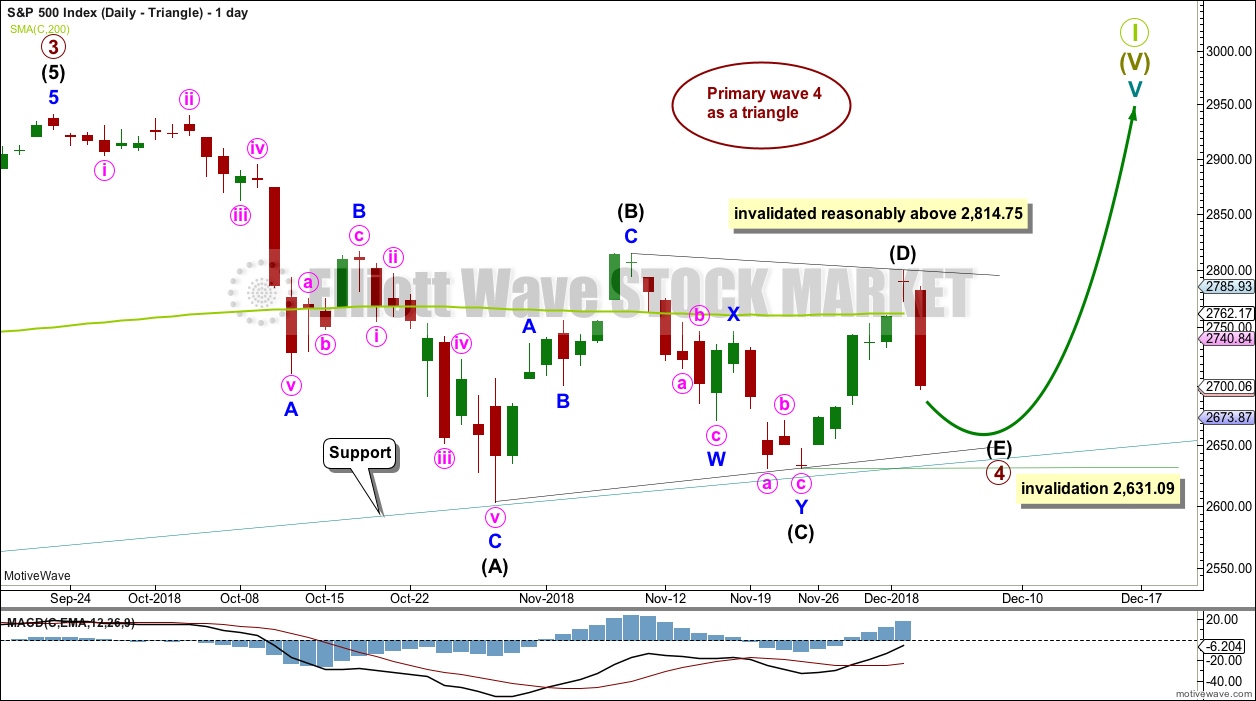
If primary wave 4 unfolds as a triangle, it would have perfect alternation with the regular flat correction of primary wave 2. It would also continue to find support about the lower edge of the teal trend channel. Triangles are fairly common structures for fourth waves.
The triangle is relabelled to see intermediate waves (A), (B) and (C) now all complete. Intermediate wave (B) is shorter than B waves of triangles usually are; this gives the triangle an odd look. However, considering the duration of primary wave 4 so far, this labelling now makes more sense.
Intermediate wave (C) may have completed as a double zigzag. This is the most common triangle sub-wave to subdivide as a multiple.
Price has bounced up off the lower edge of the teal trend channel.
If the triangle is a regular contracting triangle, which is the most common type, then intermediate wave (D) may not move beyond the end of intermediate wave (B) above 2,814.75.
If the triangle is a regular barrier triangle, then intermediate wave (D) may end about the same level as intermediate wave (B). As long as the (B)-(D) trend line remains essentially flat a triangle would remain valid. This invalidation point is not exact; intermediate wave (D) can end very slightly above 2,814.75.
Intermediate wave (D) should now be complete. Intermediate wave (E) may be underway.
Intermediate wave (E) may not move beyond the end of intermediate wave (C) below 2,631.09.
This wave count could now see a triangle complete this week, which would see primary wave 4 last a total of 11 weeks. This would be in proportion to the 10 week duration for primary wave 2, and reasonably close to the 14 weeks of intermediate wave (4). The wave count would have the right look.
This wave count would also see the lower edge of the teal trend channel continue to provide support. This would give the wave count the right look at the weekly and monthly chart levels.
DAILY CHART – COMBINATION
Click chart to enlarge.
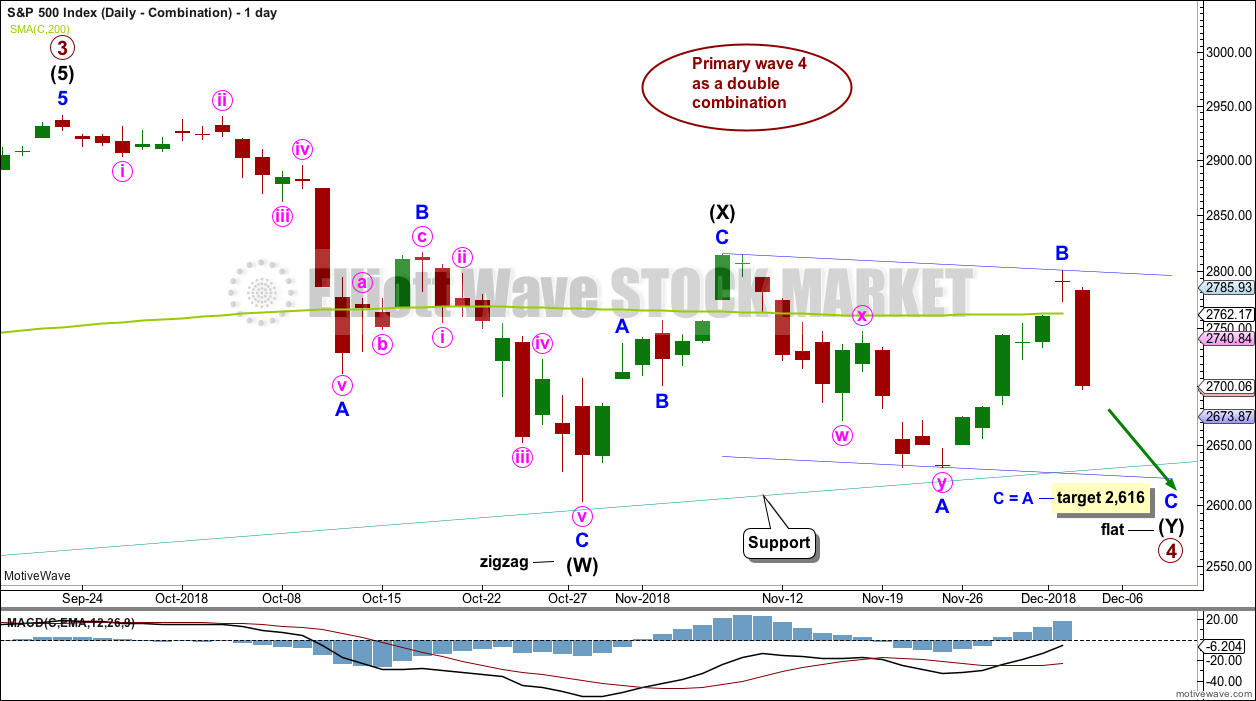
This wave count is judged to have only a slightly lower probability than the triangle. If this wave count is correct, then primary wave 4 may be a few weeks longer in duration than primary wave 2. This wave count now has a problem of proportion.
Primary wave 4 may be unfolding as a double combination. The first structure in the double may be a complete zigzag labelled intermediate wave (W). The double may be joined by a three in the opposite direction labelled intermediate wave (X). Intermediate wave (X) may be complete as a single zigzag; it is deep at 0.63 the length of intermediate wave (W), which looks reasonable.
Intermediate wave (Y) would most likely be a flat correction, which should subdivide 3-3-5.
Within the flat correction of intermediate wave (Y), minor wave B is 0.92 the length of minor wave A. A regular flat correction may be unfolding for intermediate wave (Y).
The most common Fibonacci ratio for minor wave C within a regular flat correction would be equality in length with minor wave A. This gives a target at 2,616. This target would now expect only a small overshoot of the teal trend channel, which would be acceptable. However, this is the only Elliott wave count that expects to see an overshoot of the teal trend channel, so it must be judged to have the lowest probability.
TECHNICAL ANALYSIS
WEEKLY CHART
Click chart to enlarge. Chart courtesy of et=”_blank”>StockCharts.com.
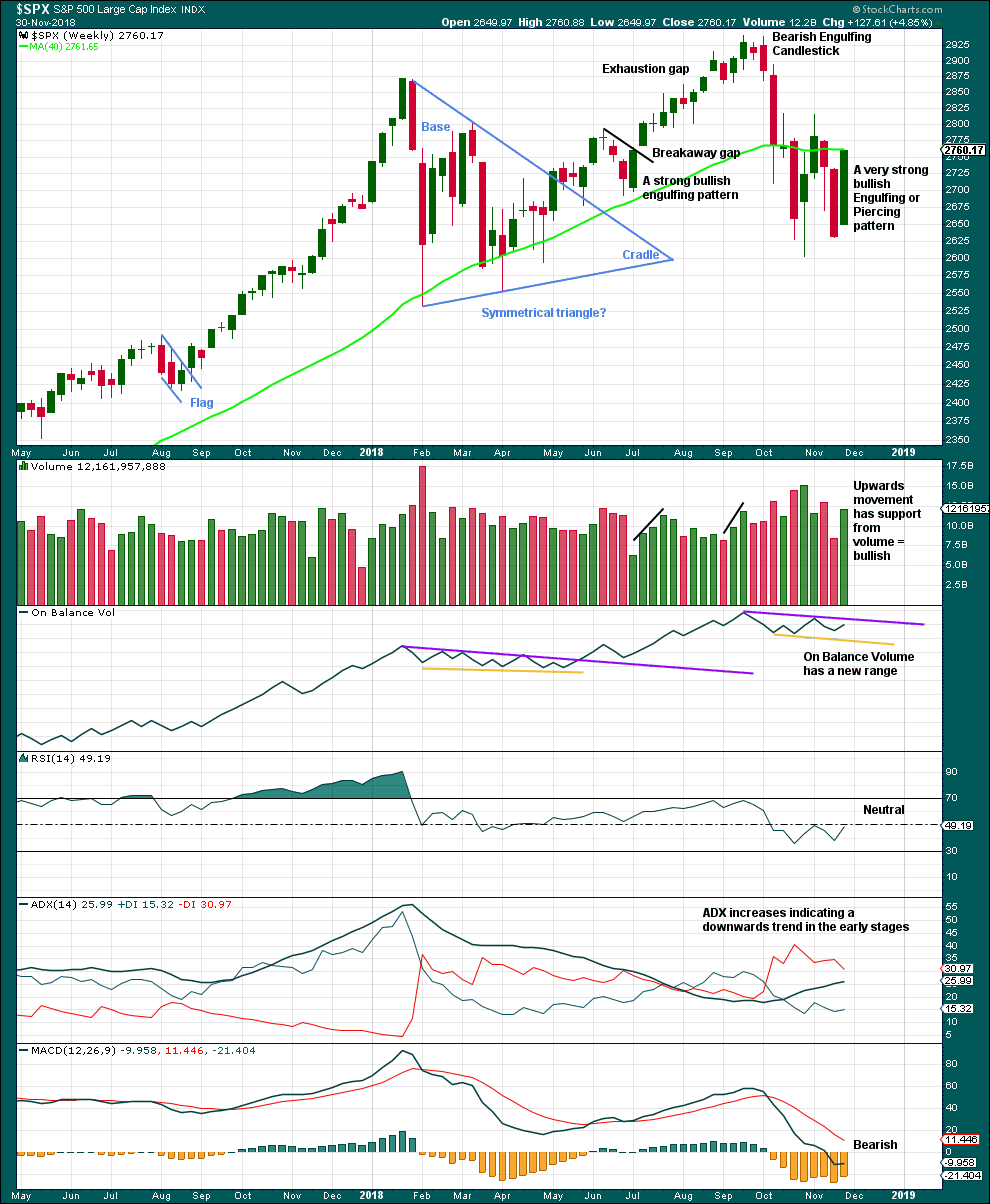
A Bullish Engulfing candlestick pattern requires the second candlestick to open below the low of the first candlestick. Last week’s candlestick opens above the low of last week’s candlestick. However, the most important aspect of an Engulfing pattern is the close of the second candlestick. Here, this week’s candlestick has closed well above the open of last week’s candlestick. This is very bullish.
This candlestick is neither correctly an engulfing nor piercing pattern, but the close is very bullish. It will be read as a bullish reversal pattern.
With support from volume, this weekly candlestick is very bullish. This supports the main Elliott wave count. This does not look like a B wave nor a D wave within a triangle.
DAILY CHART
Click chart to enlarge. Chart courtesy of StockCharts.com.
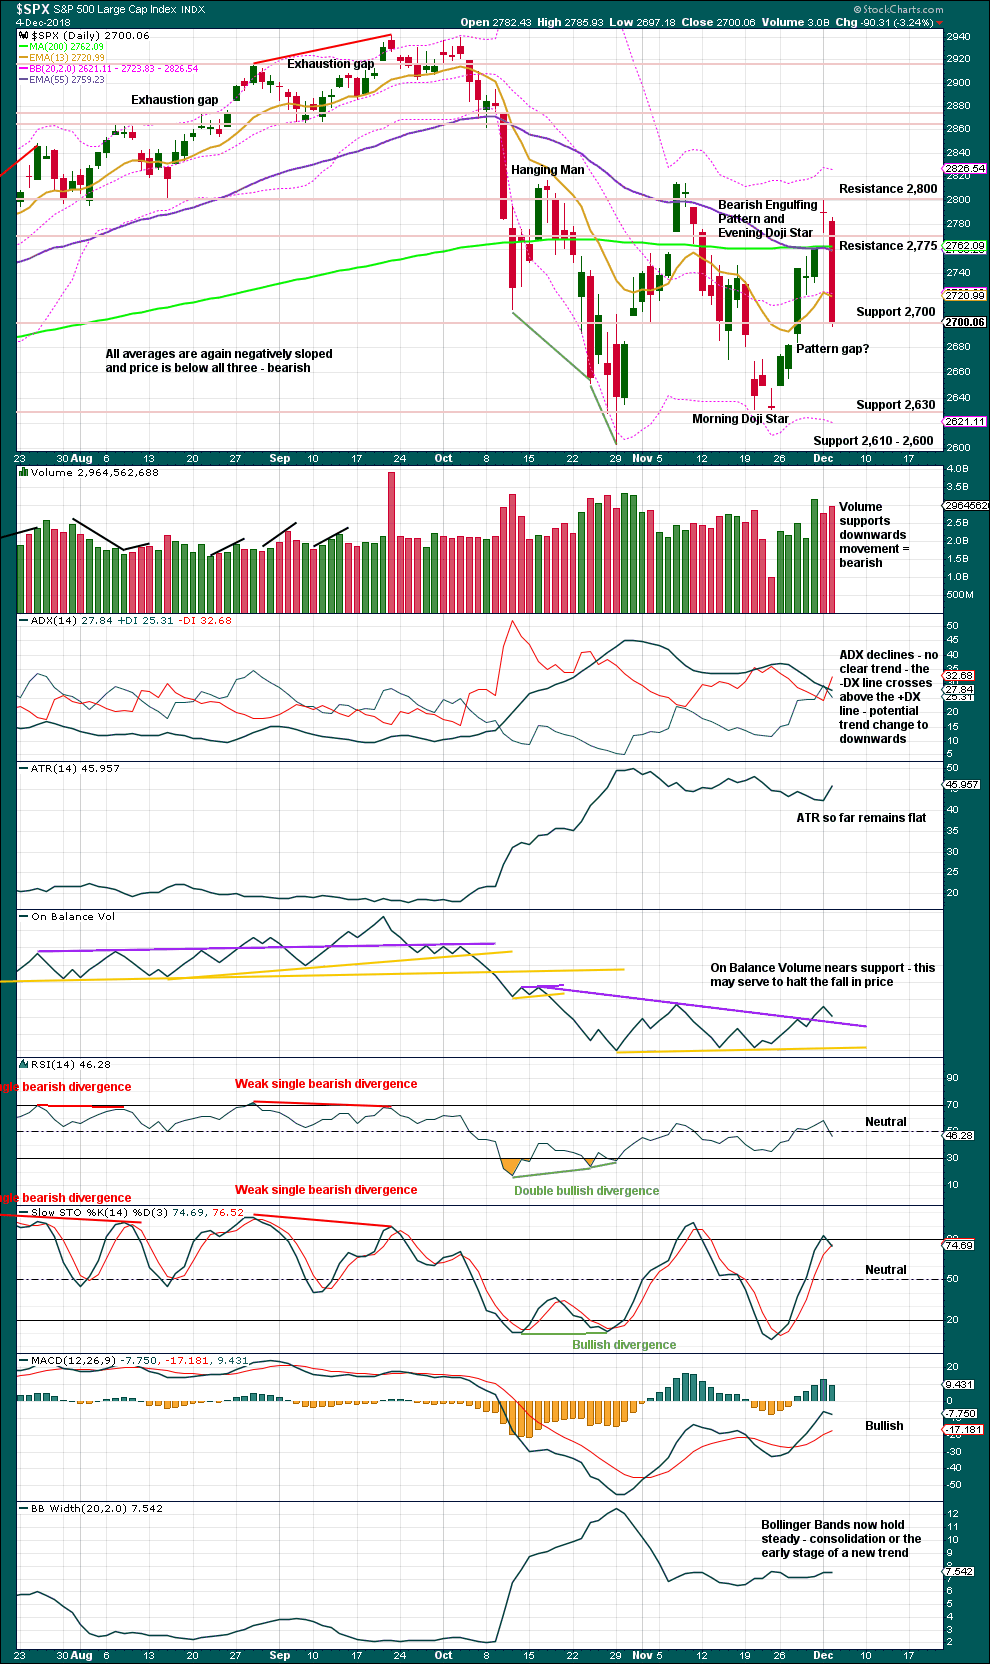
The lower edge of the teal trend channel is not shown on this chart, but it should be considered as part of this technical analysis. Expect that trend line to continue to provide support, until it does not.
A strong bearish candlestick today completes an Evening Doji Star and a strong Bearish Engulfing pattern. While this is very bearish, it also comes within the larger context of a consolidation. There is identifiable resistance now about 2,800 – 2,815, and support below is about 2,630 – 2,600.
The bearish candlestick reversal patterns today make no comment on how far or for how long the next swing may be. Look now for strong support below at the identified zone.
Support today from volume is bearish, and the lack of a lower wick on today’s candlestick suggests more downwards movement tomorrow.
BREADTH – AD LINE
WEEKLY CHART
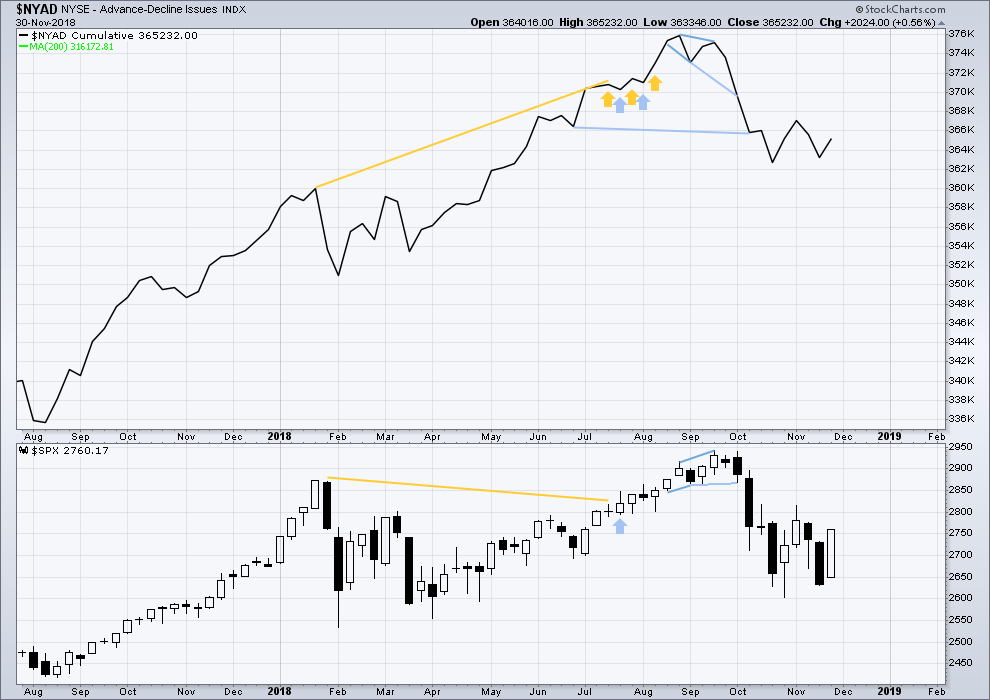
Click chart to enlarge. Chart courtesy of StockCharts.com. So that colour blind members are included, bearish signals
will be noted with blue and bullish signals with yellow.
Both price and the AD line have moved higher last week. Upwards movement has support from rising market breadth. There is no short-term divergence.
All of small, mid and large caps are moving higher. Upwards movement has broad market support.
DAILY CHART
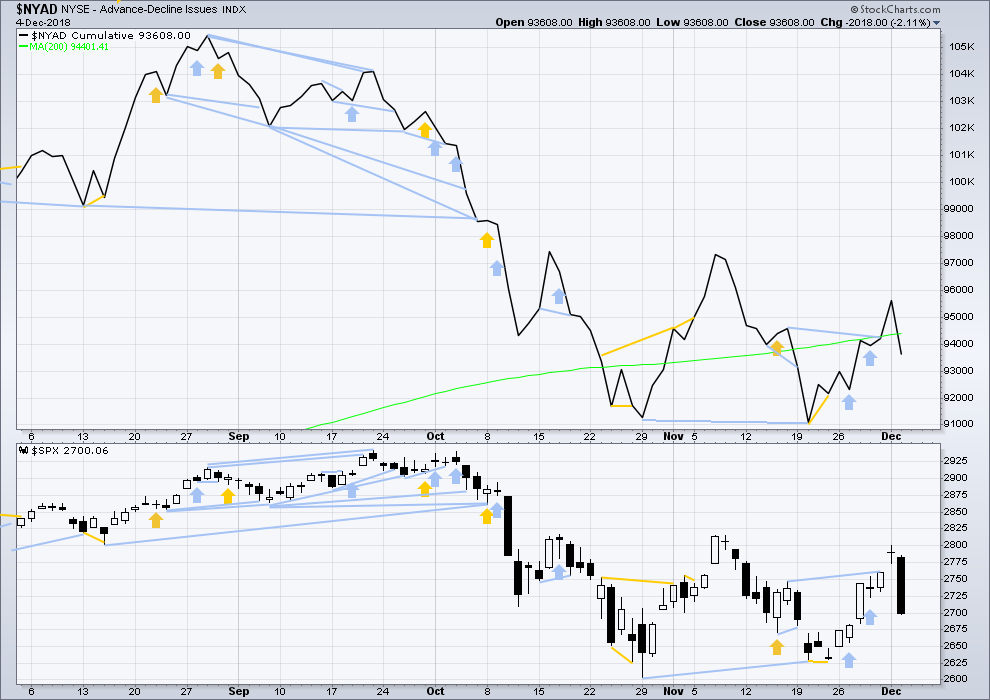
Click chart to enlarge. Chart courtesy of StockCharts.com. So that colour blind members are included, bearish signals
will be noted with blue and bullish signals with yellow.
There is normally 4-6 months divergence between price and market breadth prior to a full fledged bear market. This has been so for all major bear markets within the last 90 odd years. With no longer-term divergence yet at this point, any decline in price should be expected to be a pullback within an ongoing bull market and not necessarily the start of a bear market. New all time highs from the AD line on the 29th of August means that the beginning of any bear market may be at the end of December 2018, but it may of course be a lot longer than that.
Breadth should be read as a leading indicator.
Downwards movement today comes with a normal decline in market breadth. Breadth is not falling any faster than price. There is no divergence.
VOLATILITY – INVERTED VIX CHART
WEEKLY CHART
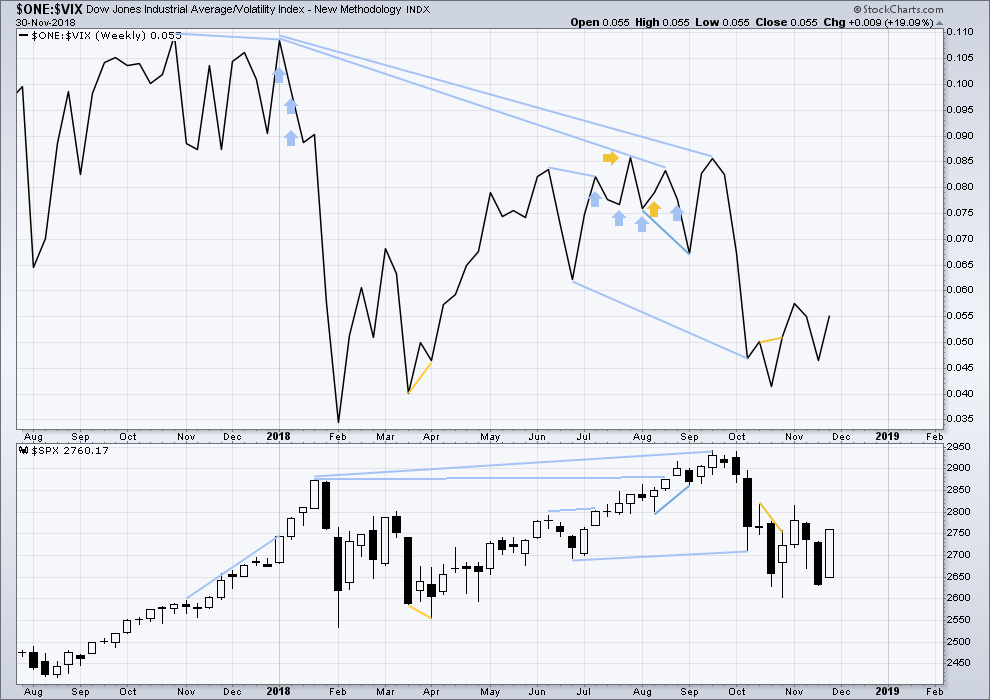
Click chart to enlarge. Chart courtesy of StockCharts.com. So that colour blind members are included, bearish signals
will be noted with blue and bullish signals with yellow.
Both price and inverted VIX have moved higher this week. There is no short-term divergence.
DAILY CHART
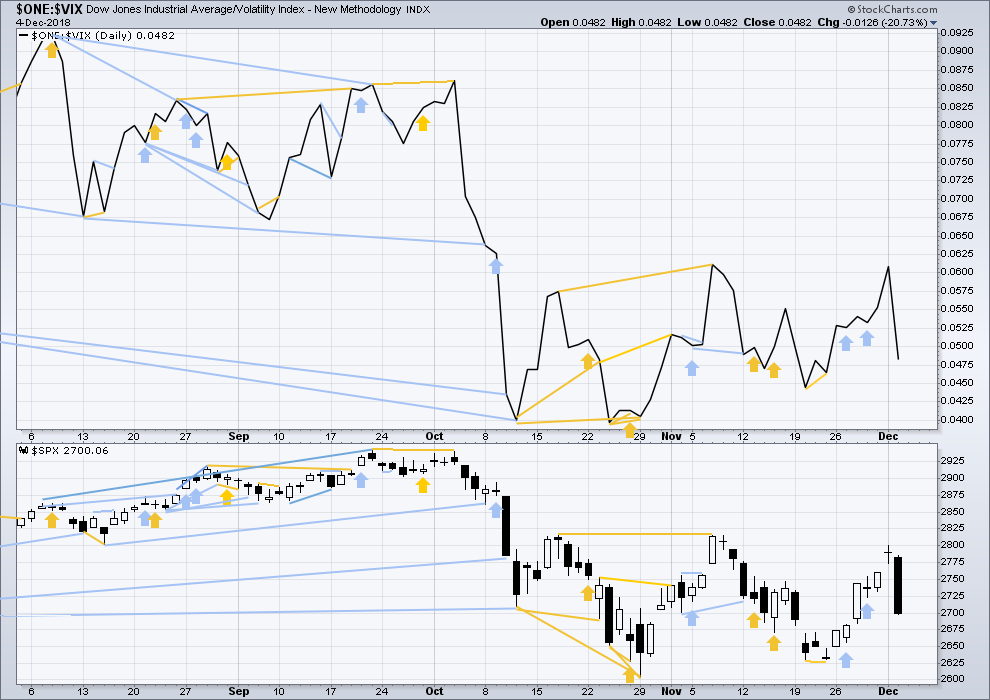
Click chart to enlarge. Chart courtesy of StockCharts.com. So that colour blind members are included, bearish signals
will be noted with blue and bullish signals with yellow.
Normally, volatility should decline as price moves higher and increase as price moves lower. This means that normally inverted VIX should move in the same direction as price.
Like the AD line, inverted VIX may now begin to accumulate instances of bearish signals or divergence as a fifth wave at three large degrees comes to an end.
Downwards movement today comes with a normal decline in inverted VIX. There is no divergence.
DOW THEORY
The following lows need to be exceeded for Dow Theory to confirm the end of the bull market and a change to a bear market:
DJIA: 23,344.52.
DJT: 9,806.79.
S&P500: 2,532.69.
Nasdaq: 6,630.67.
Published @ 08:00 p.m. EST.
—
Careful risk management protects your trading account(s).
Follow my two Golden Rules:
1. Always trade with stops.
2. Risk only 1-5% of equity on any one trade.
I won’t be around the next few days but we should get at the very least a nice bounce.
At the risk of sounding like a broken record I shall humbly suggest the pivots will tell the tale of tape, to borrow from Octagon jargon. A strong move back above 2700 will argue for near term bullish outcomes. If it proves resistance, or the bulls retake it intra-day but fail to close price above it, I think the Feb low will become a magnet.
Have a wonderful week-end everyone!
-80 with the gap down and bought all the way back. Wow. What a day. Feel like I need a vacation.
An hourly chart now for you:
This is for the combination wave count. It also fits the new labelling for intermediate (2) as published just below.
Minor C fits nicely as a five wave impulse.
If P4 is over today, a new target is calculated for P5 to end.
Your chart does not show channel lines for Minor C. But I think we are in the process of breaking out of the upper line. First sign of confidence in the count. A breakout and retest is always a good low risk entry. If the count is correct, once we move up and away, we will have a profitable position for a long time, many days and weeks. Nice.
One more thing other than visiting an electrophysiologist (Aka EP): you can buy magnesium taurate from the vitamin shoppe, or online and take 400-800mg of this daily. Works wonders for PVC’s and even other heart arrhythmias. Much better than other formulas of magnesium
🙂
Thanks again ari. Ya never know what you can find or who can help on this blog!
Yeah, thanks Ari for your Dr advice.
Rodney, Ari helped me with my insomnia too a while back.
Ari, your suggestion of Melatonin was spot on. I found a source here in NZ, and now I’ve had months of almost perfect sleep every night. It’s changed my world!
Very happy to hear that Lara. Melatonin acts as an antioxidant for the brain. Not only does help sleep, but helps your brain inflammation in general.
I’m happy it worked well for yah…
Updated daily chart:
I may switch this to an alternate and make the combination count for P4 just updated below the main wave count.
Either way, both ideas see a flat correction ending today. That means a five down should be observable on the hourly chart, labelled minor wave C on both counts.
Because both see it as minor wave C, I’ll publish only one hourly chart.
Intermediate (2) fits nicely as a regular flat.
The reason why I might swap this over to an alternate is the look of intermediate (1). It looks like a three, better than it does a five, on this time frame.
Both counts expect a low is in, both counts expect support at the teal trend line to hold.
I’m putting this daily chart up here because I really really want members to focus right now on the bigger picture.
This wave count looks very good indeed today. Primary 4 could be over at today’s low.
There is a very small overshoot of the teal channel on the daily chart now. This has provided support multiple times and has been held for over 10 years. This line has very strong technical significance. Expect support here is most likely to hold.
A more bearish wave count should only be considered if that trend line is breached.
Assume support holds, until it does not. Seems like a nice calm and logical approach to me.
The subdivisions of this wave count now fit very well indeed. Minor wave C on the hourly chart looks like a very nice five wave impulse.
So far today’s candlestick has a long lower wick. Let’s see how it closes. For it to be a hammer reversal pattern the lower wick needs to be a minimum 2X the length of the real body. The lower wick is bullish.
Thanks Lara. I really like this combination count because it gives much more time to the completion of Primary 4. The previously thought completion of a zig-zag ending in October seemed too short. But what do I know?
May be entering long positions again as soon as today.
It was short, yes, but only 4 weeks shorter than P2. Zigzags are often quite a bit quicker than flats.
But this one has better subdivisions, in that it has a better look at the daily chart level.
That’s the model that rings true to me. Thank you Lara!
We’ve got the fear, we’ve got the retest of the teal line, we’ve got complete structure, and we are reduced to one very high probability model (I acknowledge there’s an alternate where P4 completed in Oct…same general set up at this point though!).
That’s action time in my book, as confirmation and buy triggers start firing. High leverage set ups like this don’t come along every day, week, or month.
My $0.02, not trading advice, and as they say in that Clint Eastwood boxing movie about the female boxer, “always protect yourself!”. Verne seems to think price is going run to 2700 and tank again, and that’s something to very much keep in mind.
Anyone think today was the end of intermediate 2? That’s what I think is happening.
I do.
Or the combination wave count is correct, which sees primary 4 over right now.
I bought SPY 268 calls for March….. why not!
Also anyone else think this was the Combo, target was 2616 and we hit what 2620?
That’s what I’m thinking 🙂
I agree with Kevin’s agreement with Verne. This correction from the ATH has not shown capitulation yet. However we may be very close. A break below 2604, then the 2600 pivot, then the February lows will cause a capitulation, imho. But it may not need to go as low as the February lows. I am starting to look for positive divergences as a set up to go long at that time.
Until then, I am watching and waiting for the market to make a move. It may all happen intraday so stayed tuned all day each day next week. Like Primary 4, this Intermediate 4 is requiring patience and for traders, nerves of steel.
you reversed the P4 and I4 there in the last sentence Rodney. You’re excused on a day like this! just make sure you don’t reverse your long entries for shorts (or vice-versa!).
I had a bunch of call bear credit spreads I set up late Tuesday. Taken ’em all. And added to the underwater long call positions. I’m leaning on the count. I have “lots” of time to be reasonably right, as well.
Come on banksters, jump in and buy this up!!
Why my friend you are absolutely correct. Thanks for pointing it out so I don’t confuse others as well.
New topic: I think I shared here some time ago, that I had a cardiac ‘event’ a couple of months ago. If not, well I did. Final diagnoses is PVC’s (premature ventricular contractions) which is very responsive to medications. I am on a quite low dosage and there should be no long term health concerns. Yeah! I may return to my fully active live of exploring the mountains of the western United States and I am cleared for full shoulder replacement surgery on Jan. 10th. Let’s hope the surgeon does not reverse things as I did in my statement above! But all in all, a great day yesterday to be out of the market resting my psyche and getting a clean bill of health. Happy dance at my house! Tonight’s beers and spirits are one me.
Great exit Rodney! Yea, put a big X with a marker pen on the shoulder to be operated on…stranger things have happened (“I went in for shoulder surgery and they took out one of my kidneys…”). I’ve had several major surgeries (early 1980’s, cancer) and the thing I learned and you seem to know: EVERY DAY OF LIFE IS A BLESSING and every day you can walk outside and breath the sweet air and see and feel the light that fills the world is even more blessing! Carpe diem!!
I’m rollin’ in money today, closed the short side of a bunch of different bear call credit spreads (QQQ, IWM, SPY), doubled up on the long call sides. And even out of the QQQ calls already at a small profit.
Let the P5 launch!!!!
Kevin, I sure hope you jest on loosing a kidney. I too am a cancer survivor of 16 years. I had prostrate cancer at age 48 which is very young. I stand cured and like you, thankful each day. Or at least I try to be.
Hi Rodney. Have you been evaluated by an electrophysiologist? It’s a subspecialty of cardiology. These guys can fix electric pathways in your heart to get rid of your PVC’s.
Just wanted to mention that. I’m a family physician here in USA
And if you come to Orange County….. I’ll put you to sleep
Thanks, sounds like something I should check into. Thanks ari.
Peter S., thanks so very much. But I have no problem sleeping. I know you mean the anesthesia kind of sleep. I am sure OHSU (Oregon Health Science University) will take care of that.
Make mine, GUINNESS!! 🙂
2700 to 2619 in 2 trading hours and this current lower wick isn’t capitulation ?
Is January, we had almost the exact same scenario. 80 pt sell off bought back hard. and that was the bottom.
At this point both the primary and alt count have been invalidated with the exception of the combination count correct?
I think so. Unless it’s a triangle with an acceptable overshoot for the final E wave.
Ya know, I think if its a quick stab through, it could still remain valid… but I’ll let Lara verify that.
A triangle would be invalidated; C would be at 2,631.09 (23rd November low) and E may not move beyond the end of C. Not even by a fraction at any time frame.
Today’s low is below 23rd November.
I do not believe the main count on a daily level has been invalidated. It will take a new low below 2603.54 to invalidate Intermediate 2. A count can be invalidated at the hourly time frame and not be invalidated at the daily or higher degree wave count.
The model wherein this sell off was a minor 2 IS invalidated: it’s moved below the low of the minor 1.
Whether there’s a way to still model the P4 as complete in late October I don’t know, but I’m not sure that would be sensible here. This action screams “more P4”.
If we now get a week of lower volatility and generally rising action…that would be what I would expect nominally as the start of the P5, just as the behavior immediately switched to that mode at the start of the I5 in early April.
But first there might be another jab down first to finish a bit deeper double combo. Just to put the final hammer blow of fear into the retail crowd.
I do believe that the banksters are very happy executing (driving) this sell off. And I suspect they’ve been buying it up at the lows here. And now the gradual run up will again start. “Manipulation”? Yes, all markets are manipulated to a greater or lesser degree by the big money at the table. Ever play no-limit poker? The player with the giant stack has an edge, merely by virtue of having more bullets at their disposal to attack (“manipulate”) with. But this market manipulation is always to the steady beat of a song called “The Elliott Wave”, and we’ve got the master guide. What an incredible edge to have!
The way I have it labeled with intermediate wave (2) over on the 23rd of November is now invalidated.
If this is minor wave 2, then it may not move beyond the start of minor wave 1. Not even by a fraction of a point on a tick chart. That rule is absolute. Which is nice, because it gives clear price points where I can discard ideas.
What could be happening is intermediate (2) has moved lower today as a regular flat.
So P4 continues…
Over here I’d say. Or, it goes a bit lower today/tomorrow and completes the double combo model.
Putting an assault on SPX trend and EW hourly/daily counts.
Bye Felicia.
NDX low here is in hyperspace afaiac, between 61.8% and 78.6% retrace levels. I wouldn’t be a bit surprised to see it get to that 78.6% before finally turning (6587). In which case, SPX probably slips lower too.
Fun times!!!!
TLT (20 year bonds) now at overlapped 38%/62% fibos, and the counter trend move up is about at that length of the largest such moves over the last year. Up and through to the overlapped 50%/78.6% around 120.5?
When I have trouble trading, I move up timeframes.
When I look at monthly SPX, I am VERY worried. Seems more like the time to bail on everything.
I agree and have done so. For now till things clear up at which point I can go long or short.
It’s a PRIMARY 4.
It’s supposed to scare the crap out of everyone. Earlier in this P4 I just didn’t feel it had demonstrated “P4 muscle”, and Verne commented that fear wasn’t high enough for a true bottom.
I think the muscle and the fear are there now. And nothing so far is out of line with Lara’s models (triange or combo appears to be the one; I doubt personally this is a minor 2 down though technically that is still a valid model).
It’s only a lagging indicator…but my trend measurement is showing the monthly trend as NEUTRAL. Not even down yet.
We’ll see!
I am looking for end of bull market sooner than later. Don’t really expect 3600 count to work out.
You may be right.
I personally, after a few years with Lara, have learned to trust her models, particularly at the higher time frames. I haven’t found her to be off. Maybe ever.
My confidence in at least new ATH’s upcoming is very high, therefore. Unless/until she is showing models indicating the GSC is already complete.
I know these banksters.
Look for one more assault on the 2700 pivot.
We may even reclaim it on the upside for a session or two.
Then….another 10X, of structured correctly even a 20X bonanza.
The best short opportunity of the year.
Rung the register at the open on some BIG trades.
Taking some well-deserved time off. Tough market!
Take care everone!
Have a good one. My rest has been awesoely refreshing in just 48 hours.
Watch for 3 wave move up for last bull distribution. I will look for shorting opportunity then
You are steely customer Mr. Verne. Nice score on your “massively short” position from a week ago or so! I hugely appreciate your sharing your outlook here.
Dum
Da dum dum………..
DUM
Not looking good at all folks for the bulls. If 2604 falls, look out below. February lows in danger of falling. Next in line 2300.
Of course, just my opinion.
Anything is possible. That said, I trust the wave counts.
Have we got sufficient fear for a bottom? I would say, probably, and “as required”.
If the teal line goes and price keeps dropping…then yup, we could be in interesting times!
SPX on/turning at it’s trend line established through the lows of the intermediate 4, and tested several times already by the P4. Will it hold yet again?
If it doesn’t … it could be in for quite the washout.
Here is one more thing that matters. We now have a clear five wave impulse down from recent highs. 😉
Oops! I was looking at a 5 hour and not a daily chart. Not so clear on daily.
They could re-trace this decline. Never under-estimate the banksters!
Unconfirmed reports floating around that CME is saying without circuit breakers, ES would have gone -1000. Yes, that is -37%
The move on Friday was sharp, but by no means out of the norm for a high volatility period ala all of the I4 down and much of this P4 as well.
I just see nominal action all well within the expectations of our EW roadmaps. Nothing unusual here that I see.
As to who was buying and selling…it makes no matter.
I am afraid it DOES matter who is buying and selling.
Central banks and hedge funds are allowed to trade equities at substantially higher leverage than retail investors, This is not well known but failure to recognize it will result in the average trader severely mis-pricing market risk.
That’s a structural fact that has been true for years, and is no more or less true this week than last week or a year ago. Yes the market is a total house of cards, I agree completely.
I am not talking about Friday, but last nights futures open.
Yes. The Working Group has thrown in billions.
That candle represents a leveraged unwind. Pure and simple.
They are going to have to spend a lot more, as we now have a confirmed death cross in ES. The synthetic short vol trade may finally be starting to unwind.
Death crosses take months of price action to confirm and generally are not reversed “on a dime”. We could be looking at significant downside ahead. both in time and distance. Trade carefully!
Oh yes
Vxx was unavailable for shorting last week and even below $33…
The vix futures were pounded into submission on Sunday night and into Monday
As well as one Tuesday trying to contain the spike …
There will be pain felt …
That short vol unwind seems to correspond to Lara’s triangle target of 2635-2615
That may do it …
But I am having trouble seeing the impotus for a strong rally…back above the moving averages
They already tried to the old gap and go trick… to jump them overnight and it just failed miserably
Unless it is simply no more sellers and the real asset owners ( banks).. can just buy the road back up with freshly printed funds …one last time …for the last 5 wave..
But it could just collapse under that teal trend line and crash 400 points on the s and p in a day…
Only long I’ll look at is aapl right now on a flush ..
It’s already crushed …and by selling puts with premium just outside the money of the drop price
Will also try close to money index calls at the bottoms triangle targets around 2640
CME pulled plunge protection team on ES futures at open, 6pm EST Wednesday. Paused it three times, 10 seconds each. (and put out a statement about it)
Dropped from 2718 to 2649.50 in like 90 seconds.
That is NOT normal….it might become common…. 🙂
Remember how long we went without so much as a 1% market swing? Noticed anything different lately?
Intriguing comment actually:
Days with a 2% drop (SPX):
2004: 0
2005: 0
2006: 0
2007: 11
2008: 41
2009: 28
2010: 10
2011: 21
2012: 3
2013: 2
2014: 4
2015: 6
2016: 5
2017: 0
2018: 11 (so far)
Looks about right re: our expectations for a coming GSC wave 1 top! Thanks for the data.
Well… this is weird. I’ve checked the NYSE holiday calendar and there’s no holiday today.
But I’ve got data from neither Barchart nor Stockcharts today.
And I’ve checked Yahoo Finance and there’s no data for this session showing up there either.
I’ve disconnected and reconnected multiple times… I have no data to analyse from Barchart.
And the comments here are unusually quiet. Does anyone have any knowledge of why the markets are so quiet or why I don’t have data?
Rapture. Only a few of us left.
Good luck to you Lara!
??
George HW Bush died over the weekend and Trump declared today a day of Mourning. Government is closed including our stock markets.
Also checked Bloomberg and Trading View… no data for the 5th of December showing up.
This is just a normal Wednesday, right?
I’m feeling like I’m in the twilight zone….
Oh okay, found it. Luckily I can still Google… should’ve done that first.
Markets closed today to honour George H W Bush.
No updated analysis today folks, nothing to analyse.
Markets are closed today in honor of former President George H.W. Bush, whose funeral is today.
Thanks Peter. I did figure that out eventually.
I’m enjoying this mid week day off so much…I say we have the market close EVERY Wednesday! A 2-on 1-off 2-on 2-off schedule is much more…relaxed!
Thank you, Lara, for your steady, thoughtful analysis every day. I deeply appreciate your labors!
One question… if P4 may potentially still be unfolding as a triangle, is there any problem with the fact that waves A, B & C look like 3-wave structures and D looks like a straight-up simple impulse?
Thanks in advance!
I second that question!
Impulses and zigzags can look the same at higher time frames.
So not too much of a problem, but it does slightly reduce the probability. I do think that wave up does subdivide as a five wave impulse best.
And thank you for the kind words Curtis. Much appreciated.
Boom!