Upwards movement was expected to continue. The Elliott wave target at 2,780 for a short-term interruption to the bullish trend was too low. Price reached 2,800.18.
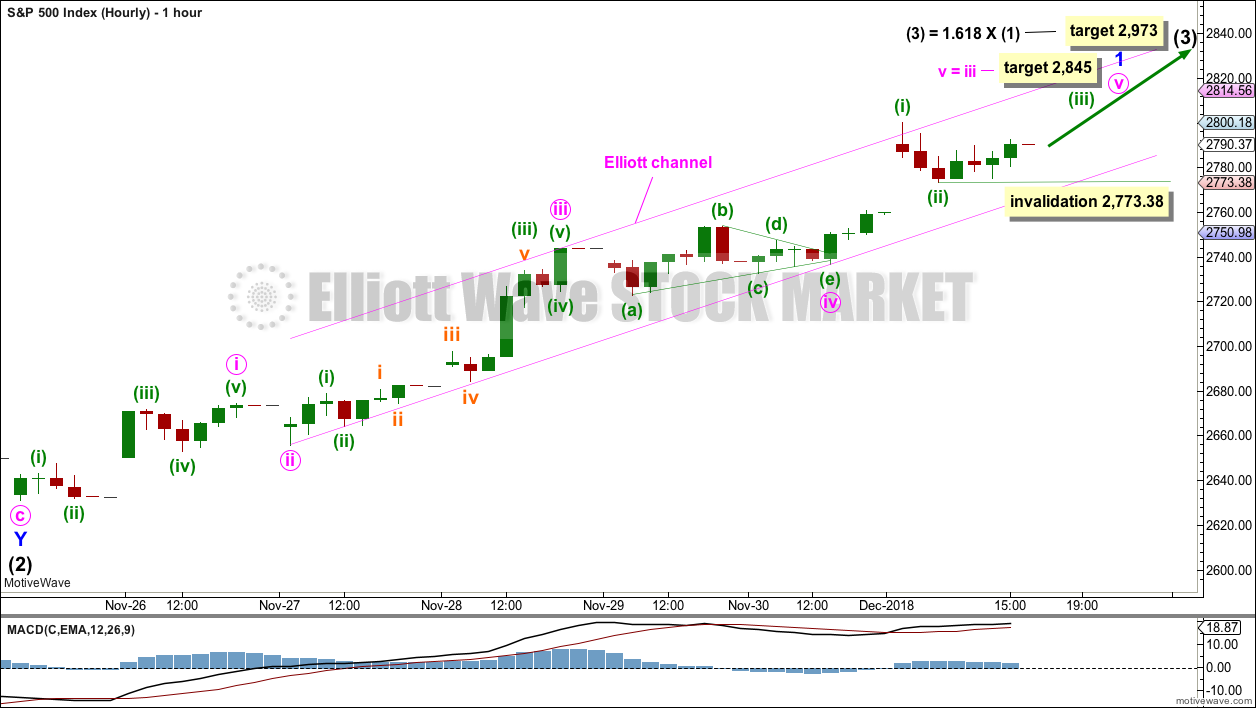
Summary: Assume the trend remains the same until proven otherwise. Assume minor wave 1 may continue until either the small channel on the hourly chart is breached or price makes a new low below 2,773.38. The new target for minor wave 1 to end is 2,845.
However, price has been unable to overcome strong resistance about 2,800. Today completes a doji candlestick, which puts the trend from up into neutral. Be aware that this upwards wave of minor wave 1 is nearing its end.
A mid-term target for the next wave up is 2,973. About this target a multi-week consolidation may begin for intermediate wave (4).
The main wave count now expects this bull market to end at the end of December 2018 at the earliest, and possibly in March 2019, at 3,090.
The last gap may provide support at 2,682.53.
New updates to this analysis are in bold.
The biggest picture, Grand Super Cycle analysis, is here.
Last published monthly chart is here, video is here.
MAIN ELLIOTT WAVE COUNT
WEEKLY CHART
Cycle wave V must complete as a five structure, which should look clear at the weekly chart level and also at the monthly chart level. It may only be an impulse or ending diagonal. It is clear it is an impulse.
Within primary wave 3, there is perfect alternation and excellent proportion between intermediate waves (2) and (4).
Primary wave 4 may have found very strong support about the lower edge of the teal channel. This channel is copied over from the monthly chart and contains the entire bull market since its beginning in March 2009. While Super Cycle wave (V) is incomplete, this channel should not be breached at the weekly chart level.
Draw the teal channel from the high of cycle wave I at 1,343.80 on the week beginning 3rd July 2011, to the high of cycle wave III at 2,079.46 on the week beginning 30th November 2014, and place a parallel copy on the low of cycle wave II at 1,074.77 on the week beginning 2nd October 2011. Draw this chart on a semi-log scale. A small overshoot, like that seen at the end of cycle wave IV, would be entirely acceptable. If price does move below the channel, then it should reverse reasonably quickly.
The proportion between primary waves 2 and 4 is reasonable. Flat corrections tend to be longer lasting structures than zigzags. There would be perfect alternation in structure and inadequate alternation in depth. This is acceptable.
This wave count has the right look at the monthly chart level.
If primary wave 5 ends at or after the end of December 2018 and the AD line fails to make new all time highs, there would then be the minimum required four months of bearish divergence between price and the AD line. If this happens, then the conditions for the end of this bull market would be in place.
A target is calculated for primary wave 5 to end. If primary wave 5 were to be only equal in length with primary wave 1, then it would be truncated. A truncated primary wave 5 would be unlikely as then there could be no bearish divergence with the AD line. The next Fibonacci ratio in the sequence is used to calculate a target for primary wave 5.
Within primary wave 5, no second wave correction may move beyond the start of its first wave below 2,603.54.
DAILY CHART
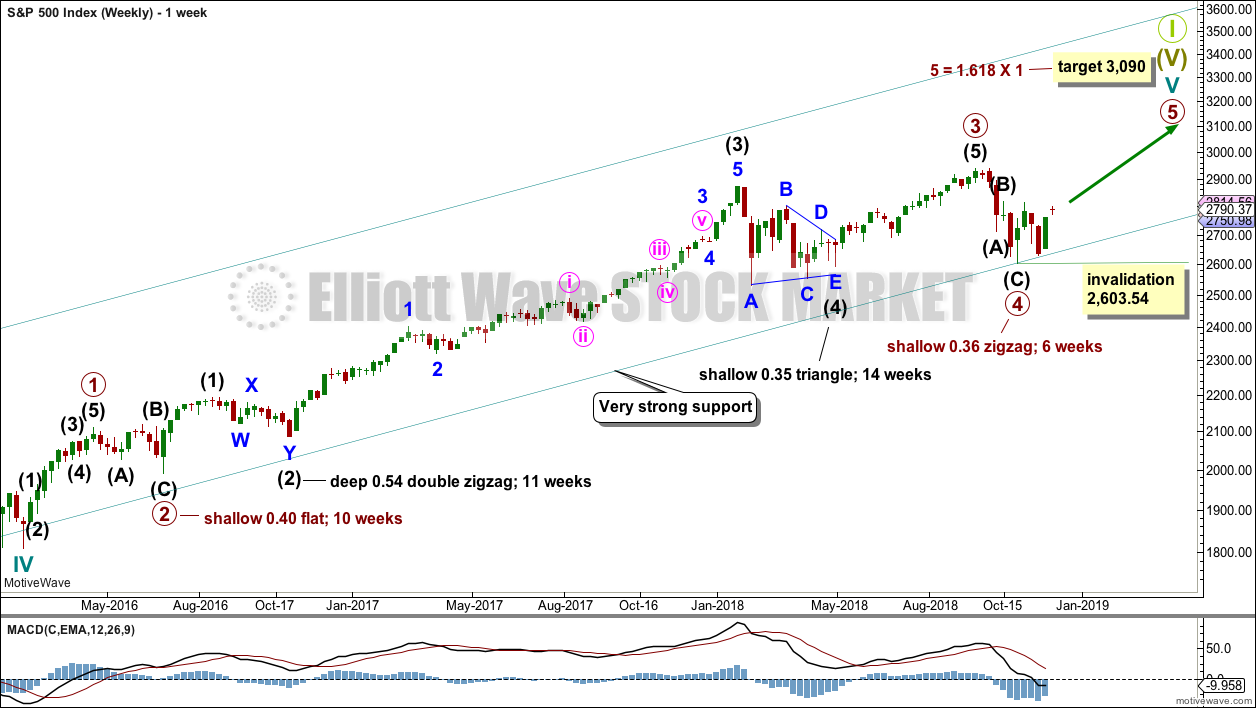
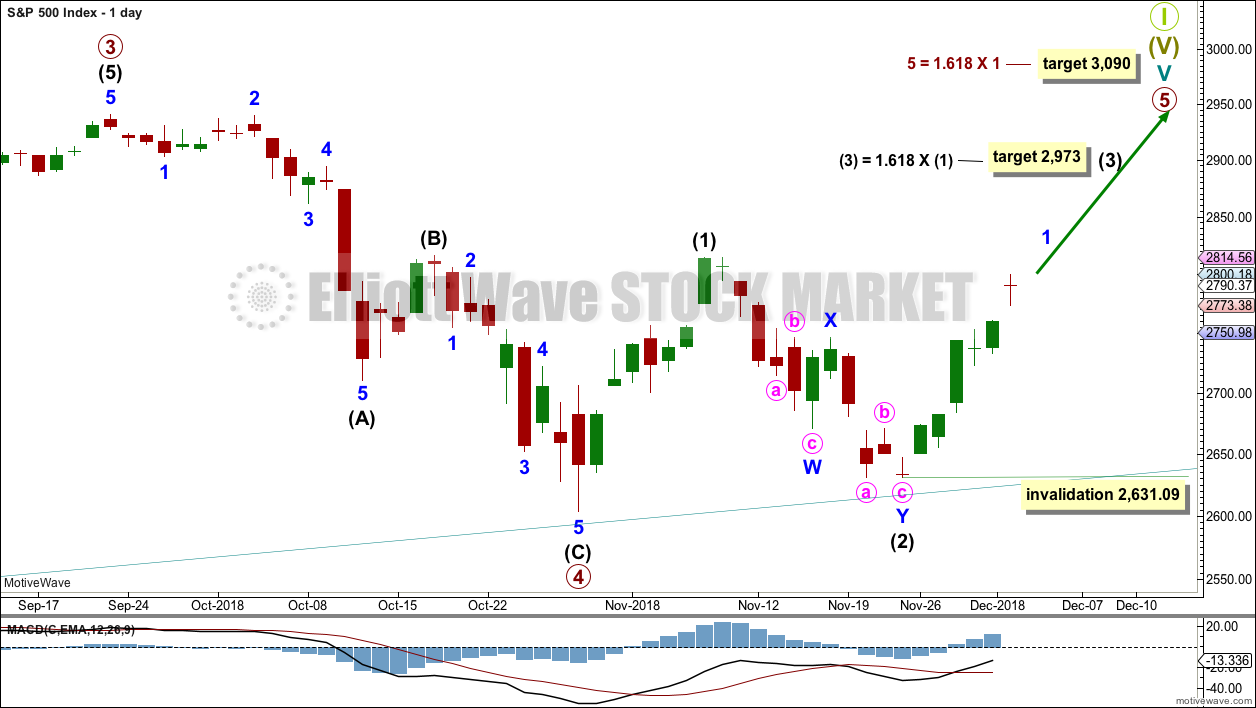
Within primary wave 5, intermediate waves (1) and (2) may be over. Within intermediate wave (3), minor wave 2 may not move beyond the start of minor wave 1 below 2,631.09.
Primary wave 5 may subdivide either as an impulse (more likely) or an ending diagonal (less likely). Intermediate wave (1) may be seen as either a five wave impulse or a three wave zigzag at lower time frames, and so at this stage primary wave 5 could be either an impulse or a diagonal.
For both an impulse and a diagonal, intermediate wave (3) must move above the end of intermediate wave (1).
Primary wave 5 at its end may be expected to exhibit reasonable weakness. At its end, it should exhibit a minimum of 4 months bearish divergence with the AD line, it may exhibit bearish divergence between price and RSI and Stochastics, and it may lack support from volume.
HOURLY CHART
Intermediate wave (3) may only subdivide as an impulse if primary wave 5 subdivides as an impulse.
Within intermediate wave (3), minor wave 1 may still be incomplete.
Within minor wave 1, minute waves i through to iv may be complete. Minute wave ii may have been a zigzag. Minute wave iv may have been a more time consuming triangle, which provides perfect alternation.
There is no adequate Fibonacci ratio between minute waves i and iii. This makes it more likely that minute wave v may exhibit a Fibonacci ratio to either of minute waves i or iii. Minute wave v has passed equality in length with minute wave i. If minute wave v is incomplete, then a new target is calculated.
A channel is drawn about minor wave 1 using Elliott’s second technique. Price should now remain within this channel while minor wave 1 continues. If price breaks below the lower edge of the channel, whether or not the target is reached, then assume minor wave 1 is over and minor wave 2 has then begun.
Within minute wave v, minuette waves (i) and (ii) may now be complete. Within minuette wave (iii), no second wave correction may move beyond the start of its first wave below 2,773.38.
When minor wave 1 could be complete, then the invalidation point must move down to its start at 2,631.09. Minor wave 2 may last about three days and may end about the 0.382 or 0.618 Fibonacci ratio of minor wave 1. Minor wave 2 may not move beyond the start of minor wave 1 below 2,631.09.
ALTERNATE ELLIOTT WAVE COUNT
WEEKLY CHART
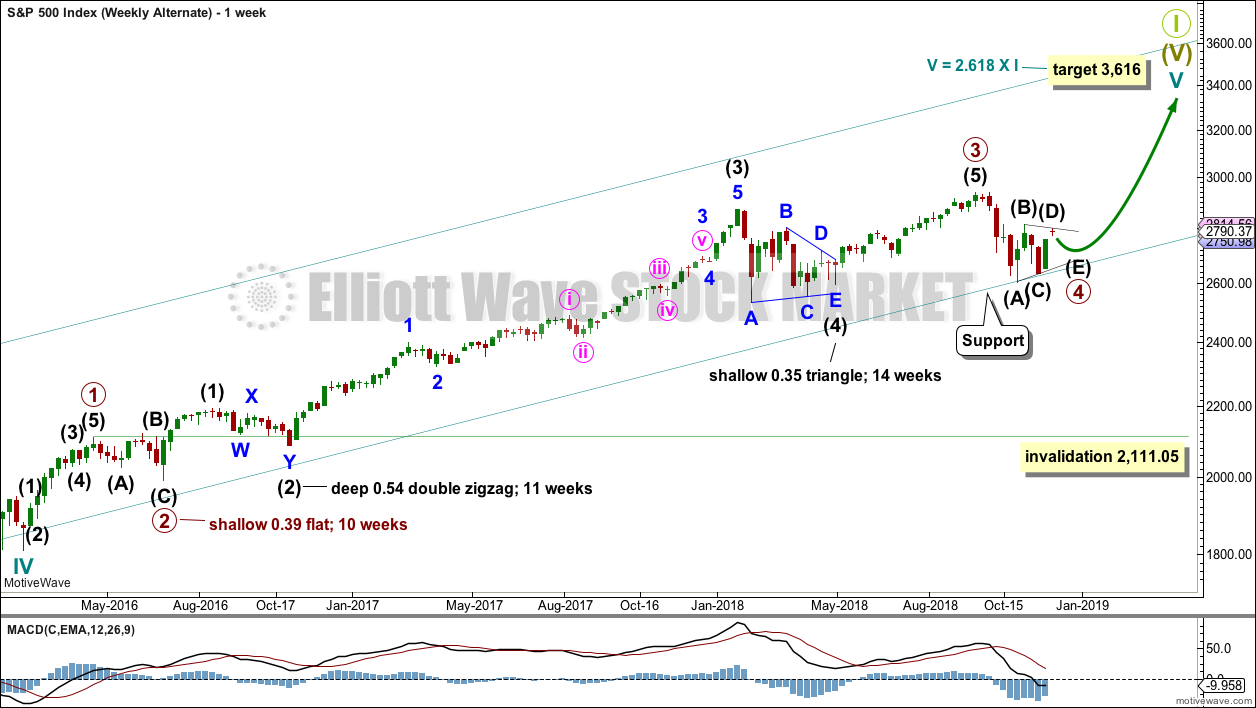
It is also still possible that primary wave 4 may be incomplete. However, at this stage, if primary wave 4 is incomplete and continues for a further several weeks, it would now be out of proportion to primary wave 2. Primary wave 2 lasted 10 weeks. If primary wave 4 is incomplete, then so far it has lasted 10 weeks.
If primary wave 4 is incomplete, then the most likely structures at this stage may be a zigzag, triangle or combination. A double zigzag and flat, and today also a single zigzag, are discarded based upon the requirement for a large overshoot of the teal trend channel, and poor proportion.
Primary wave 4 may not move into primary wave 1 price territory below 2,111.05.
For this alternate wave count, when primary wave 4 may be complete, then the final target may be calculated at primary degree. At that stage, there may be two targets, or the target may widen to a small zone.
DAILY CHART – TRIANGLE
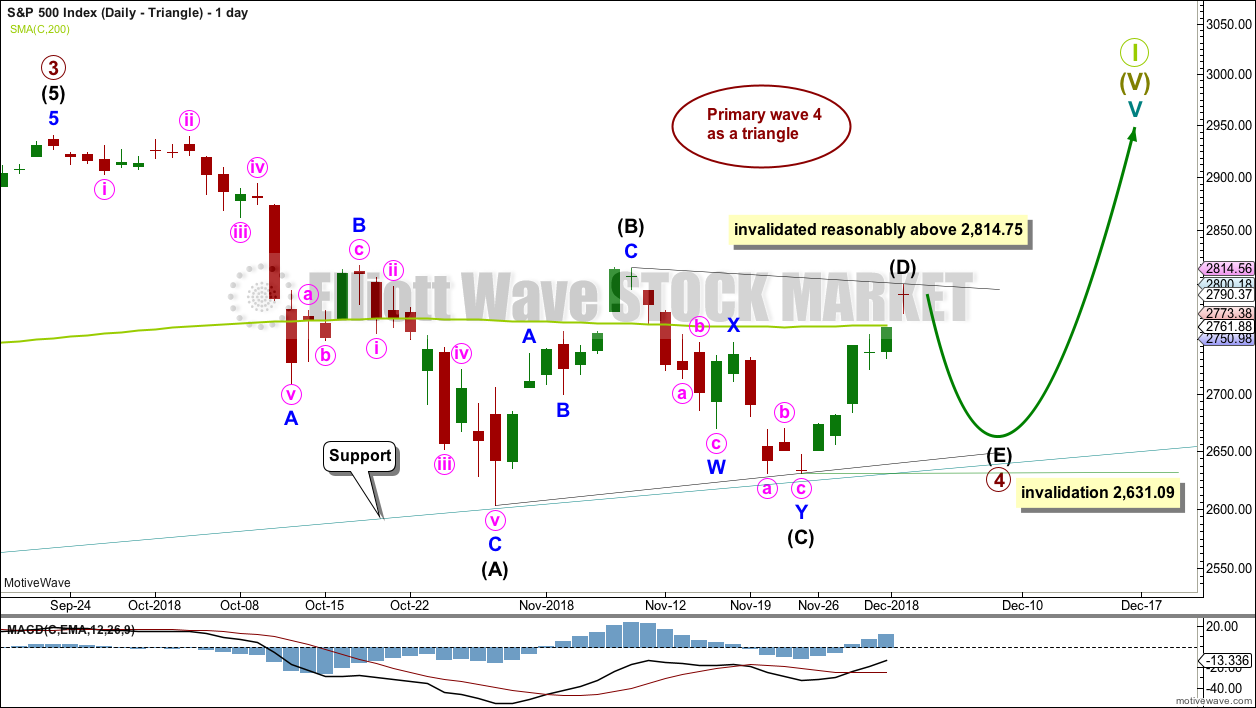
If primary wave 4 unfolds as a triangle, it would have perfect alternation with the regular flat correction of primary wave 2. It would also continue to find support about the lower edge of the teal trend channel. Triangles are fairly common structures for fourth waves.
The triangle is relabelled to see intermediate waves (A), (B) and (C) now all complete. Intermediate wave (B) is shorter than B waves of triangles usually are; this gives the triangle an odd look. However, considering the duration of primary wave 4 so far, this labelling now makes more sense.
Intermediate wave (C) may have completed as a double zigzag. This is the most common triangle sub-wave to subdivide as a multiple.
Price has bounced up off the lower edge of the teal trend channel.
If the triangle is a regular contracting triangle, which is the most common type, then intermediate wave (D) may not move beyond the end of intermediate wave (B) above 2,814.75.
If the triangle is a regular barrier triangle, then intermediate wave (D) may end about the same level as intermediate wave (B). As long as the (B)-(D) trend line remains essentially flat a triangle would remain valid. This invalidation point is not exact; intermediate wave (D) can end very slightly above 2,814.75.
It is possible that intermediate wave (D) may have ended today.
The final wave down for intermediate wave (E) may not move beyond the end of intermediate wave (C) below 2,631.09.
This wave count could see a triangle complete in another two to three weeks, which would see primary wave 4 last a total of 14 or so weeks. This would be reasonably in proportion to the triangle for intermediate wave (4) one degree lower, and this would be acceptable.
This wave count would also see the lower edge of the teal trend channel continue to provide support. This would give the wave count the right look at the weekly and monthly chart levels.
DAILY CHART – COMBINATION
This wave count is judged to have only a slightly lower probability than the triangle. If this wave count is correct, then primary wave 4 may be a few weeks longer in duration than primary wave 2. This wave count now has a problem of proportion.
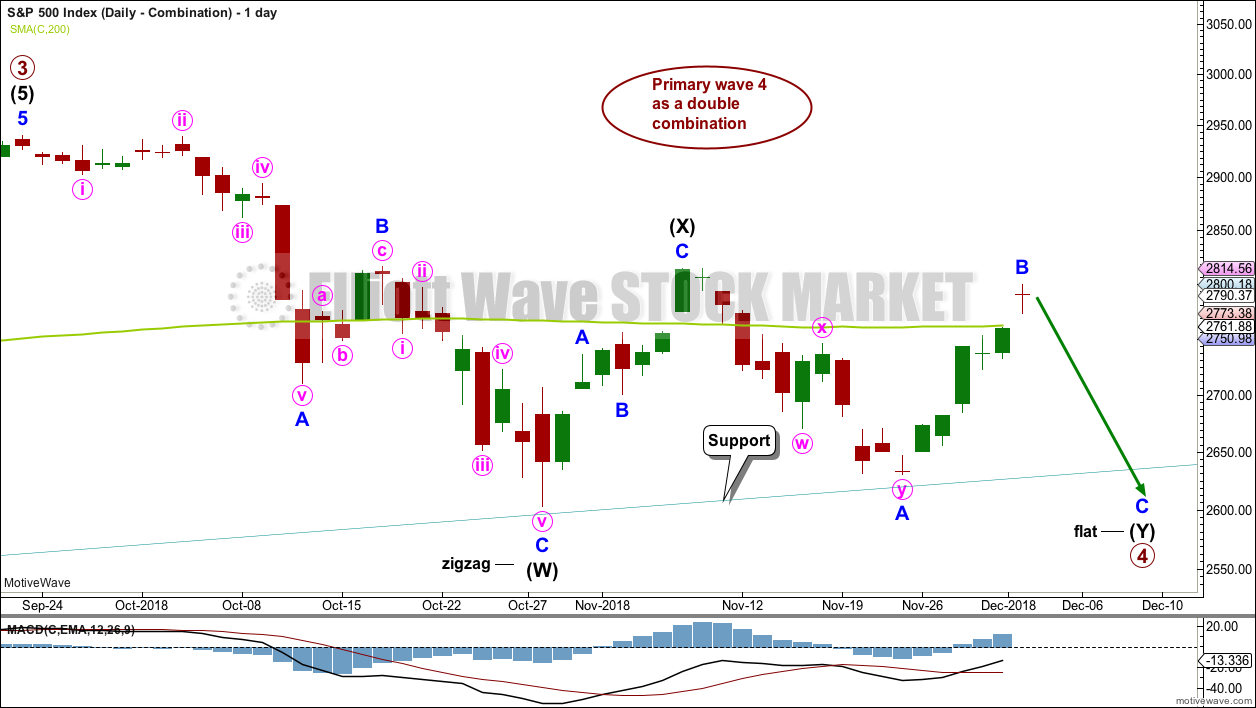
Primary wave 4 may be unfolding as a double combination. The first structure in the double may be a complete zigzag labelled intermediate wave (W). The double may be joined by a three in the opposite direction labelled intermediate wave (X). Intermediate wave (X) may be complete as a single zigzag; it is deep at 0.63 the length of intermediate wave (W), which looks reasonable.
Intermediate wave (Y) would most likely be a flat correction, which should subdivide 3-3-5.
Within the flat correction of intermediate wave (Y), minor wave B has now met the minimum 0.9 length of minor wave A and minor wave B is now 0.92 the length of minor wave A. A regular flat correction may be unfolding for intermediate wave (Y).
The common range for minor wave B is from 1 to 1.38 times the length of minor wave A giving a range from 2,815.15 to 2,885.09. Minor wave B may make a new high above the start of minor wave A at 2,815.15 as in an expanded flat.
If intermediate wave (Y) continues as a regular flat and minor wave C downwards within it begins here, then minor wave C would reach equality in length with minor wave A at 2,616. This would require only a small overshoot of the teal trend channel, which would be acceptable.
TECHNICAL ANALYSIS
WEEKLY CHART
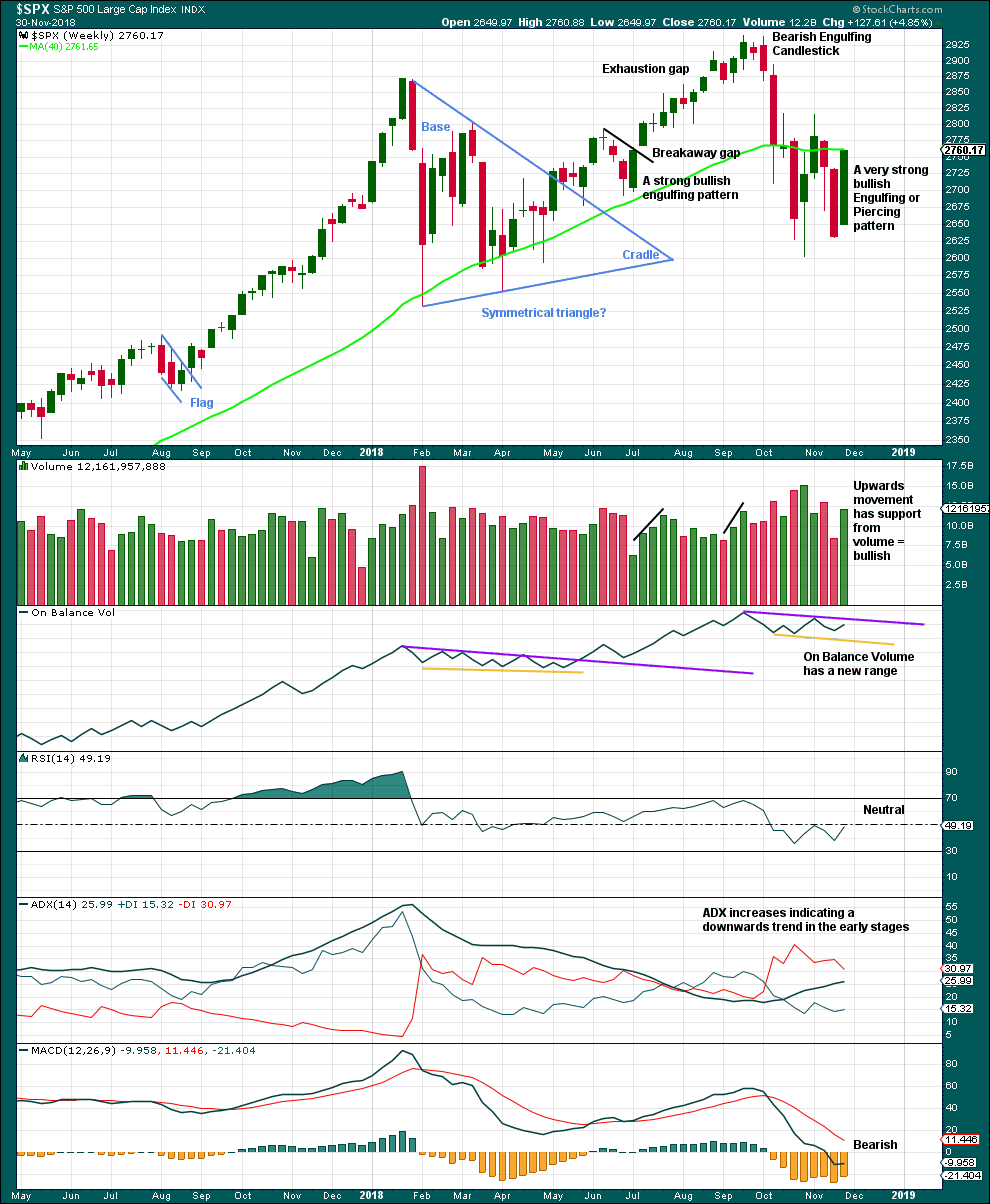
Click chart to enlarge. Chart courtesy of et=”_blank”>StockCharts.com.
A Bullish Engulfing candlestick pattern requires the second candlestick to open below the low of the first candlestick. Last week’s candlestick opens above the low of last week’s candlestick. However, the most important aspect of an Engulfing pattern is the close of the second candlestick. Here, this week’s candlestick has closed well above the open of last week’s candlestick. This is very bullish.
This candlestick is neither correctly an engulfing nor piercing pattern, but the close is very bullish. It will be read as a bullish reversal pattern.
With support from volume, this weekly candlestick is very bullish. This supports the main Elliott wave count. This does not look like a B wave nor a D wave within a triangle.
DAILY CHART
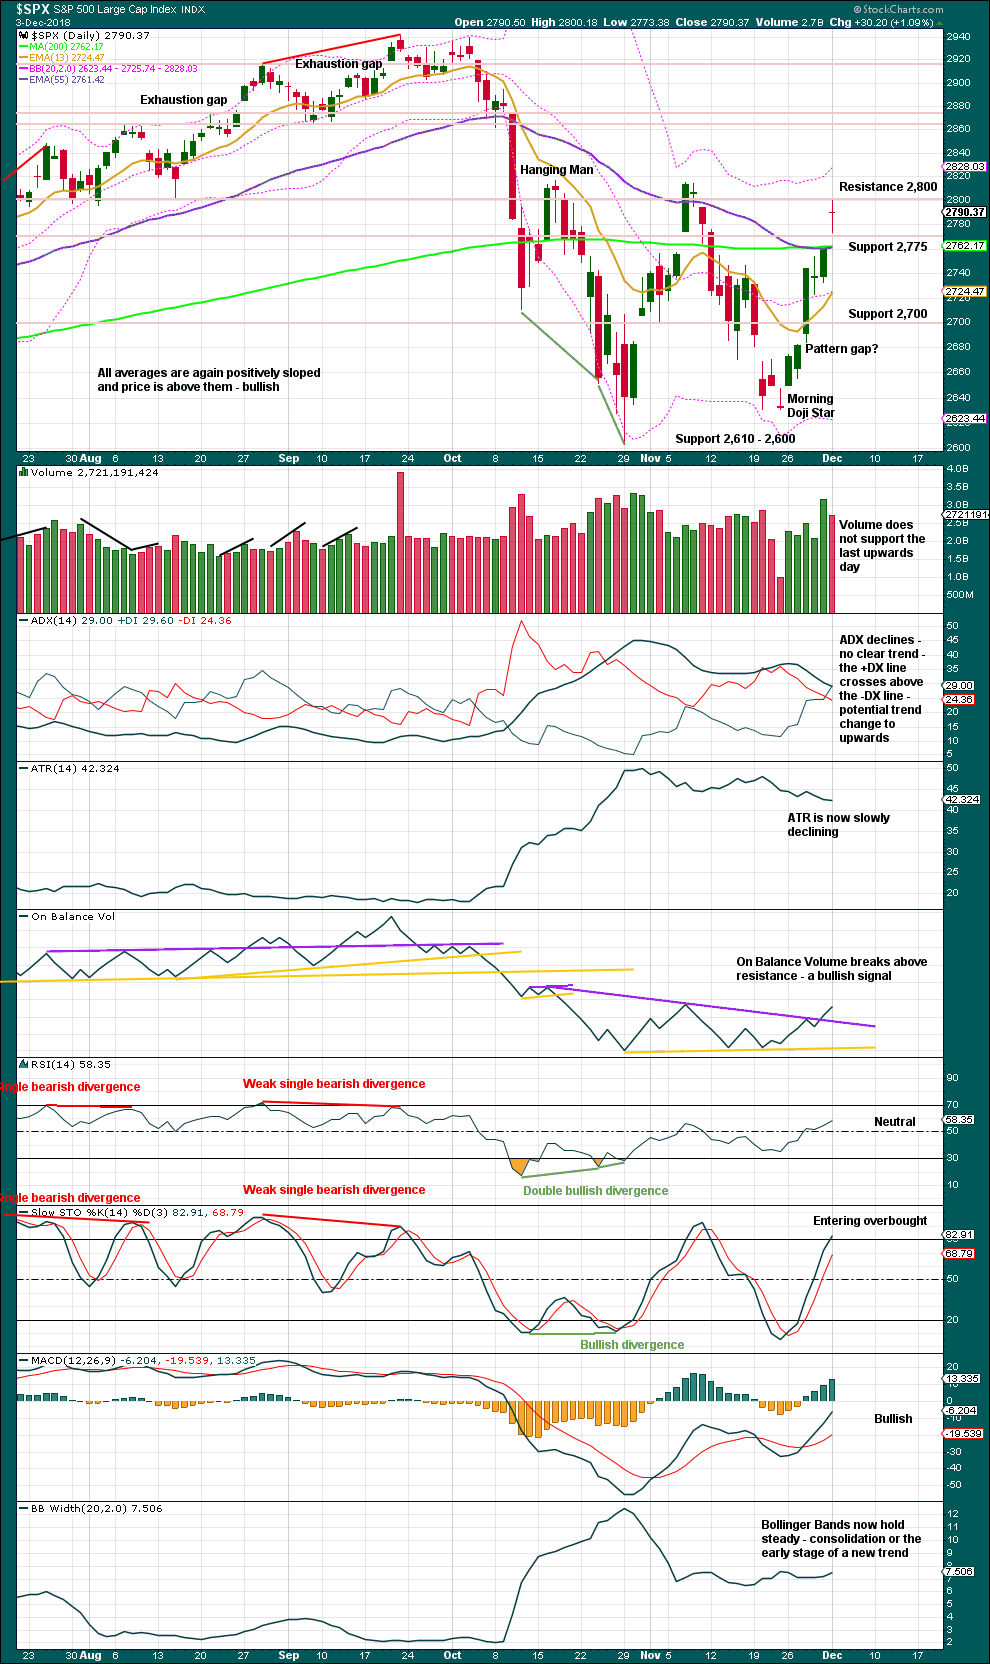
Click chart to enlarge. Chart courtesy of StockCharts.com.
The lower edge of the teal trend channel is not shown on this chart, but it should be considered as part of this technical analysis. Expect that trend line to continue to provide support, until it does not.
The strongest pieces of technical analysis on this chart are strong volume for Friday and a bullish signal from On Balance Volume. This offers reasonable support to the main Elliott wave count, and puts strong doubt on the alternate daily wave counts. This does not look at all like a B wave; B waves should exhibit clear weakness.
Today’s doji candlestick puts the short-term trend from up into neutral. A doji is not a reversal signal on its own, but it does indicate a balance of bulls and bears today.
Declining volume today is not a concern in current market conditions. Price has been rising on light and declining volume at all time frames for years now.
BREADTH – AD LINE
WEEKLY CHART
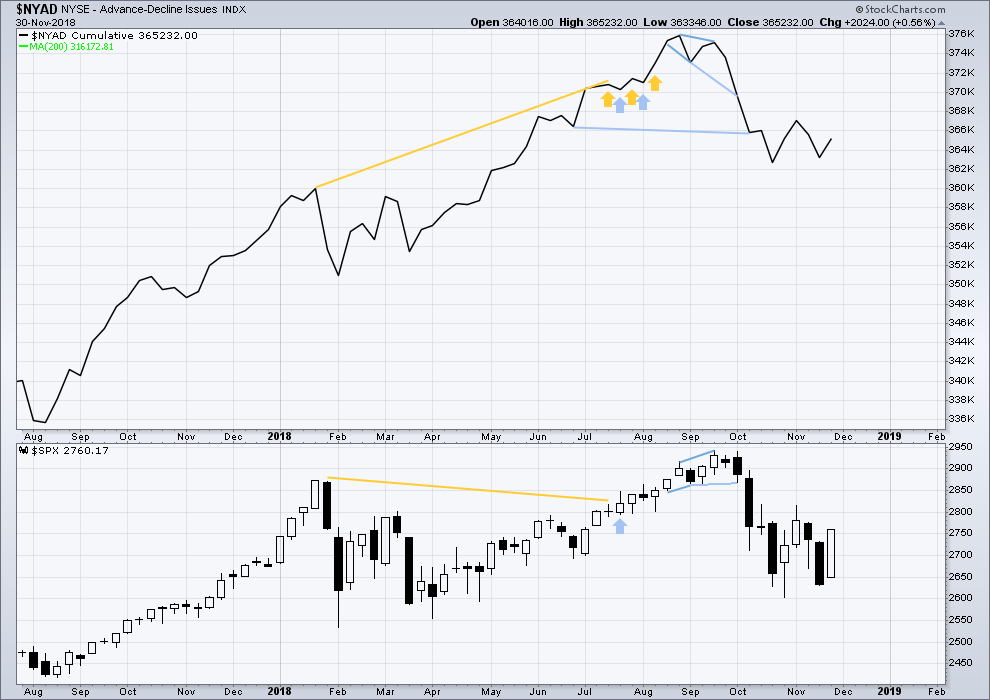
Click chart to enlarge. Chart courtesy of StockCharts.com. So that colour blind members are included, bearish signals
will be noted with blue and bullish signals with yellow.
Both price and the AD line have moved higher last week. Upwards movement has support from rising market breadth. There is no short-term divergence.
All of small, mid and large caps are moving higher. Upwards movement has broad market support.
DAILY CHART
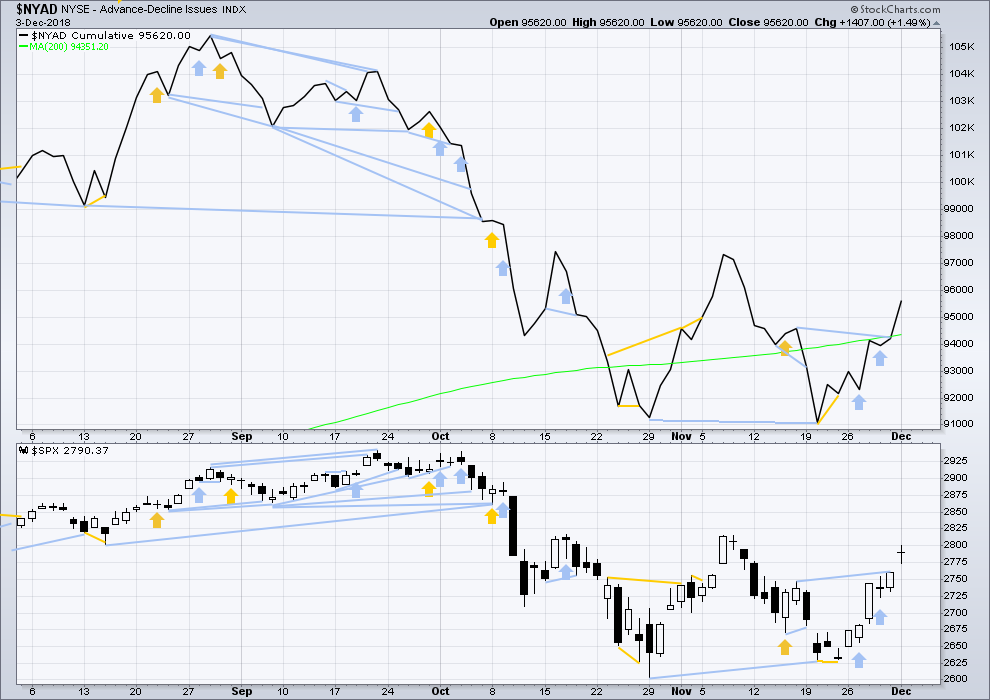
Click chart to enlarge. Chart courtesy of StockCharts.com. So that colour blind members are included, bearish signals
will be noted with blue and bullish signals with yellow.
There is normally 4-6 months divergence between price and market breadth prior to a full fledged bear market. This has been so for all major bear markets within the last 90 odd years. With no longer-term divergence yet at this point, any decline in price should be expected to be a pullback within an ongoing bull market and not necessarily the start of a bear market. New all time highs from the AD line on the 29th of August means that the beginning of any bear market may be at the end of December 2018, but it may of course be a lot longer than that.
Breadth should be read as a leading indicator.
Bearish divergence noted on Friday has been followed by upwards movement on Monday. It may have failed, or it could be an early warning of the end of primary wave 5.
Today price has moved higher with support from rising market breadth.
VOLATILITY – INVERTED VIX CHART
WEEKLY CHART
Click chart to enlarge. Chart courtesy of StockCharts.com. So that colour blind members are included, bearish signals
will be noted with blue and bullish signals with yellow.
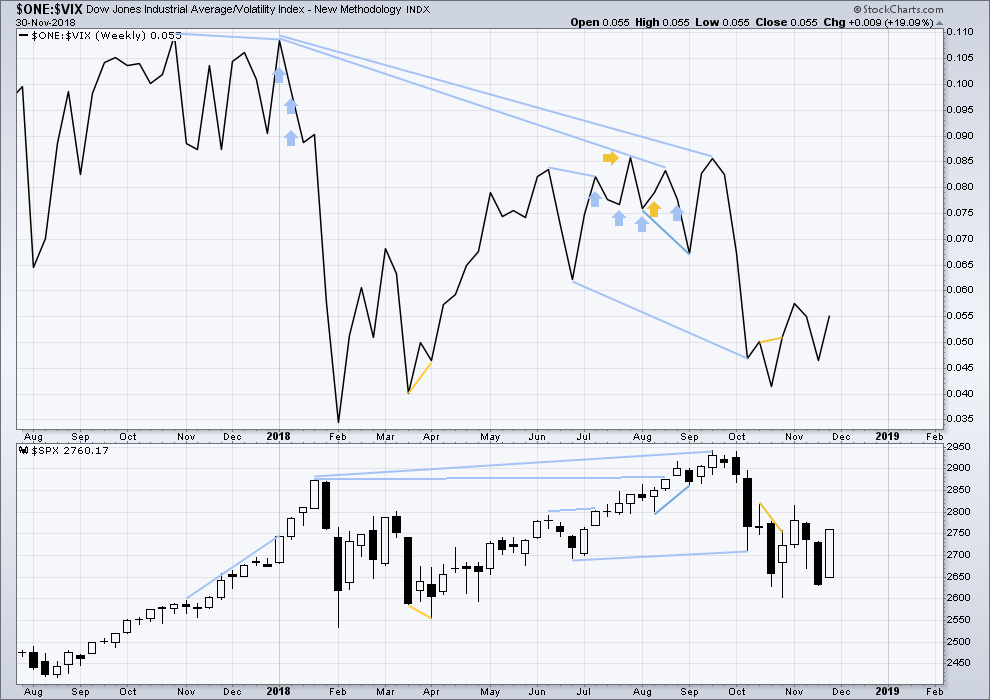
Both price and inverted VIX have moved higher this week. There is no short-term divergence.
DAILY CHART
Click chart to enlarge. Chart courtesy of StockCharts.com. So that colour blind members are included, bearish signals
will be noted with blue and bullish signals with yellow.
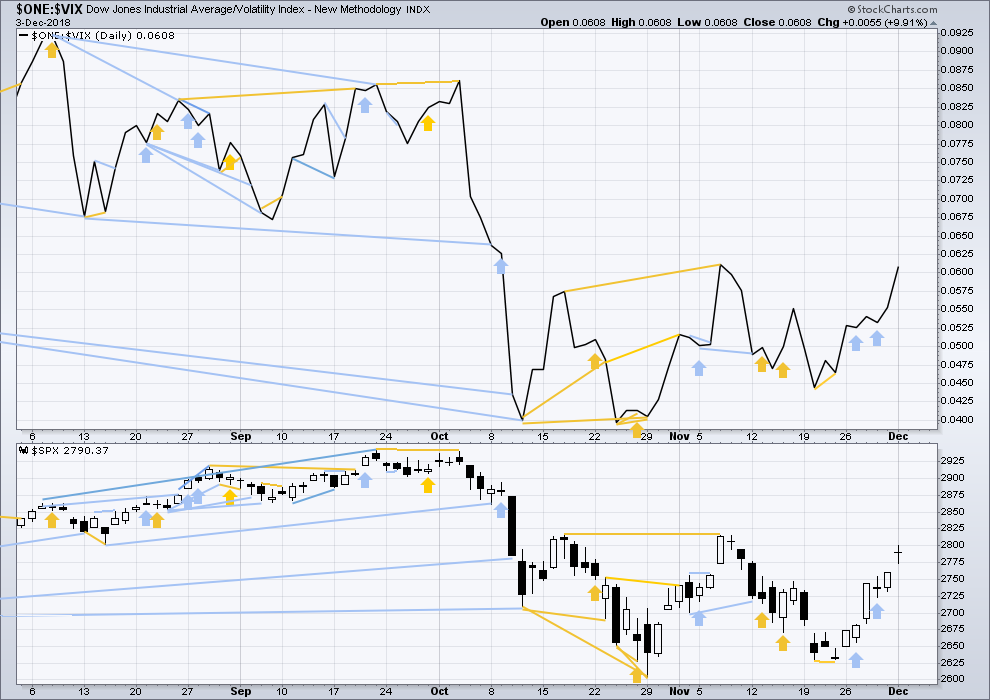
Normally, volatility should decline as price moves higher and increase as price moves lower. This means that normally inverted VIX should move in the same direction as price.
Like the AD line, inverted VIX may now begin to accumulate instances of bearish signals or divergence as a fifth wave at three large degrees comes to an end.
Both price and inverted VIX have moved higher on Monday. The rise in price today has support from a normal corresponding decline in VIX.
DOW THEORY
The following lows need to be exceeded for Dow Theory to confirm the end of the bull market and a change to a bear market:
DJIA: 23,344.52.
DJT: 9,806.79.
S&P500: 2,532.69.
Nasdaq: 6,630.67.
Published @ 07:07 p.m. EST.
—
Careful risk management protects your trading account(s).
Follow my two Golden Rules:
1. Always trade with stops.
2. Risk only 1-5% of equity on any one trade.

Quite a lot of chop. The talking heads have clearly given up trying to explain this market. The charts look bad but I am still waiting for significant weakness in the financial sector to emerge. I was told there was immense weakness and I could expect imminent major bank failures… in February 2018… If this is the end, where is the bloodbath we saw in 2007?
I got a recent heads-up from another vol enthusiast who suggested I switch my VIX BB settings from 2 delta to 1.4 for generation of better sell signals for moves below the the lower B band. I think he is onto something! 🙂
Maplestone:
So sorry I missed your query from last session about the expiration trade.
I tried to post a heads-up to sell the puts right at the open (which I did) but for some reason the comment went into moderation and did not get posted.
As to my expectation of the move down I wager that question has been answered! 🙂
Set me free, why doncha babe…! 🙂
What a day.
Ka-ching.
I know you meant…. KA-CHINGGG!!! 🙂
Watch the pivots. What happens there will tell you quite a bit about the short term prospects for market direction.
indeed, if 2700 and then the 61.8% at 2695 goes here, could have panic into the close…
Yes.
All this is occuring against a backdrop of a risk parity trade that remains largely unwound. The only question is whether they will delay that by a successful defense of the pivot or not. Price needs to close above it today. If it does not….all bets are off as to where we could end up…
My overall view of today:
The bottom line is that while price remains within the teal trend channel, either the main preferred Elliott wave count or the alternate triangle count should be used.
Both of those counts expect any deeper pullback here to find support again at that trend line.
Any bearish view right here and right now which expects that trend line to be broken IMO should be judged to have a lower probability.
Assume the larger trend remains the same, until proven otherwise. And assume support will continue at that line, until it is breached.
That line has extremely strong technical significance people. It’s been held for over 10 years and tested multiple times. The length of time it’s been held especially increases it’s technical significance.
Has price completed an ABC down…or a 1-2-3 and now the 4 will set up the coming soon 5 down. The eternal EW question. I can easily count it both ways at the 5 min level.
Seems like capitulation day to get rid of all the weak longs and get people short… then face ripping no pullback rally…???
With 3 of 3 possible… this coming from no where and a bit exaggerated move… let’s see
Anybody make some money on the Ten year today?
No and yes. I have a put credit spread and the legs are getting rather fat. I’m waiting for the top of this counter trend move to reveal itself…then I dine on one and hang the other out for the birds to eat.
You may be exactly right. However, for me today, I am feeling out of sync and psychologically I am quite indecisive. It is not a good place to be as a trader. So I am sitting on hands awaiting further developments both in the market and for me to get my right psyche back.
It’s absolutely a clean out move. only question is, how deep do they clean? Lol!!!
I see a 5 wave in progress on the 5 minute and the iv perhaps just completed and now the final v down is launching. Not a good fit for an E wave of a triangle. My counting is always highly suspect.
Do remember what Verne said a few days ago: need more FEAR to get a bottom. Feelin’ it yet? The best opportunities for longs are when the panic is highest…sometimes.
Updated hourly chart:
The channel was breached in the third hour of trading today and so minor 1 is over and minor 2 is underway at that point.
The 0.618 Fibonacci ratio is a target for minor 2 to end.
This falls outside nominal tech analysis. All of the intermediate 4 demonstrated frequent highly volatile moves. Perfectly coincident with the end of the I4 was the start of low volatility price movement (and a steady rising market, the I5). Here we continue to have very high volatility. I see that as adding some significant probability points to the continuing P4 models vs. the P4 complete model.
It’s also possible that P5 may begin to take on some characteristics of the upcoming bear market.
Volatility may begin to increase, particularly towards the end.
I’m going to have to take some time now to look over past changes from bull to major bear markets and see if the S&P did that slow curving rounded top thing it does, or was it a quicker shift with a ^ spike.
I’ve closed all my long positions in my short term account at a small profit. I am waiting on the long term account to the end of the day and hopefully Lara’s assessment. I am thinking one of Lara’s alternates is going to show up. This down move is too much, too powerful imo.
Look at the 50 and 200 dsma…..
DC underway….
I’ve closed all long positions at all accounts. The risk right now is too much. I want to see what happens Thursday.
BTW, I am not looking at any news. Is there a news event tied to today’s drop?
I am da “TARIFF MAN”!!
Thanks Ian.
Wait. I did not pull the trigger yet on the long term account. I am at a place of indecision. The low gives an hourly candlestick with a long lower wick. Bullish at least for the moment. I am still waiting.
When trading bear markets, look at bullish signal with a healthy degree of skepticism. The reverse is true for bull markets. Mr. Market’s aim is to mislead the herd… 🙂
Pulled the trigger. I want to sleep well tonight. I have also got major surgery coming up in a month. I want to be on the side lines for that event.
I think the potential for a fair amount more (the blue teal line!) which is what, 2635ish? the end of this week is “likely” (over 50%). So I’d say good call.
A Rodney sell signal is significant, thanks.
SPY 275.5 Friday calls only a quarter?
Lol!!! I’m vaguely tempted but no, that’s just a “fair” bet, not a good or great bet; properly priced IMO. I’m looking at the weekly chart; it’s still early-mid week but it’s got the dark cloud cover from hell on it right now. Looking just at that I’ll throw my money at the short side every time and come out in the limit a big winner. Which has me wondering about best tactics for a reentry short….back to work!
They have held Tesla up like a balloon
Today
No volume
Did nothing while the market crashed around it
Upgrades and Aapl will buy announcements came to try and hold it up a little after 1:30
They were pumping it like crazy early
Someone got caught with their pants pumping
It’s a good short n any strength IMO
Is heavily manipulated though
Oh look
Another upgrade for Tesla today at 3.. as they try to keep the ballon lifted
Pulling out all the stops to keep her green and enable some volume selling
Looking left on the charts, I see a lot of congestion about here (2735-ish, as I write this). It also looks like the zone of two previous fourth waves of lesser degrees.
Do we pause here, or bust right on through?
That’s can’t be known of course. This is a reasonable level seems to me for a minor 2 to turn. Or…down to the 61.8% at 2695, then a turn. If it goes through that…I’d be guessing that Lara puts one of the alt’s as the main, quick like. 2667 is the 78.6% and would be a great level for the triangle model. Then there’s the 100% at 2631. A long winded way of saying “I don’t know! But I know what I’ll be watching for.” Out fully of my SPY bull put credit spread. Maybe there will be more I could’ve gotten but I hear pigs get slaughtered so… Looking now to properly build a long position as this sell off completes.
This DOW move has the feel that it may get very nasty from here…
I hope not.
Let’s see if 2682.53 is the hold the fort spot!
If this is minor 2 then, as Rodney points out below, this might be a goid place for it to end.
US 30 Year Treasury Crashes to 3.184% and back below key breakout level of 3.26%
Signals to me that is it for Interest Rate Increases for the foreseeable future! Possible the Fed may not increase Fed Funds Rate this month or it will be the last increase for the next 9-10 months of 2019 at a minimum.
TLT has overlapped 61.8% fibos around 118. A very high potential turn level, and it’s also right at the level where this counter-trend move will be the same length as many (most) recent counter trend moves over the last 2 years. If it pushes through that, then more overlapped fibo’s including a 78.6% at 120-121. I have long expiry puts under water…not worried about those. I also have a put credit bull spread, and I’m anxiously waiting for said turn to close the short leg of that.
Spx now in the process of breaching the lower channel line which gives confidence Minor 1 is over and Minor 2 has begun. Remember it requires a breach of a full candlestick and not touching the lower channel line. This is hourly time frame. I am guessing it will take a day or two more to complete Minor 2. That would put us through Friday. Perhaps another Monday morning gap up and go.
I am guessing Minor 2 will complete around 2737 which is the crux of the Minute 4th wave triangle just completed and the 0.382 retracement of Minor 1.
We are probably going to take out the Feb lows….be very careful….
I agree. But the big difference between now and last Feb is that the 200 day MA was once support and has now become resistance. It concerns me that we are unable to breakthrough the 200 dma and stay above it.
I’ve got multiple fibo’s at 2765-66, might turn this (for the moment). Next one down after that is a 61.8% at 2758.
Also, while the channel is busted, the trend line for the multi-day upswing is still in place, with price approaching it.
with a breach like that…….. baby we were born to ruuuuuuuun
get my motor runnin’
head out on the market!
lookin’ for profits
in whatever comes our way!
Markets closed tomorrow (Wed 12/5) for Bush “day of mourning”.
Main count invalidated. In Minor 2 now I believe.
Lara’s analysis is based in SPX (ie cash) hence movements in future doesn’t invalidate the count, it has to go below 2773 in RTH to invalidate the count
Now!
Or one of the alt’s…
Either Minor 1 was over yesterday or Minuette ii of Minute V is still forming and Minor 1 continues. Watch the lower channel line.
IMO each of NDX, RUT and SPX have the “look” on the daily chart level of having a multi-day swing high in place, and have initiated new multi-day swings down. I could absolutely be wrong but I’m peeling off large chunks of my bull put spread in SPX here. If it’s a minor 2…I won’t have chance later, the market’s going much higher after the minor 2. If it’s one of the alt’s…well, I’m golden, because that’ll zap all of my long puts that are underwater and price heads back to the low 2600’s. I’ll keep peeling as more and more confirmation arrives.
RUT particularly looks like it’s “turned”. I’ve put on a bear call credit spread to try to milk it down…then back up!
Bingo, bango, bongo.
Lol