
Upwards movement again continued as the main Elliott wave count expected.
Today the AD line and VIX give a signal for tomorrow’s direction. Fibonacci ratios are used as targets.
Summary: A target for the next wave up is 2,973. For the short term, a small pullback may begin tomorrow to last a few days. Targets are 2,707 (preferred) or 2,678.
The main wave count now expects this bull market to end at the end of December 2018 at the earliest, and possibly in March 2019, at 3,090.
The last gap may provide support at 2,682.53.
New updates to this analysis are in bold.
The biggest picture, Grand Super Cycle analysis, is here.
Last published monthly chart is here, video is here.
MAIN ELLIOTT WAVE COUNT
WEEKLY CHART
Click chart to enlarge.
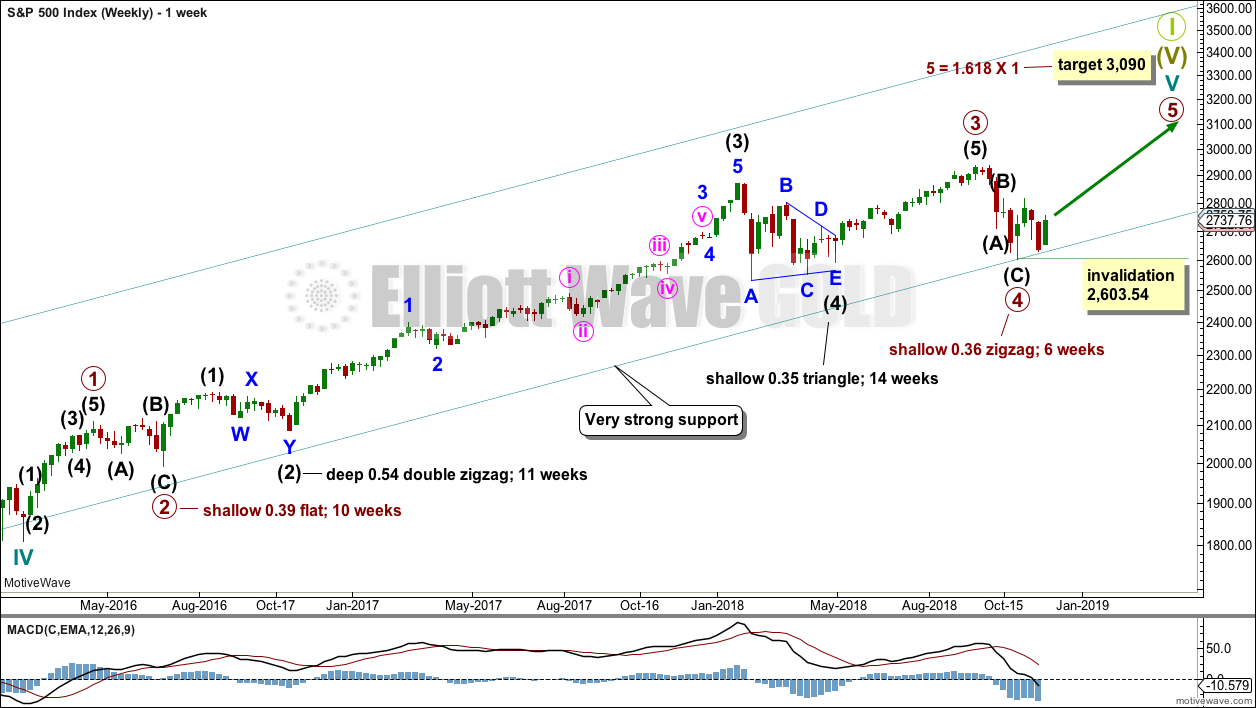
Cycle wave V must complete as a five structure, which should look clear at the weekly chart level and also at the monthly chart level. It may only be an impulse or ending diagonal. It is clear it is an impulse.
Within primary wave 3, there is perfect alternation and excellent proportion between intermediate waves (2) and (4).
Primary wave 4 may have found very strong support about the lower edge of the teal channel. This channel is copied over from the monthly chart and contains the entire bull market since its beginning in March 2009. While Super Cycle wave (V) is incomplete, this channel should not be breached at the weekly chart level.
Draw the teal channel from the high of cycle wave I at 1,343.80 on the week beginning 3rd July 2011, to the high of cycle wave III at 2,079.46 on the week beginning 30th November 2014, and place a parallel copy on the low of cycle wave II at 1,074.77 on the week beginning 2nd October 2011. Draw this chart on a semi-log scale. A small overshoot, like that seen at the end of cycle wave IV, would be entirely acceptable. If price does move below the channel, then it should reverse reasonably quickly.
The proportion between primary waves 2 and 4 is reasonable. Flat corrections tend to be longer lasting structures than zigzags. There would be perfect alternation in structure and inadequate alternation in depth. This is acceptable.
This wave count has the right look at the monthly chart level.
If primary wave 5 ends at or after the end of December 2018 and the AD line fails to make new all time highs, there would then be the minimum required four months of bearish divergence between price and the AD line. If this happens, then the conditions for the end of this bull market would be in place.
A target is calculated for primary wave 5 to end. If primary wave 5 were to be only equal in length with primary wave 1, then it would be truncated. A truncated primary wave 5 would be unlikely as then there could be no bearish divergence with the AD line. The next Fibonacci ratio in the sequence is used to calculate a target for primary wave 5.
Within primary wave 5, no second wave correction may move beyond the start of its first wave below 2,603.54.
DAILY CHART
Click chart to enlarge.
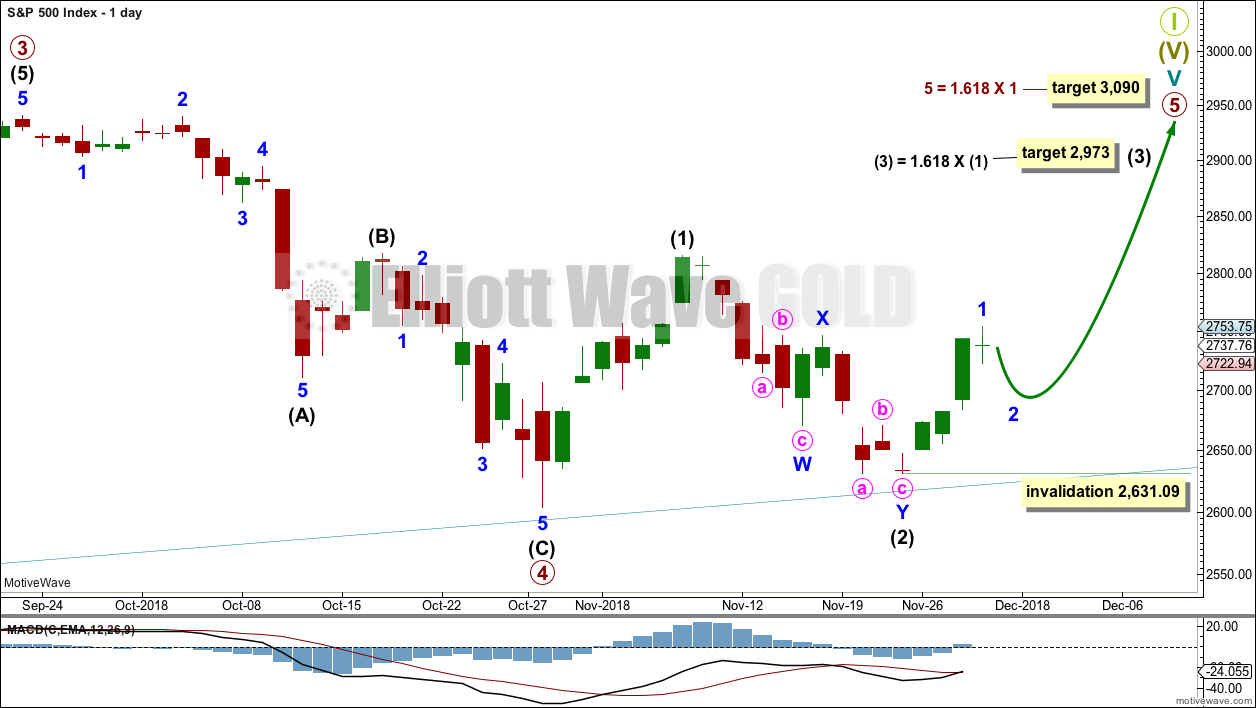
Within primary wave 5, intermediate waves (1) and (2) may be over. Within intermediate wave (3), minor wave 2 may not move beyond the start of minor wave 1 below 2,631.09.
Primary wave 5 may subdivide either as an impulse (more likely) or an ending diagonal (less likely). Intermediate wave (1) may be seen as either a five wave impulse or a three wave zigzag at lower time frames, and so at this stage primary wave 5 could be either an impulse or a diagonal.
For both an impulse and a diagonal, intermediate wave (3) must move above the end of intermediate wave (1).
Primary wave 5 at its end may be expected to exhibit reasonable weakness. At its end, it should exhibit a minimum of 4 months bearish divergence with the AD line, it may exhibit bearish divergence between price and RSI and Stochastics, and it may lack support from volume.
HOURLY CHART
Click chart to enlarge.
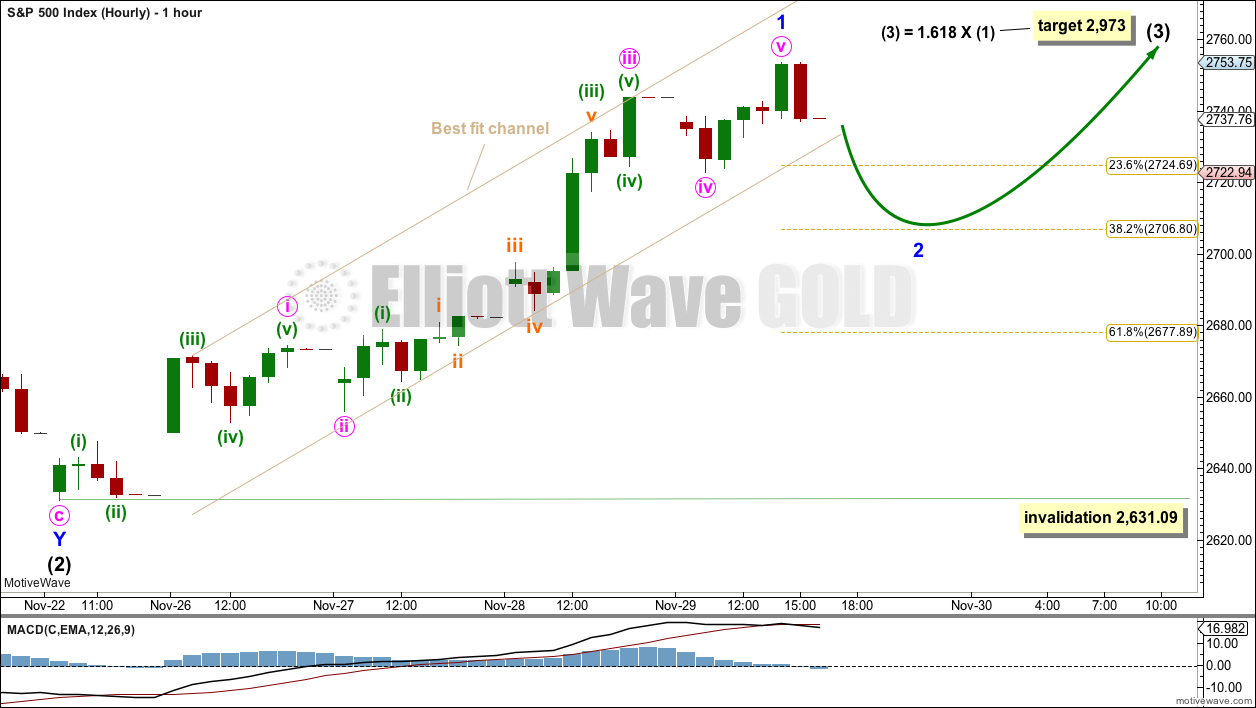
Intermediate wave (3) may only subdivide as an impulse if primary wave 5 subdivides as an impulse.
Within intermediate wave (3), minor wave 1 may now be complete.
The best fit channel is left as it was drawn on yesterday’s chart. This contains all upwards movement so far. When this channel is breached by downwards movement, that may be taken as an indication that minor wave 1 should be over and minor wave 2 should have begun.
Minor wave 2 may be more shallow than second waves often are due to the pull of the middle of a third wave up. The last open gap may also provide support. Minor wave 2 may most likely end about the 0.382 Fibonacci ratio. If it keeps falling through this first target, then the 0.618 Fibonacci ratio would be the next target.
Minor wave 2 may not move beyond the start of minor wave 1 below 2,631.09.
ALTERNATE ELLIOTT WAVE COUNT
WEEKLY CHART
Click chart to enlarge.
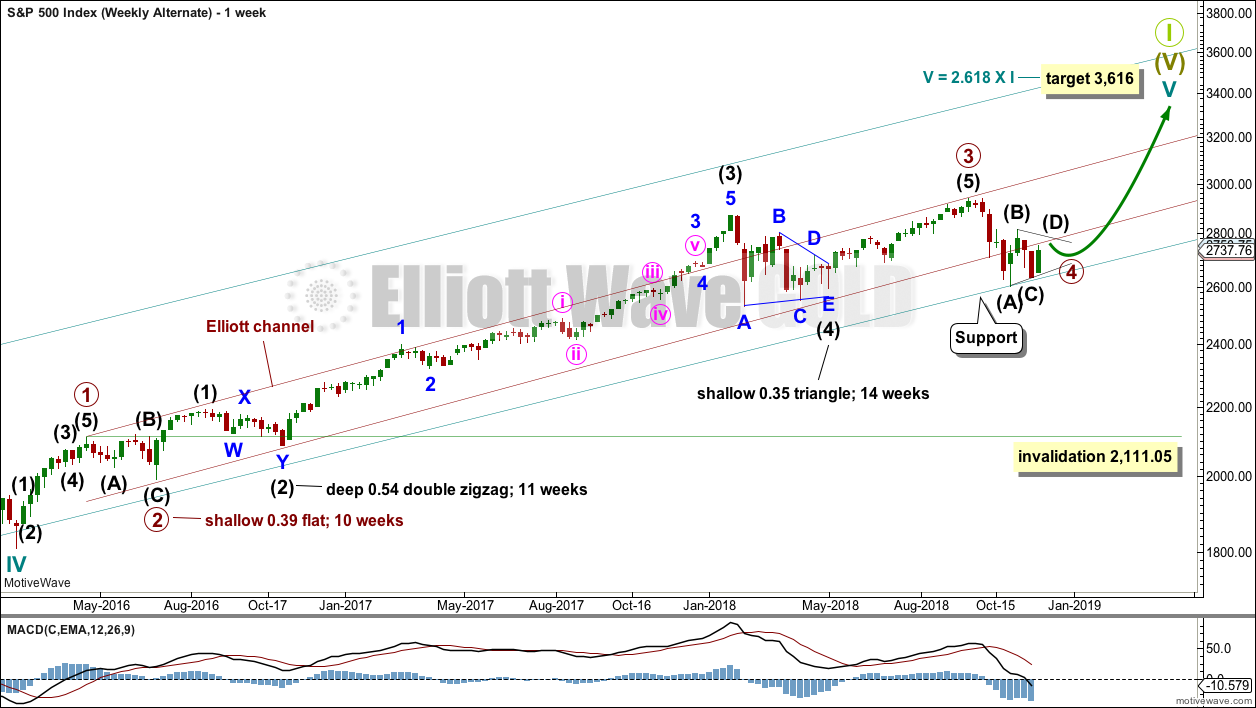
It is also still possible that primary wave 4 may be incomplete. However, at this stage, if primary wave 4 is incomplete and continues for a further several weeks, it would now be out of proportion to primary wave 2. Primary wave 2 lasted 10 weeks. If primary wave 4 is incomplete, then so far it has lasted 10 weeks.
If primary wave 4 is incomplete, then the most likely structures at this stage may be a zigzag, triangle or combination. A double zigzag and flat are discarded based upon the requirement for a large overshoot of the teal trend channel, and poor proportion.
Primary wave 4 may not move into primary wave 1 price territory below 2,111.05.
For this alternate wave count, when primary wave 4 may be complete, then the final target may be calculated at primary degree. At that stage, there may be two targets, or the target may widen to a small zone.
DAILY CHART – ZIGZAG
Click chart to enlarge.
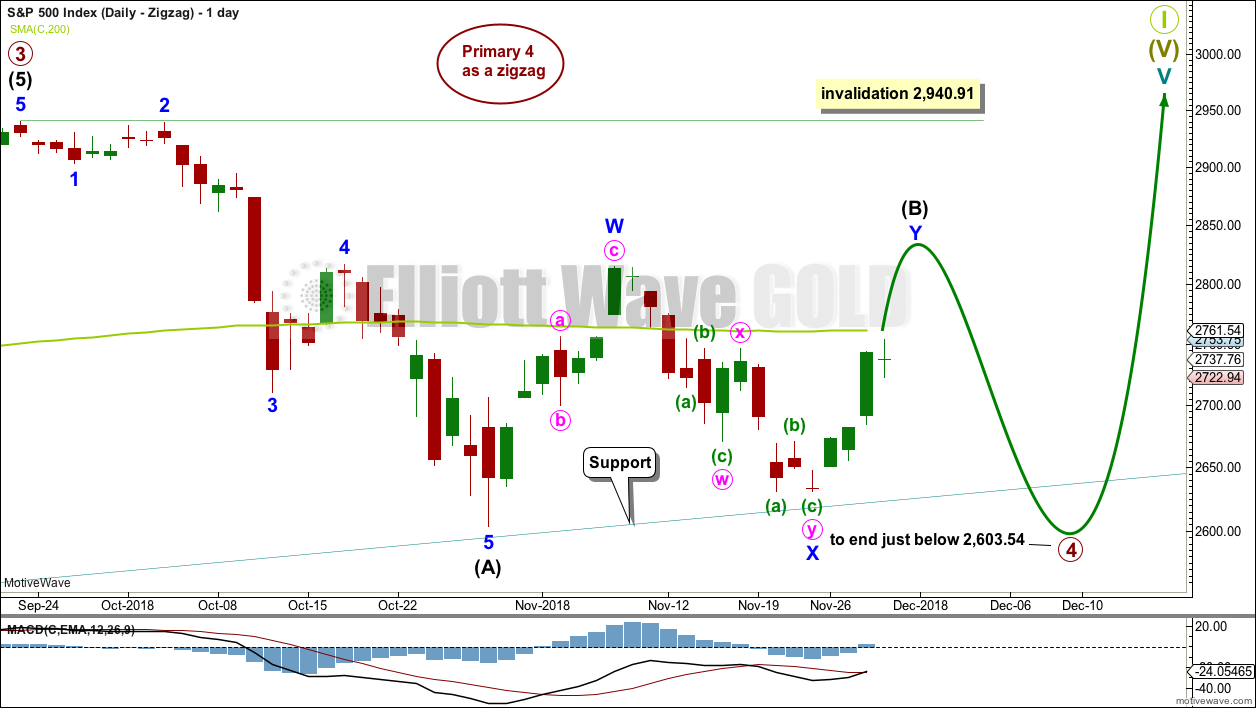
Primary wave 4 may be unfolding as a single zigzag, which is the most common type of corrective structure. This would provide perfect alternation with the flat correction of primary wave 2.
Within the zigzag, intermediate wave (B) may be continuing higher as a double zigzag. Intermediate wave (B) may not move beyond the start of intermediate wave (A) above 2,940.91.
The probability of this wave count is reduced. If intermediate wave (B) is incomplete and intermediate wave (C) has not begun, then this wave count now requires a few more weeks for the structure to complete. If it can do so in just three or four weeks, it may be acceptable.
The longer intermediate wave (B) lasts, the greater the overshoot of the teal trend line required for intermediate wave (C) to move below the end of intermediate wave (A) to avoid a truncation. The probability of this wave count is further reduced for this reason.
DAILY CHART – TRIANGLE
Click chart to enlarge.
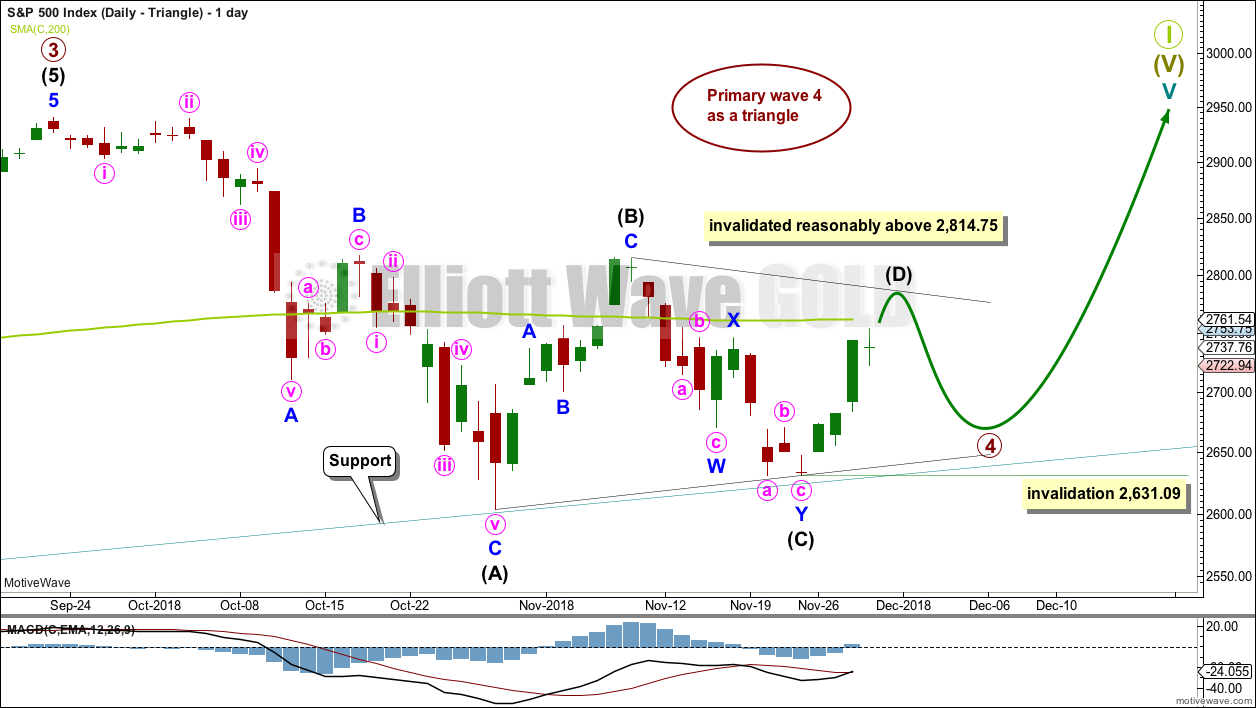
If primary wave 4 unfolds as a triangle, it would have perfect alternation with the regular flat correction of primary wave 2. It would also continue to find support about the lower edge of the teal trend channel. Triangles are fairly common structures for fourth waves.
The triangle is relabelled to see intermediate waves (A), (B) and (C) now all complete. Intermediate wave (B) is shorter than B waves of triangles usually are; this gives the triangle an odd look. However, considering the duration of primary wave 4 so far, this labelling now makes more sense.
Intermediate wave (C) may have completed as a double zigzag. This is the most common triangle sub-wave to subdivide as a multiple.
Price has bounced up off the lower edge of the teal trend channel.
If the triangle is a regular contracting triangle, which is the most common type, then intermediate wave (D) may not move beyond the end of intermediate wave (B) above 2,814.75.
If the triangle is a regular barrier triangle, then intermediate wave (D) may end about the same level as intermediate wave (B). As long as the (B)-(D) trend line remains essentially flat a triangle would remain valid. This invalidation point is not exact; intermediate wave (D) can end very slightly above 2,814.75.
The final wave down for intermediate wave (E) may not move beyond the end of intermediate wave (C) below 2,631.09.
This wave count could see a triangle complete in another four to five weeks, which would see primary wave 4 last a total of 14 or so weeks. This would be reasonably in proportion to the triangle for intermediate wave (4) one degree lower, and this would be acceptable.
This wave count would also see the lower edge of the teal trend channel continue to provide support. This would give the wave count the right look at the weekly and monthly chart levels.
DAILY CHART – COMBINATION
Click chart to enlarge.
This wave count is judged to have only a slightly lower probability than the triangle. If this wave count is correct, then primary wave 4 may be a few weeks longer in duration than primary wave 2. This wave count now has a problem of proportion.
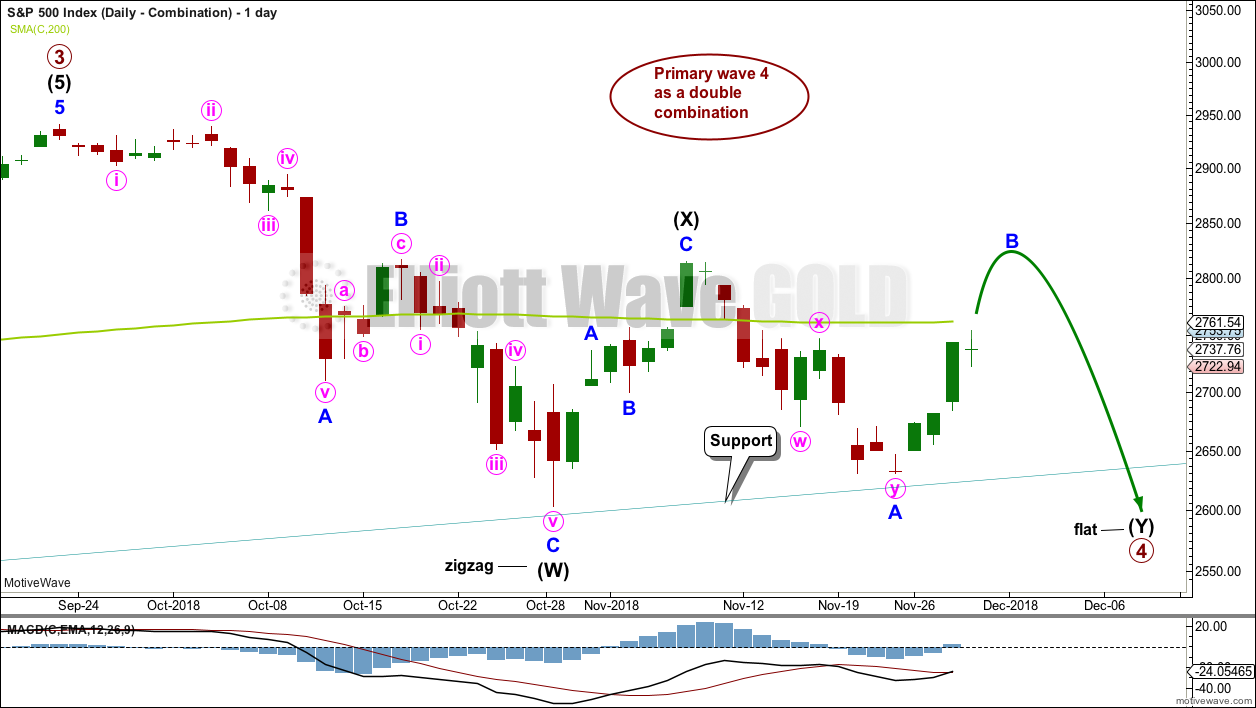
Primary wave 4 may be unfolding as a double combination. The first structure in the double may be a complete zigzag labelled intermediate wave (W). The double may be joined by a three in the opposite direction labelled intermediate wave (X). Intermediate wave (X) may be complete as a single zigzag; it is deep at 0.63 the length of intermediate wave (W), which looks reasonable.
Intermediate wave (Y) would most likely be a flat correction, which should subdivide 3-3-5. At its end, it would now require a reasonable overshoot of the lower edge of the teal trend channel. This further reduces the probability of this wave count.
Within the flat correction of intermediate wave (Y), minor wave B must retrace a minimum 0.9 length of minor wave A at 2,796.74. The common range for minor wave B is from 1 to 1.38 times the length of minor wave A giving a range from 2,815.15 to 2,885.09. Minor wave B may make a new high above the start of minor wave A at 2,815.15 as in an expanded flat.
TECHNICAL ANALYSIS
WEEKLY CHART
Click chart to enlarge. Chart courtesy of et=”_blank”>StockCharts.com.
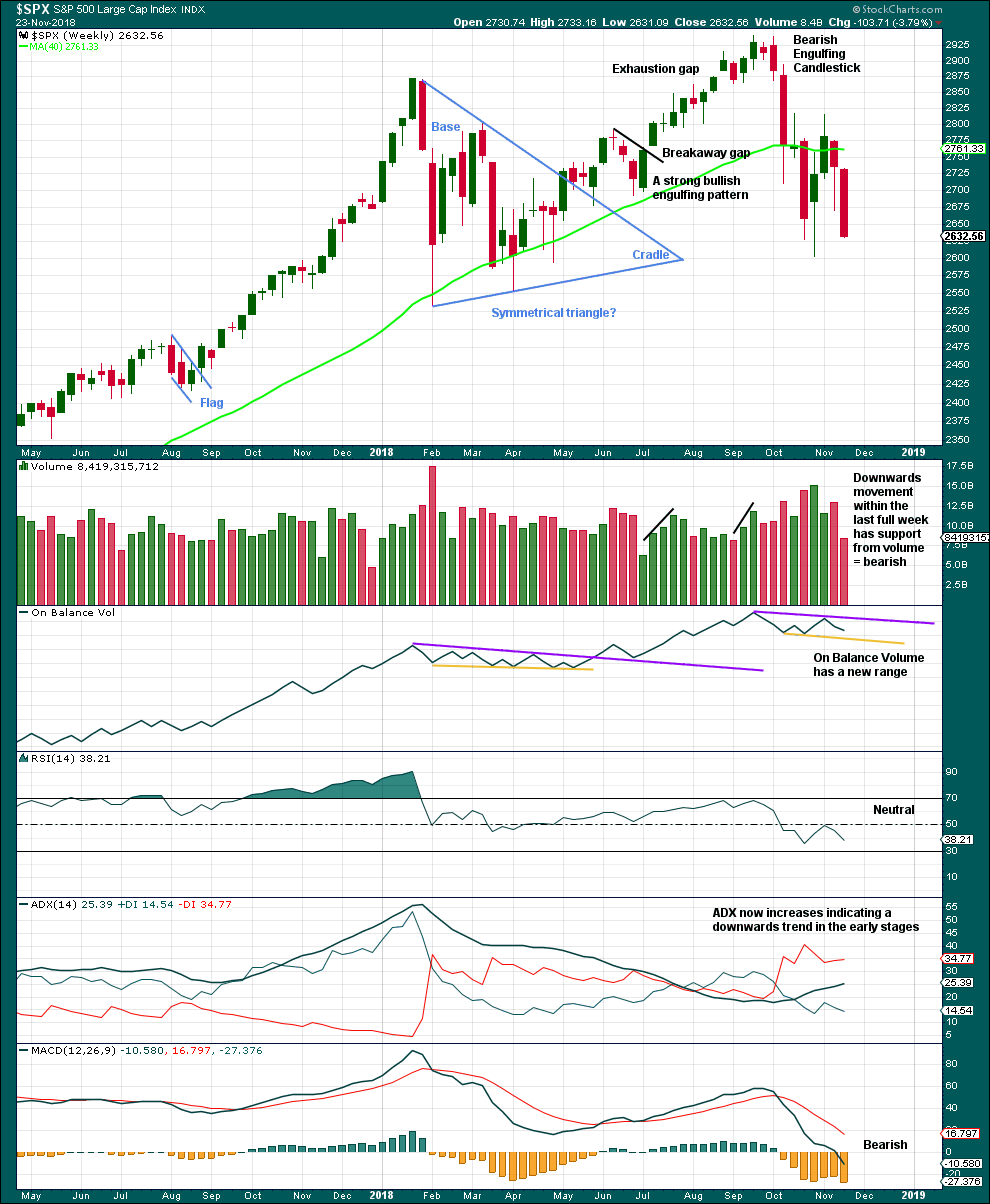
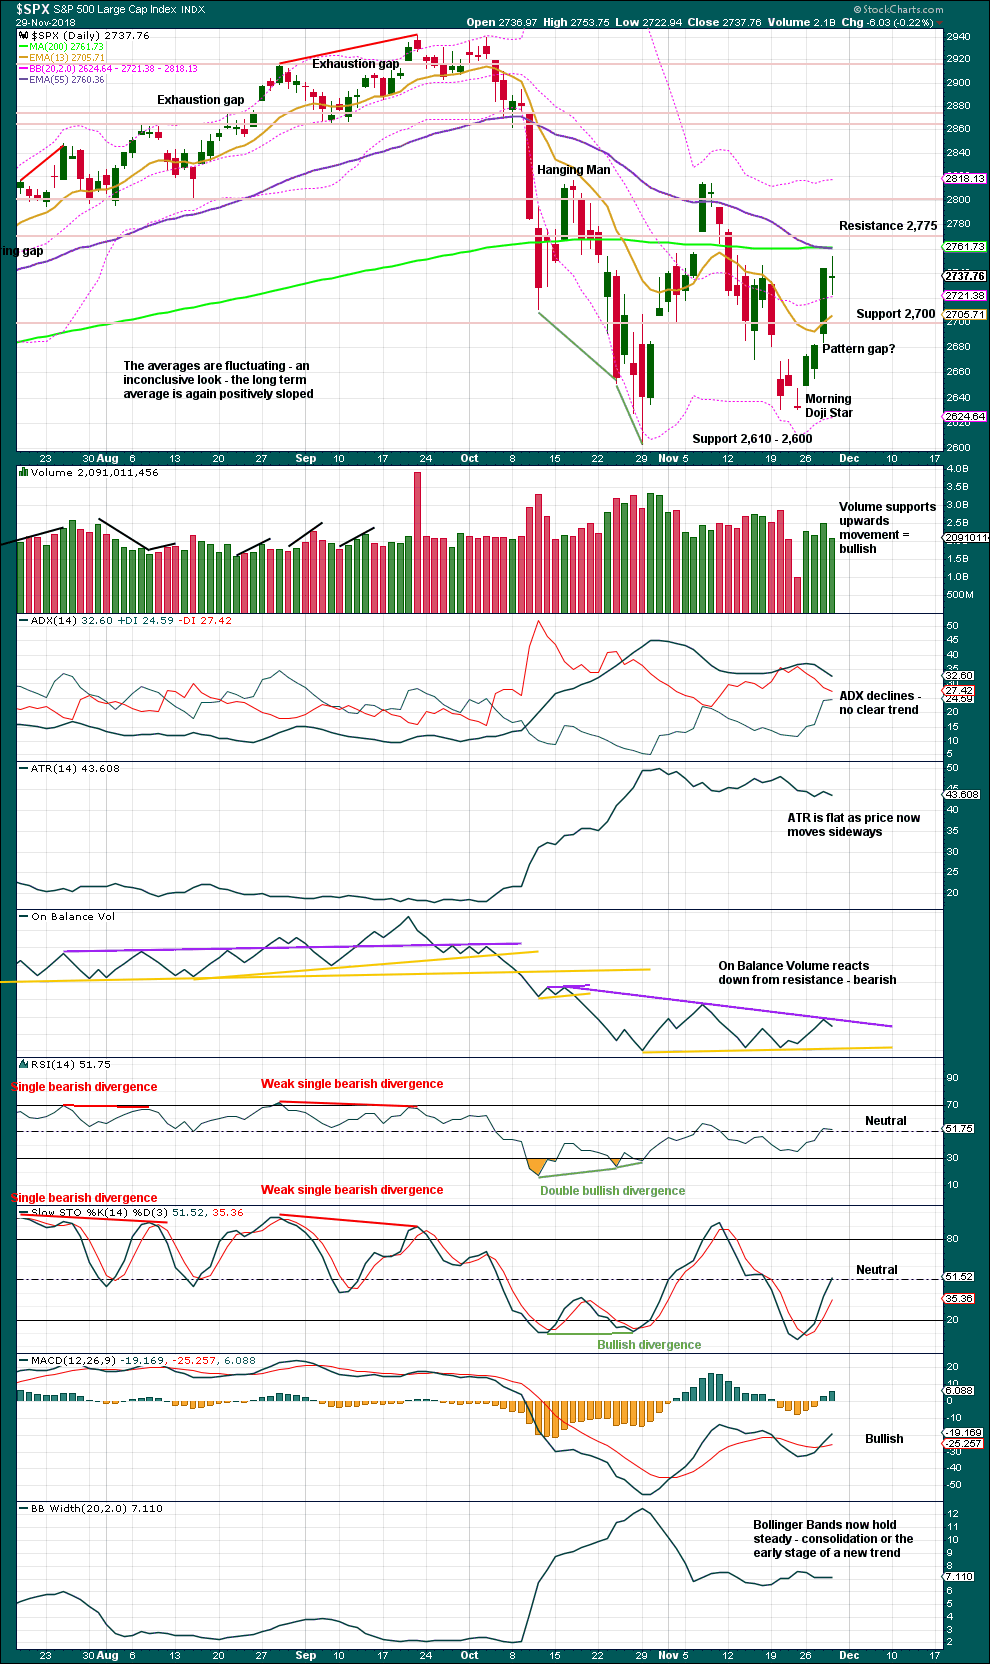
With price closing almost at the low for last week, it looks like this week may move price lower.
Although volume is lighter last week, it was not a full trading week. No conclusion here about last week’s volume shall be drawn.
DAILY CHART
Click chart to enlarge. Chart courtesy of StockCharts.com.
The lower edge of the teal trend channel is not shown on this chart, but it should be considered as part of this technical analysis. Expect that trend line to continue to provide support, until it does not.
The Morning Doji Star (which may also be an Abandoned Baby Bottom) is a strong reversal pattern, which now has strong bullish confirmation. However, candlestick reversal patterns make no comment on how far or for how long the following trend may be.
Price remains essentially range bound with resistance above at 2,775 to 2,815 and support below at 2,610 – 2,600. A breakout of this range is required for confidence in a trend. While price remains within this range, gaps may be pattern gaps.
However, given the strength of the current upwards movement with strong support from volume, this fits the Elliott wave count expectation and so it may be a third wave. An upwards breakout may be imminent. This view is supported by the strongest volume during the consolidation coming on an upwards day.
If the main Elliott wave count is correct, then the last open gap may offer support.
The doji candlestick puts the short-term trend from up into neutral today. The short-term volume profile is still bullish.
BREADTH – AD LINE
WEEKLY CHART
Click chart to enlarge. Chart courtesy of StockCharts.com. So that colour blind members are included, bearish signals
will be noted with blue and bullish signals with yellow.
Last week both price and the AD line have moved lower. There is no short-term divergence at this time frame.
DAILY CHART
Click chart to enlarge. Chart courtesy of StockCharts.com. So that colour blind members are included, bearish signals
will be noted with blue and bullish signals with yellow.
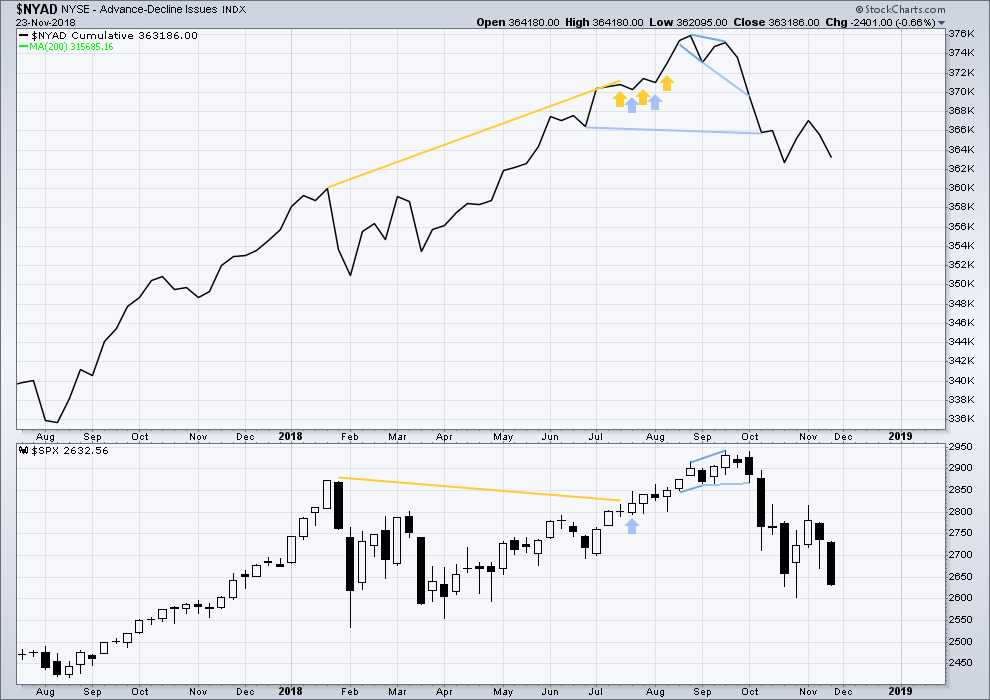
There is normally 4-6 months divergence between price and market breadth prior to a full fledged bear market. This has been so for all major bear markets within the last 90 odd years. With no longer-term divergence yet at this point, any decline in price should be expected to be a pullback within an ongoing bull market and not necessarily the start of a bear market. New all time highs from the AD line on the 29th of August means that the beginning of any bear market may be at the end of December 2018, but it may of course be a lot longer than that.
Breadth should be read as a leading indicator.
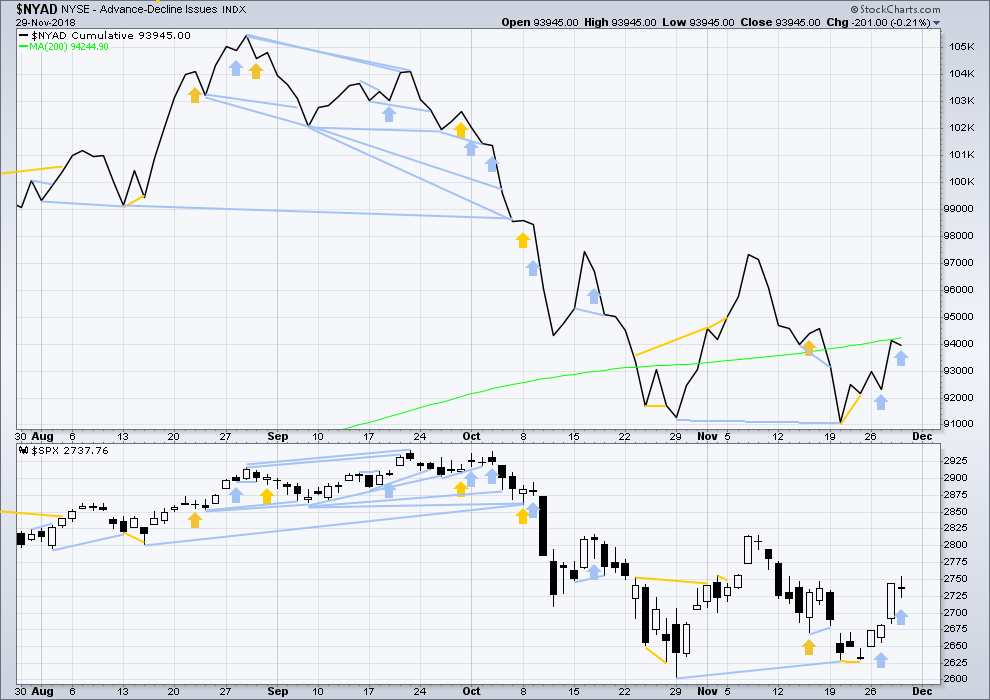
Although the balance of volume was downwards and the candlestick is a doji, which is neutral, price moved higher today with a higher high and a higher low.
The AD line has declined. Upwards movement during this session does not have support from rising market breadth. This short-term bearish divergence supports the hourly Elliott wave count which expects downwards movement tomorrow.
VOLATILITY – INVERTED VIX CHART
WEEKLY CHART
Click chart to enlarge. Chart courtesy of StockCharts.com. So that colour blind members are included, bearish signals
will be noted with blue and bullish signals with yellow.
Last week both price and inverted VIX have moved lower. There is no new short-term divergence at this time frame.
DAILY CHART
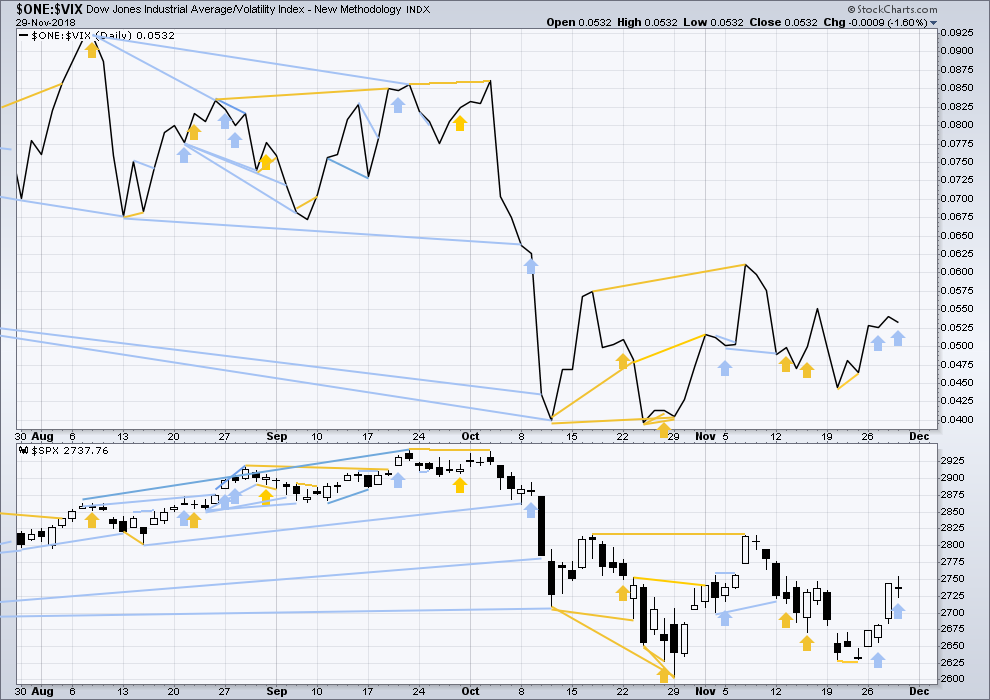
Click chart to enlarge. Chart courtesy of StockCharts.com. So that colour blind members are included, bearish signals
will be noted with blue and bullish signals with yellow.
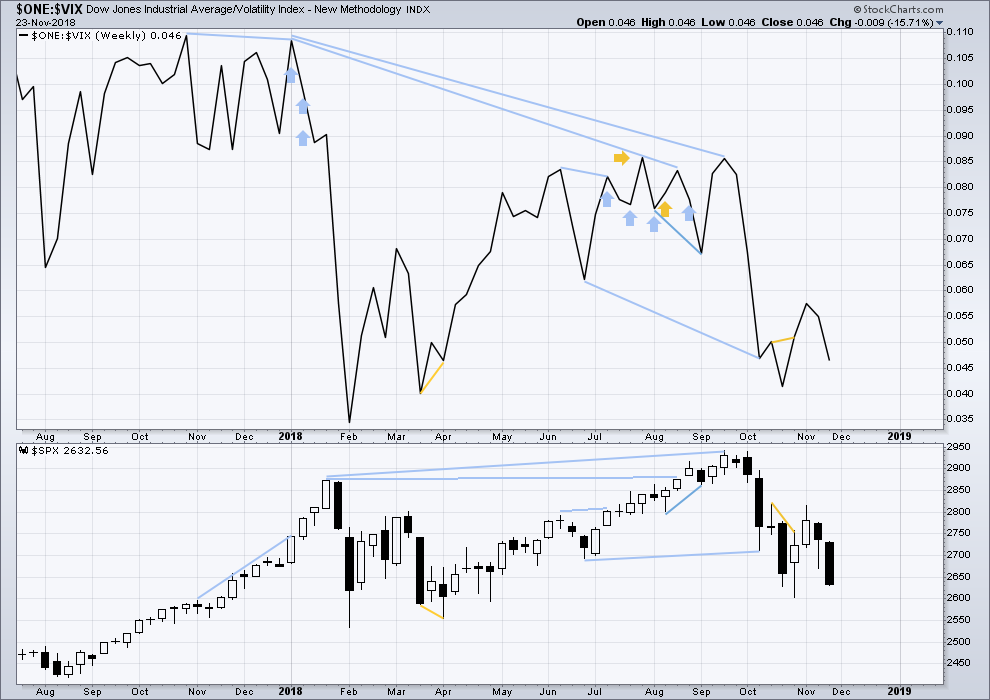
Normally, volatility should decline as price moves higher and increase as price moves lower. This means that normally inverted VIX should move in the same direction as price.
Like the AD line, inverted VIX may now begin to accumulate instances of bearish signals or divergence as a fifth wave at three large degrees comes to an end.
Today price has moved higher, but inverted VIX has moved lower. This short-term divergence is bearish and supports the hourly Elliott wave count.
DOW THEORY
The following lows need to be exceeded for Dow Theory to confirm the end of the bull market and a change to a bear market:
DJIA: 23,344.52.
DJT: 9,806.79.
S&P500: 2,532.69.
Nasdaq: 6,630.67.
Published @ 09:14 p.m. EST.
—
Careful risk management protects your trading account(s).
Follow my two Golden Rules:
1. Always trade with stops.
2. Risk only 1-5% of equity on any one trade.
Please forgive me I am a Newbie…can anyone help me …how did Lara calculate the fibonacci level of 23.6% at 2724.69 ? I am not sure what she used as her start point/level and her end point/level ? I believe wave 2 is anticipated at this level ?
Low of 2631.09 of wave 1 and the high of 2753.75… the diff multiples by 0.236 then substract that from the high of 2753.75
Thank you Hash_trader !
It’s the first of December today down here (livin’ in the future I am) and that means Christmas is almost here! I’m so excited, I really LOVE Christmas.
That also means it’s getting closer to my annual break of two weeks, most necessary for my sanity and to ensure I don’t burn out and can keep up with your daily analysis.
The two weeks covering Christmas and New Years I take off to rest, and I’ll be emailing all members shortly with dates.
May you all be looking forward to Christmas as much as I am and have as much joy and love too 🙂
Thanks so much. I sure hope your time off refreshes and gives lots of joy. You certainly deserve it. Day in and day out all year long. I couldn’t do it for sure. I appreciate it though, quite a bit. So have some fun and be safe for the holidays.
A quiet small range inside day looks to be completing. This may be the first day of minor wave 2.
I’m adjusting the expectation for where it may end to be higher. First target, 0.236 Fibonacci ratio. Next target, 0.382 Fibonacci ratio. Third target, 0.618 Fibonacci ratio.
Lara, as Kevin noticed earlier, it seems like there was a triangle, so that must have been the 4th wave and with new high it seems to be in the final 5th wave???
Or u think that the traingle was b wave??
Thanks.
With the upwards movement since Lara posted the chart can be a ‘b’ wave and make new highs. It can go quite far depending on the pattern observed. But there is a limit as to how high a ‘b’ wave can go, just as you point out.
And I will add it has been a very good week for me. I give my thanks to Lara and all who post here.
Same here Rodney.
Thanks a lot Kevin to point out the traingle.
As triangles are generally 4th wave or b wave, as it can’t be the b wave otherwise c would have been a down move… so it must have been the 4th wave, So the move up has to be the final fifth wave. That’s all.
Anyways a bit tired so will have a look again. Have a great weekend guys.
Oil (/CL, weekly). Definitely at a potential turn spot (78.6^ at 49.6). Next lower is the larger swing 61.8% at 45.6. Though that…and down to 100% at 42.1.
I don’t know what exactly this triangle-ish thing is all about. I just note that it seems to be there…for the moment.
5 minute chart btw. I’m told triangles are almost always continuation structures (and very often “4” waves). Implying here that a break upward will occur. Maaaaybe.
Or B wave
Okay…still implies a break upward as the C wave launches, right? I think so.
It’s wound up all the way now, ABCDE all pretty much there.
Now Lara’s low channel line appears broken (but not fully yet on the hourly).
These are the kinds of days I should just shut down and relax. Chop chop chop!!! Time to withdraw and wait for CLARITY.
I am short RTY today but this my SPX view
Pardon the degree of labeling
The news feed has had few spikes in last few days, seems algo sensitive.. if the news is good from the G20 over the weekend. I guess it can be over 2800 in a hurry…
So may be the correction to be over today with a red close?? Let’s see
Strangely enough, if the market goes UP here today or Monday…that would tend to indicate the P4 is NOT over, while the market moving down in a minor 2 would tend to indicate the P4 IS over. If I’m reading the different wave count model’s correctly.
I continue to focus on NDX. Signs so far are that it’s turning off it’s major downtrend line and 38% fibo. Waiting now to see some sell triggers to give “confirmation” (added evidence). If that happens, I’m sure SPX will be doing a similar minor 2 down, and it’ll be a few days of down here overall.
Kevin,
Why are you saying, “if the market goes up here today or Monday…that would tend to indicate that P4 is NOT over” ?
I am not sure I follow your logic. It seems to me any upward wave will subdivide and show corrections whether it is P5 or P4.
On the run today. Have a good one.
Probably because I didn’t analyze it deep enough Rodney, i.e., I’m likely wrong.
My think was that if we are in the main (P5 in progress) then we should be initiating a minor 2 down of the intermediate 1 of the P5. If we are in one of the alternates…then more up is expected within the ongoing P4.
I suppose under the main (P5 in progress), there could be more up in the first minor 1 up. I was leaning on Lara’s highest probability call that that minor 1 is over at yesterday’s top, which structurally makes a lot of sense to me.
The main count now sees minor waves 1-2-3 unfolding higher, currently looking for a little pullback for minor wave 2.
The alternates: the zigzag sees minor wave Y unfolding higher, subdividing minute a-b-c, currently looking for a little pullback for minute wave b. I’ll add these labels to the daily chart so it is clearer for you all.
The alternate triangle daily chart: sees intermediate (D) unfolding higher as a zigzag, labelled minor A-B-C, currently looking for a little pullback for minor wave B.
The alternate combination daily chart: sees minor wave B unfolding higher as a zigzag, labelled minute a-b-c, currently looking for a little pullback for minute wave b.
So the subdivisions on the hourly chart are all the same, just different degrees of labelling. 1-2-3 of an impulse subdivides 5-3-5, exactly the same as A-B-C of a zigzag. No difference.
Another NDX test of the trend line/38% fibo…another reject.
I’m not making any bets at the moment on which way it’s going to go…but if you forced me to make a call, I’d say it’s going to bust up and through today, at this point. 55%-45% odds only though!
Now I’m seeing what looks like a small timeframe wave 5 ending diagonal in NDX. I change my call (again!) to this more likely breaking to the downside…
If you bought those puts, DBG!
Or as we say in the posse trading room: De-bug!!
It of course means “Don’t be Greedy!” Ring it at the open!
We hit serious resistance yesterday around the 200 dsma.
RUT already in a death cross.
The cabal is running out of trick plays.
We have had tax cuts to fuel buybacks, dovish Fedspeak, and will probably get another one this week-end. Trump will announce some kind of trade deal after his meeting with Xi and the algos are going to run wild. I would not be surprised to see futures up 100 handles Sunday evening. But first, a bear trap today. We know how they roll!
Have a great week-end all! 🙂
Hola!
Hola!
You got me by mere minutes.
Also the tequila must be really good because “abandoned baby bottom” is making me laugh ….. a lot
You need to round up a group of tequila drinkers there on a quest to SAVE THE ABANDONED BABY BOTTOM Peter! If you can’t get takers…ya’ll need more tequila!!
Well, TBF, it is really one of the more humorous pattern names 🙂