Upwards movement was expected as most likely for Wednesday. The target on the main Elliott wave count remains the same.
Summary: A target for the next wave up is 2,973. Some reasonable confidence in an upwards trend may be had today.
The main wave count now expects this bull market to end at the end of December 2018 at the earliest, and possibly in March 2019, at 3,090.
Volume is strongly supporting upwards movement. The gap open today may provide support at 2,682.53.
New updates to this analysis are in bold.
The biggest picture, Grand Super Cycle analysis, is here.
Last published monthly chart is here, video is here.
MAIN ELLIOTT WAVE COUNT
WEEKLY CHART
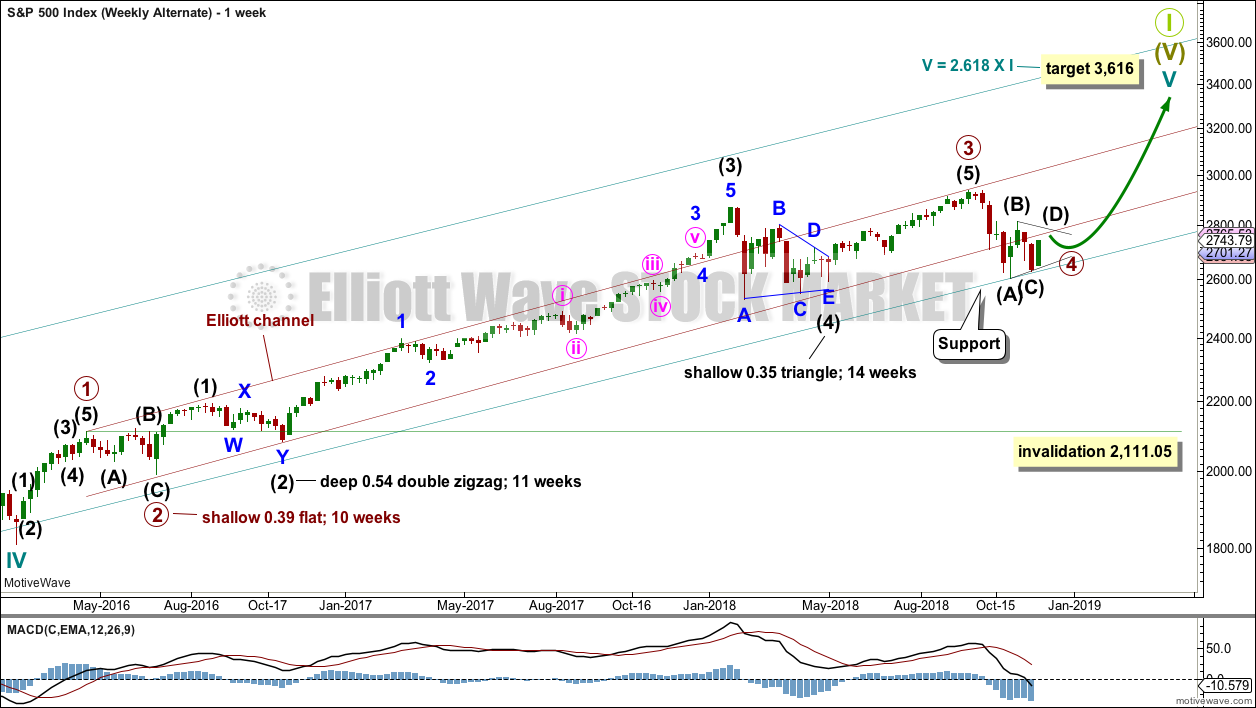
Cycle wave V must complete as a five structure, which should look clear at the weekly chart level and also at the monthly chart level. It may only be an impulse or ending diagonal. It is clear it is an impulse.
Within cycle wave V, the third waves at all degrees may only subdivide as impulses.
Within primary wave 3, there is perfect alternation and excellent proportion between intermediate waves (2) and (4).
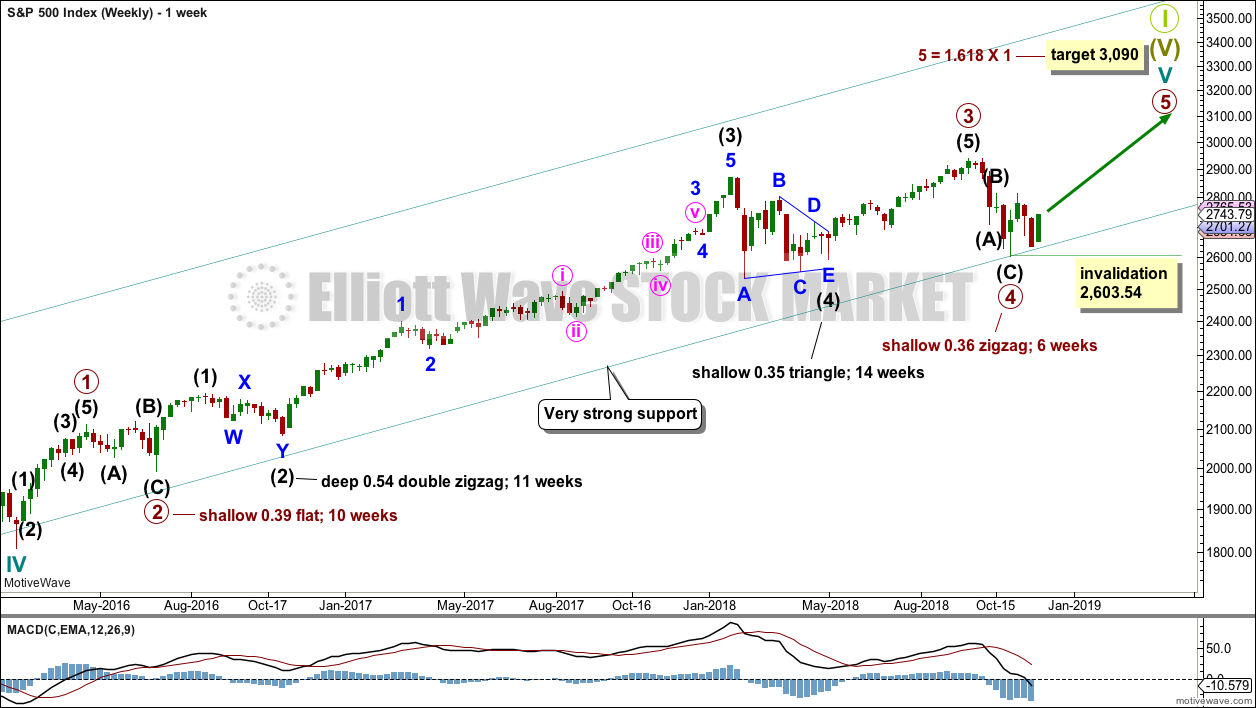
Primary wave 4 may have found very strong support about the lower edge of the teal channel. This channel is copied over from the monthly chart and contains the entire bull market since its beginning in March 2009. While Super Cycle wave (V) is incomplete, this channel should not be breached at the weekly chart level.
Draw the teal channel from the high of cycle wave I at 1,343.80 on the week beginning 3rd July 2011, to the high of cycle wave III at 2,079.46 on the week beginning 30th November 2014, and place a parallel copy on the low of cycle wave II at 1,074.77 on the week beginning 2nd October 2011. Draw this chart on a semi-log scale. A small overshoot, like that seen at the end of cycle wave IV, would be entirely acceptable. If price does move below the channel, then it should reverse reasonably quickly.
The proportion between primary waves 2 and 4 is reasonable. Flat corrections tend to be longer lasting structures than zigzags. There would be perfect alternation in structure and inadequate alternation in depth. This is acceptable.
This wave count has the right look at the monthly chart level.
If primary wave 5 ends at or after the end of December 2018 and the AD line fails to make new all time highs, there would then be the minimum required four months of bearish divergence between price and the AD line. If this happens, then the conditions for the end of this bull market would be in place.
A target is calculated for primary wave 5 to end. If primary wave 5 were to be only equal in length with primary wave 1, then it would be truncated. A truncated primary wave 5 would be unlikely as then there could be no bearish divergence with the AD line. The next Fibonacci ratio in the sequence is used to calculate a target for primary wave 5.
Within primary wave 5, no second wave correction may move beyond the start of its first wave below 2,603.54.
DAILY CHART
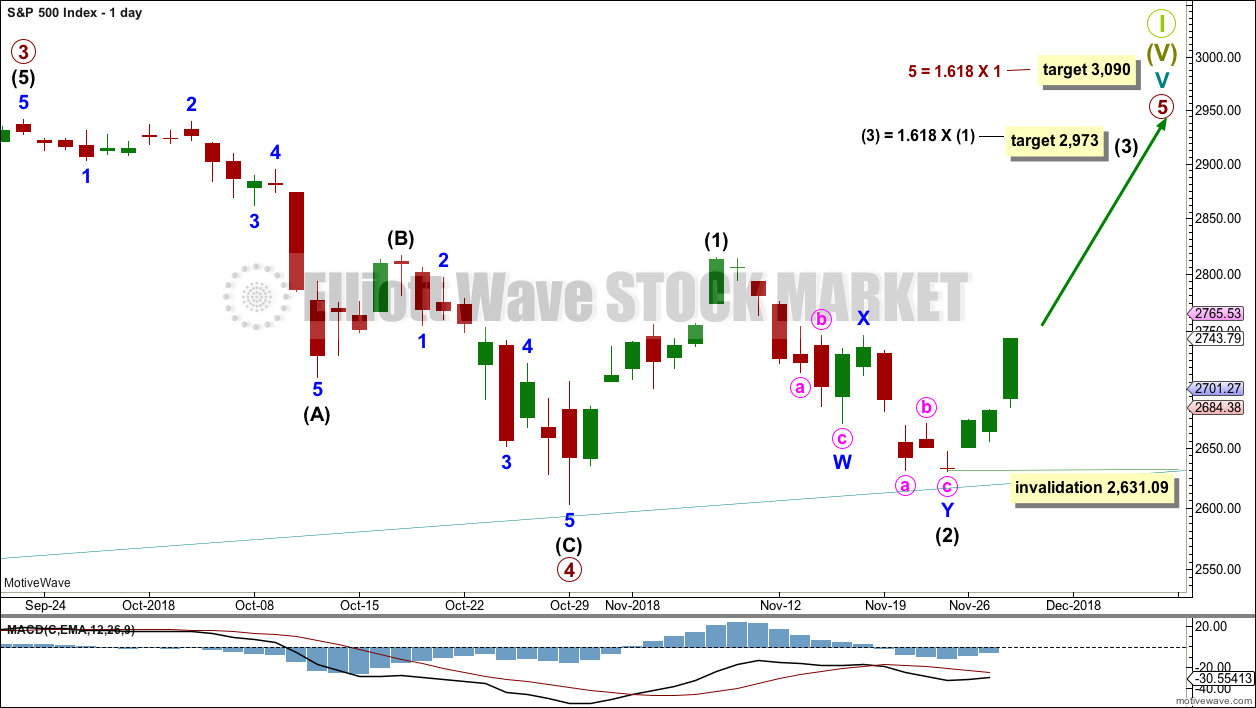
Within primary wave 5, intermediate waves (1) and (2) may be over. Within intermediate wave (3), minor wave 2 may not move beyond the start of minor wave 1 below 2,631.09.
Primary wave 5 may subdivide either as an impulse (more likely) or an ending diagonal (less likely). Intermediate wave (1) may be seen as either a five wave impulse or a three wave zigzag at lower time frames, and so at this stage primary wave 5 could be either an impulse or a diagonal.
For both an impulse and a diagonal, intermediate wave (3) must move above the end of intermediate wave (1).
Primary wave 5 at its end may be expected to exhibit reasonable weakness. At its end, it should exhibit a minimum of 4 months bearish divergence with the AD line, it may exhibit bearish divergence between price and RSI and Stochastics, and it may lack support from volume.
HOURLY CHART
Intermediate wave (3) may only subdivide as an impulse if primary wave 5 subdivides as an impulse.
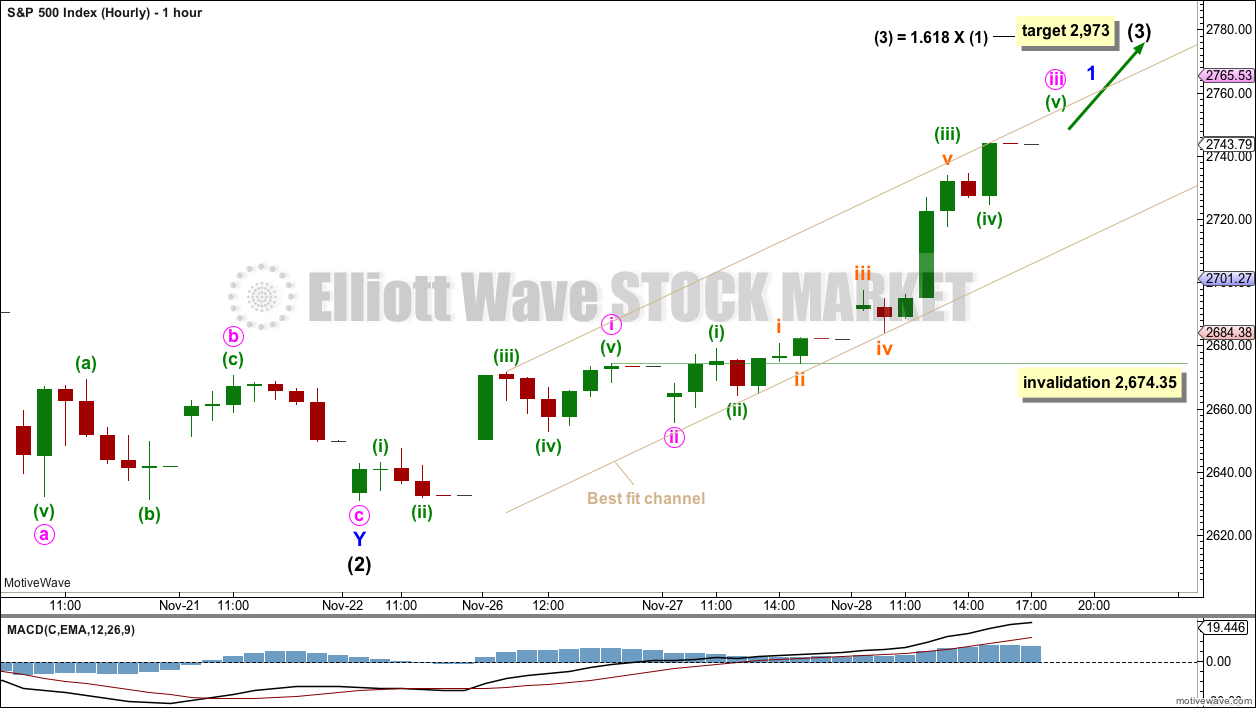
Within intermediate wave (3), minor wave 1 may be incomplete.
Within minor wave 1, minute waves i and ii may be complete. Minute wave iii may be complete at today’s high, or it may continue higher when markets open tomorrow. Minute wave iv may not move into minute wave i price territory below 2,674.35.
Further confidence in this wave count may be had now that price has made a new high above 2,685.75.
Keep adjusting the best fit channel as price moves higher. Draw the first trend line from the high of minuette wave (iii) within minute wave i, to the last high, then push a parallel copy down so that it contains as much of this upwards movement as possible. The lower edge of this channel may provide support while minor wave 1 continues higher. When this channel is breached by downwards movement, that may be used as an indication that minor wave 1 may be over and minor wave 2 may have begun.
ALTERNATE ELLIOTT WAVE COUNT
WEEKLY CHART
It is also still possible that primary wave 4 may be incomplete. However, at this stage, if primary wave 4 is incomplete and continues for a further several weeks, it would now be out of proportion to primary wave 2. Primary wave 2 lasted 10 weeks. If primary wave 4 is incomplete, then so far it has lasted 10 weeks.
If primary wave 4 is incomplete, then the most likely structures at this stage may be a zigzag, triangle or combination. A double zigzag and flat are today discarded based upon the requirement for a large overshoot of the teal trend channel, and poor proportion.
Primary wave 4 may not move into primary wave 1 price territory below 2,111.05.
For this alternate wave count, when primary wave 4 may be complete, then the final target may be calculated at primary degree. At that stage, there may be two targets, or the target may widen to a small zone.
DAILY CHART – ZIGZAG
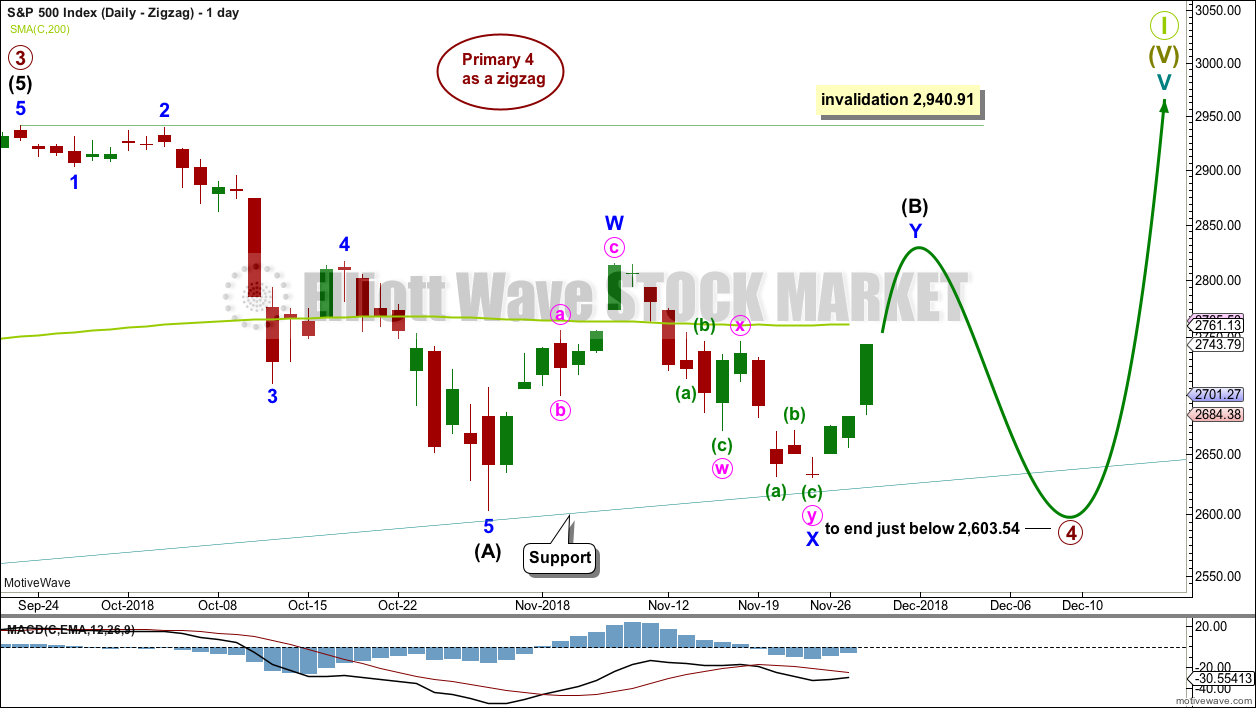
Primary wave 4 may be unfolding as a single zigzag, which is the most common type of corrective structure. This would provide perfect alternation with the flat correction of primary wave 2.
Within the zigzag, intermediate wave (B) may be continuing higher as a double zigzag. Intermediate wave (B) may not move beyond the start of intermediate wave (A) above 2,940.91.
The probability of this wave count is today reduced. If intermediate wave (B) is incomplete and intermediate wave (C) has not begun, then this wave count now requires a few more weeks for the structure to complete. If it can do so in just three or four weeks, it may be acceptable.
The longer intermediate wave (B) lasts, the greater the overshoot of the teal trend line required for intermediate wave (C) to move below the end of intermediate wave (A) to avoid a truncation. The probability of this wave count is further reduced for this reason.
DAILY CHART – TRIANGLE
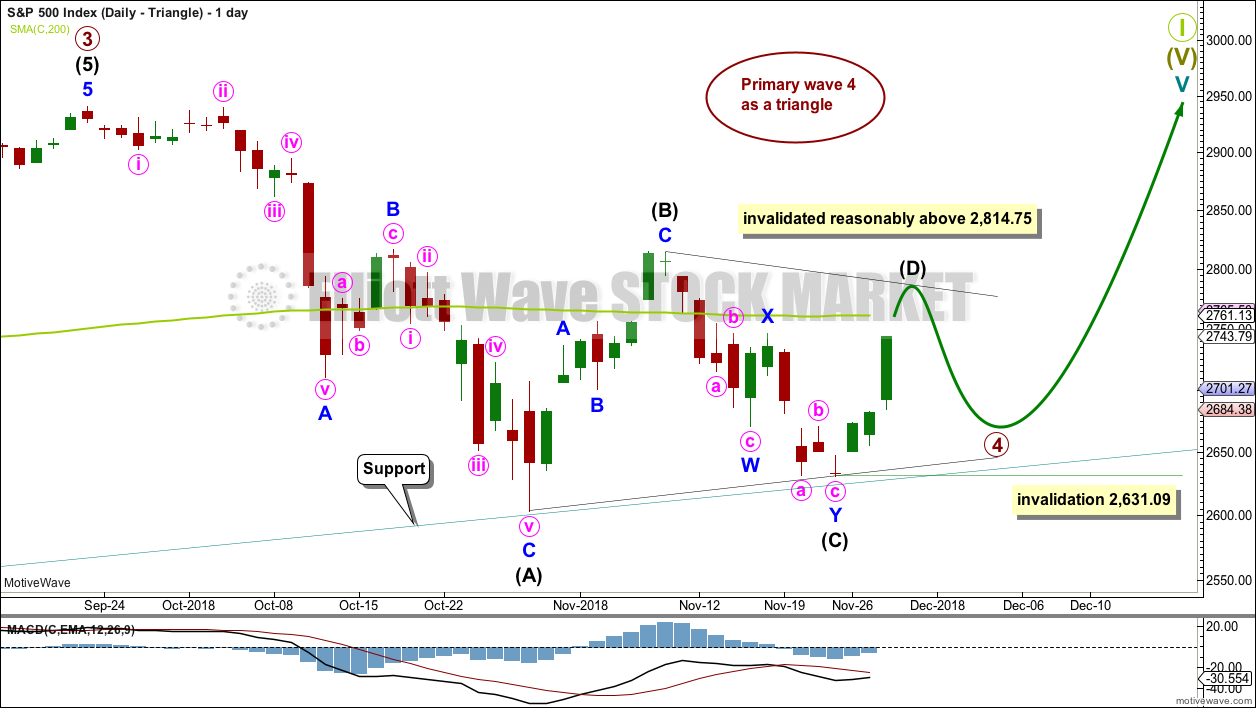
If primary wave 4 unfolds as a triangle, it would have perfect alternation with the regular flat correction of primary wave 2. It would also continue to find support about the lower edge of the teal trend channel. Triangles are fairly common structures for fourth waves.
The triangle is relabelled to see intermediate waves (A), (B) and (C) now all complete. Intermediate wave (B) is shorter than B waves of triangles usually are; this gives the triangle an odd look. However, considering the duration of primary wave 4 so far, this labelling now makes more sense.
Intermediate wave (C) may have completed as a double zigzag. This is the most common triangle sub-wave to subdivide as a multiple.
Price has bounced up off the lower edge of the teal trend channel.
If the triangle is a regular contracting triangle, which is the most common type, then intermediate wave (D) may not move beyond the end of intermediate wave (B) above 2,814.75.
If the triangle is a regular barrier triangle, then intermediate wave (D) may end about the same level as intermediate wave (B). As long as the (B)-(D) trend line remains essentially flat a triangle would remain valid. This invalidation point is not exact; intermediate wave (D) can end very slightly above 2,814.75.
The final wave down for intermediate wave (E) may not move beyond the end of intermediate wave (C) below 2,631.09.
This wave count could see a triangle complete in another four to five weeks, which would see primary wave 4 last a total of 14 or so weeks. This would be reasonably in proportion to the triangle for intermediate wave (4) one degree lower, and this would be acceptable.
This wave count would also see the lower edge of the teal trend channel continue to provide support. This would give the wave count the right look at the weekly and monthly chart levels.
DAILY CHART – COMBINATION
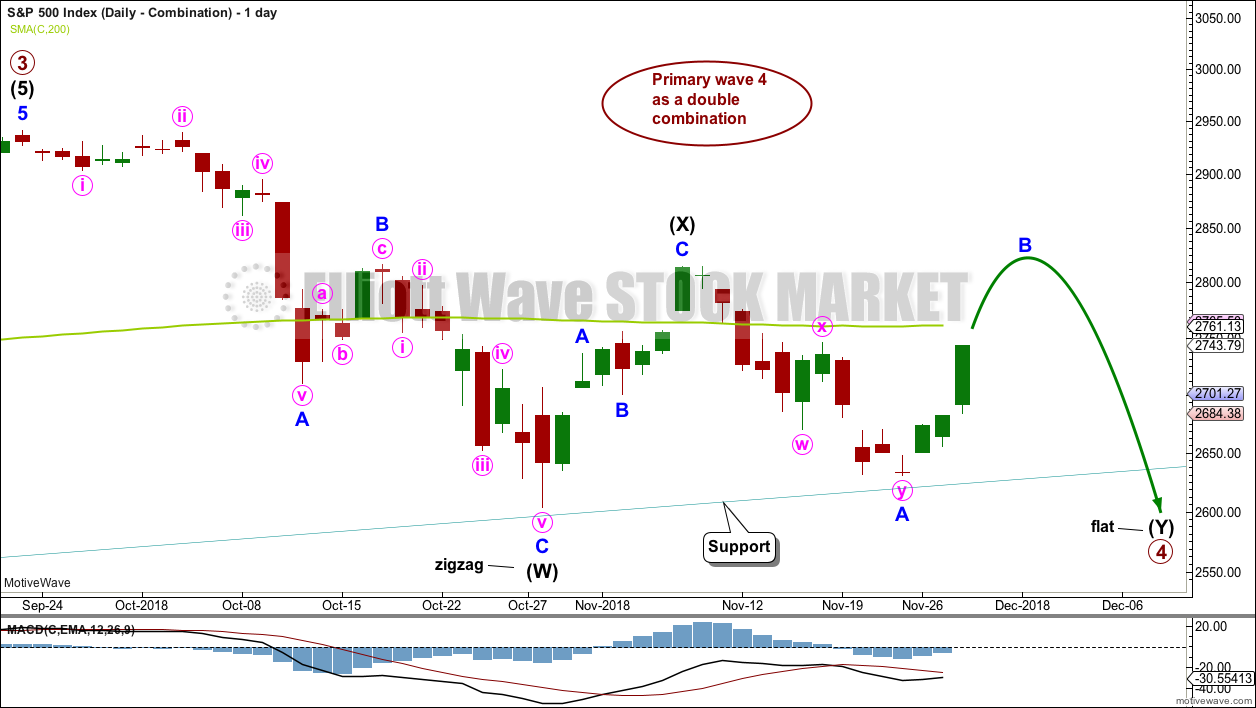
This wave count is judged to have only a slightly lower probability than the triangle. If this wave count is correct, then primary wave 4 may be a few weeks longer in duration than primary wave 2. This wave count now has a problem of proportion.
Primary wave 4 may be unfolding as a double combination. The first structure in the double may be a complete zigzag labelled intermediate wave (W). The double may be joined by a three in the opposite direction labelled intermediate wave (X). Intermediate wave (X) may be complete as a single zigzag; it is deep at 0.63 the length of intermediate wave (W), which looks reasonable.
Intermediate wave (Y) would most likely be a flat correction, which should subdivide 3-3-5. At its end, it would now require a reasonable overshoot of the lower edge of the teal trend channel. This further reduces the probability of this wave count.
Within the flat correction of intermediate wave (Y), minor wave B must retrace a minimum 0.9 length of minor wave A at 2,796.74. The common range for minor wave B is from 1 to 1.38 times the length of minor wave A giving a range from 2,815.15 to 2,885.09. Minor wave B may make a new high above the start of minor wave A at 2,815.15 as in an expanded flat.
TECHNICAL ANALYSIS
WEEKLY CHART
Click chart to enlarge. Chart courtesy of et=”_blank”>StockCharts.com.
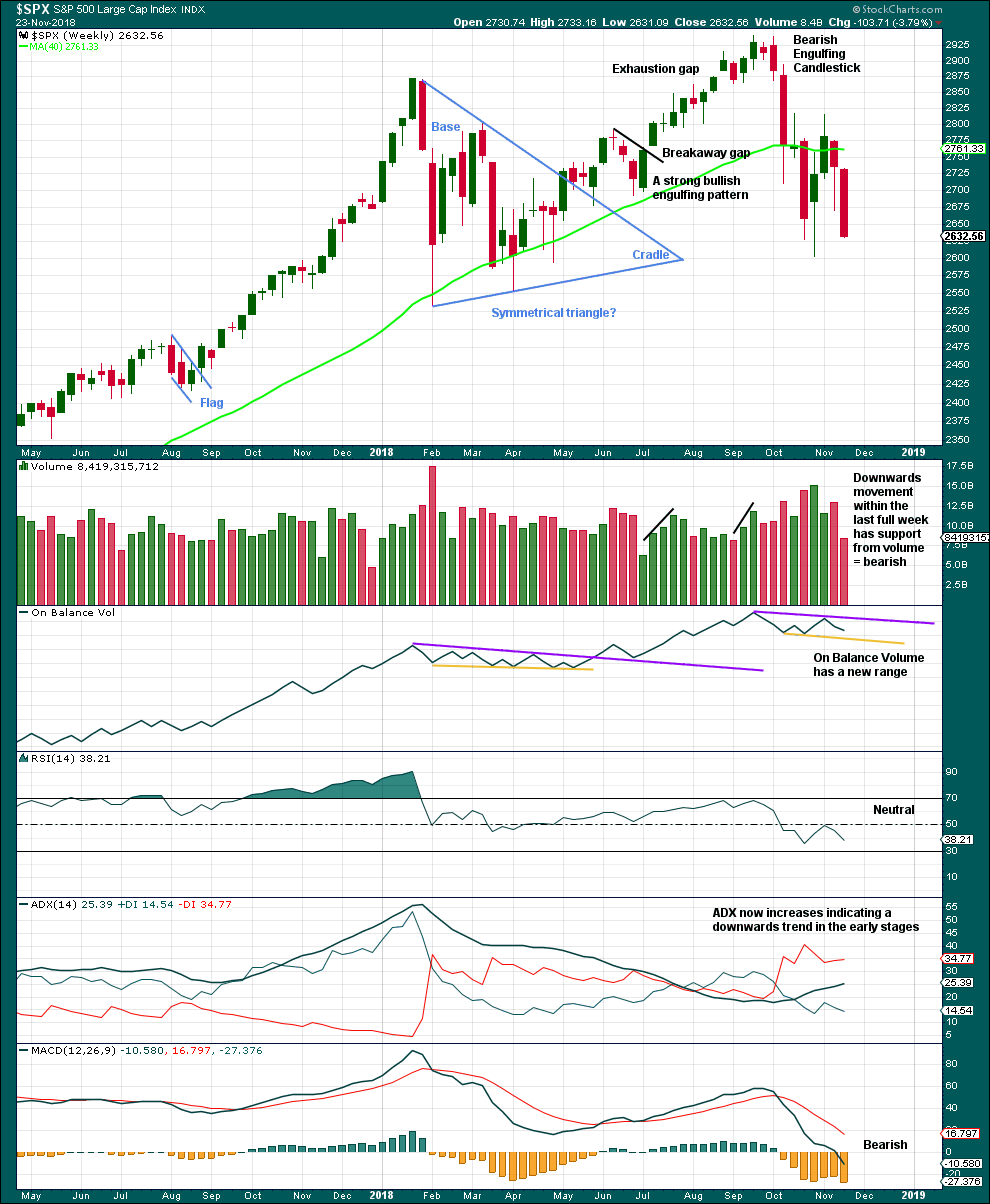
With price closing almost at the low for last week, it looks like this week may move price lower.
Although volume is lighter last week, it was not a full trading week. No conclusion here about last week’s volume shall be drawn.
DAILY CHART
Click chart to enlarge. Chart courtesy of StockCharts.com.
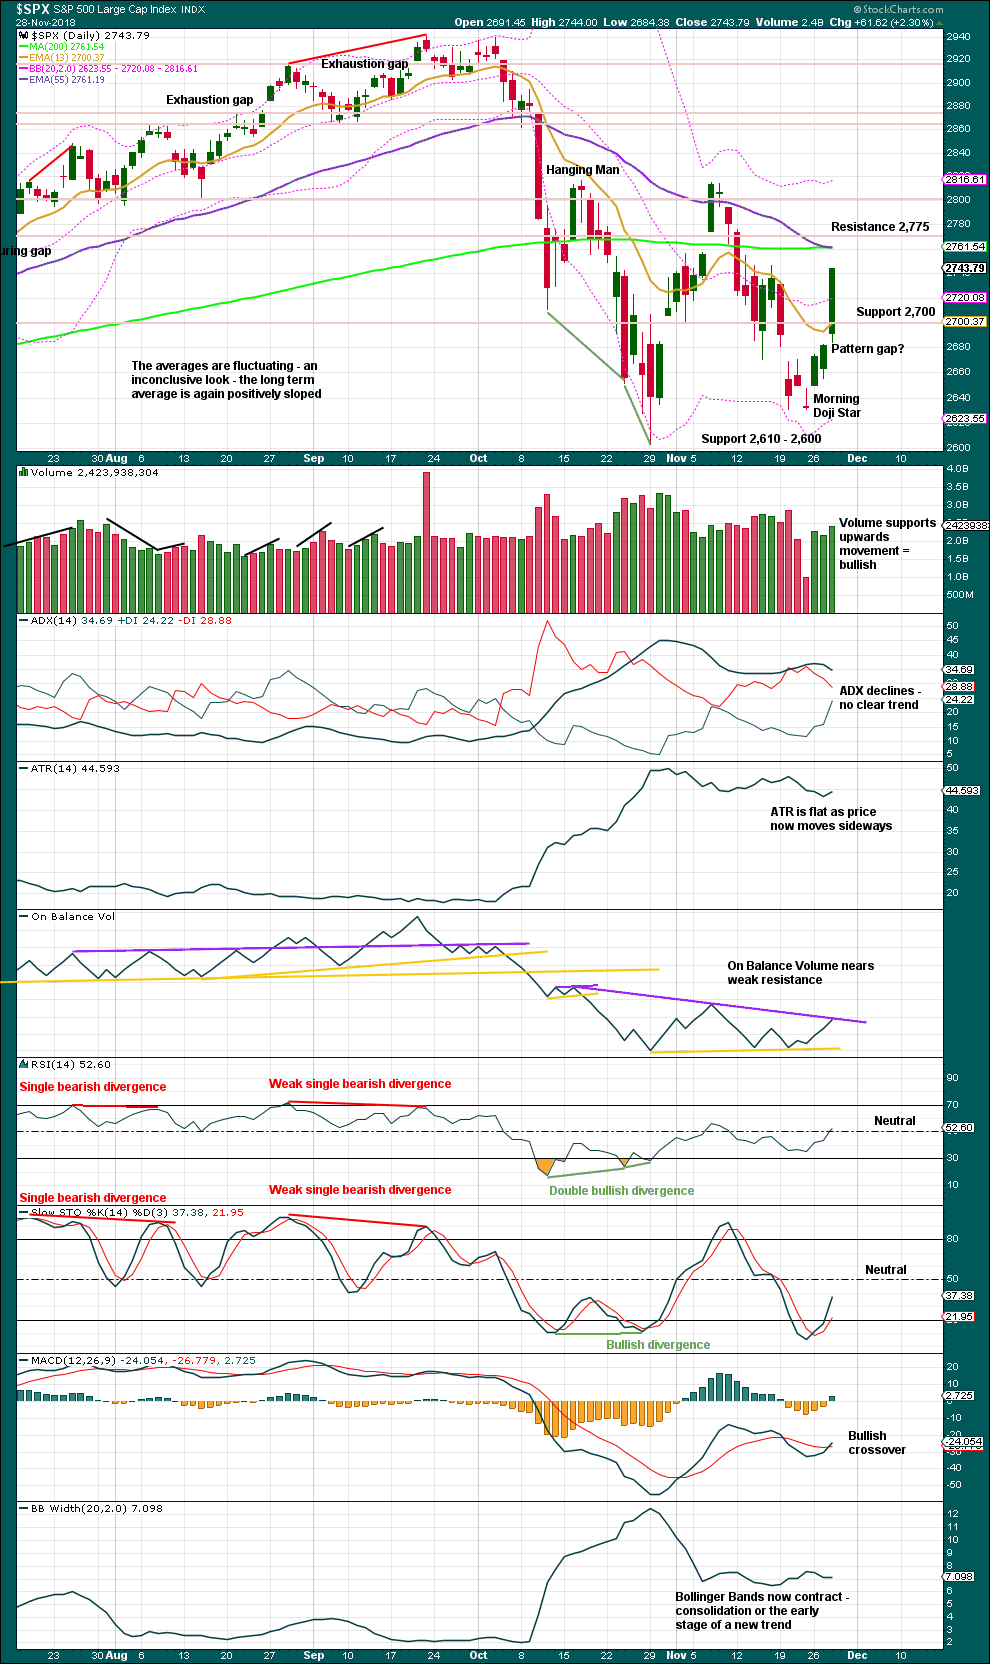
The lower edge of the teal trend channel is not shown on this chart, but it should be considered as part of this technical analysis. Expect that trend line to continue to provide support, until it does not.
The Morning Doji Star (which may also be an Abandoned Baby Bottom) is a strong reversal pattern, which now has strong bullish confirmation. However, candlestick reversal patterns make no comment on how far or for how long the following trend may be.
Price remains essentially range bound with resistance above at 2,775 to 2,815 and support below at 2,610 – 2,600. A breakout of this range is required for confidence in a trend. While price remains within this range, gaps may be pattern gaps.
However, given the strength of the current upwards movement with strong support from volume, this fits the Elliott wave count expectation and so it may be a third wave. An upwards breakout may be imminent. This view is supported by the strongest volume during the consolidation coming on an upwards day.
If the main Elliott wave count is correct, then today’s gap may offer support.
BREADTH – AD LINE
WEEKLY CHART
Click chart to enlarge. Chart courtesy of StockCharts.com. So that colour blind members are included, bearish signals
will be noted with blue and bullish signals with yellow.
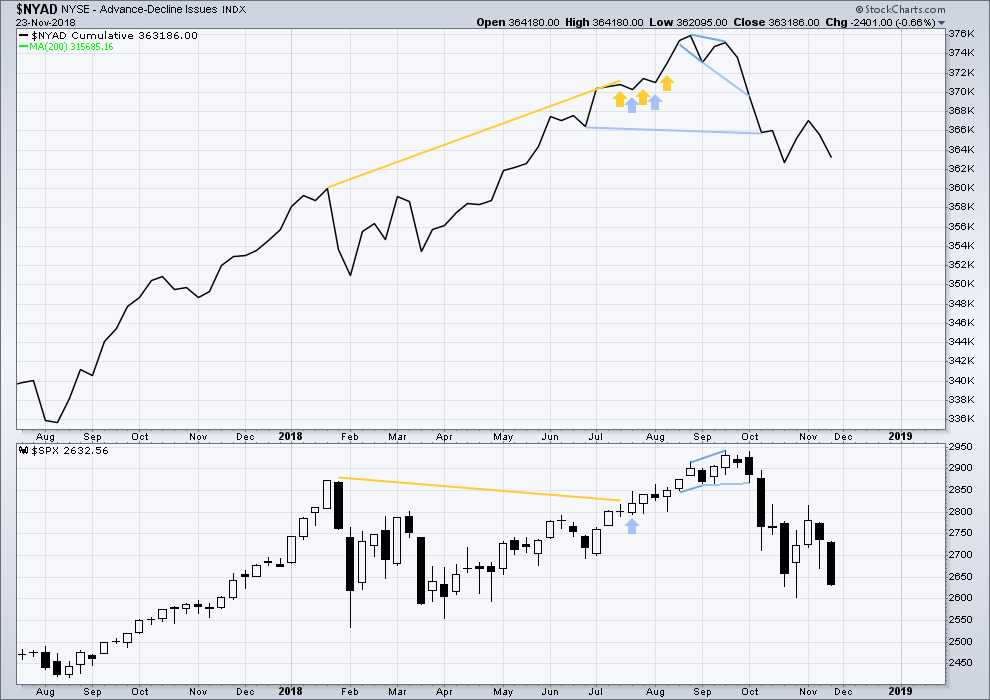
Last week both price and the AD line have moved lower. There is no short-term divergence at this time frame.
DAILY CHART
Click chart to enlarge. Chart courtesy of StockCharts.com. So that colour blind members are included, bearish signals
will be noted with blue and bullish signals with yellow.
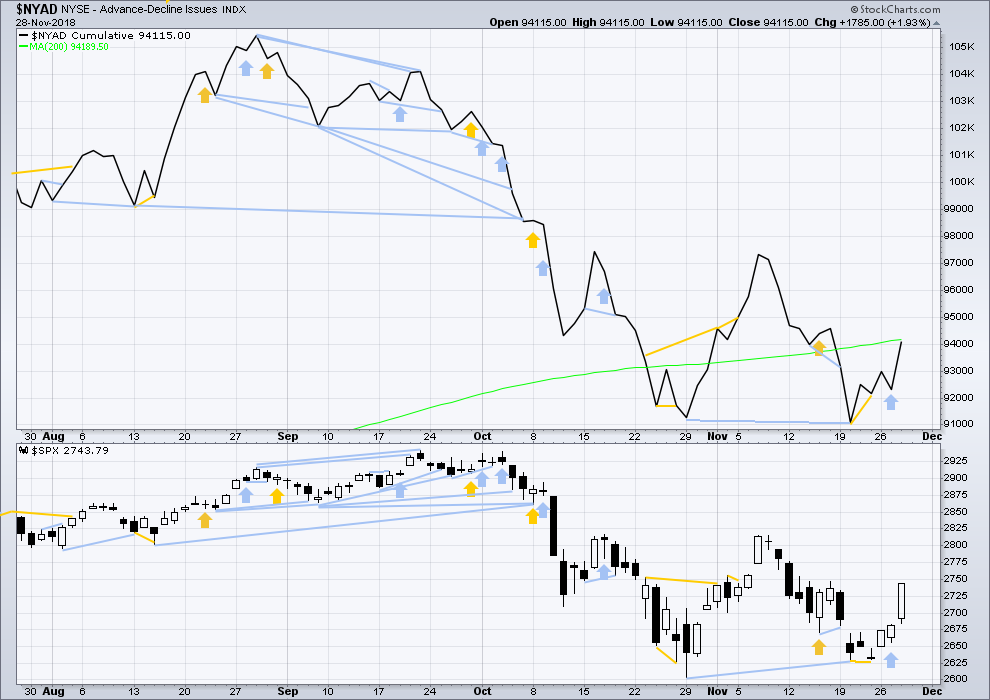
There is normally 4-6 months divergence between price and market breadth prior to a full fledged bear market. This has been so for all major bear markets within the last 90 odd years. With no longer-term divergence yet at this point, any decline in price should be expected to be a pullback within an ongoing bull market and not necessarily the start of a bear market. New all time highs from the AD line on the 29th of August means that the beginning of any bear market may be at the end of December 2018, but it may of course be a lot longer than that.
Breadth should be read as a leading indicator.
Bearish divergence noted in yesterday’s analysis has not been followed by any downwards movement; it has been followed by a strong upwards day, so the bearish divergence is considered to have failed for the short term. But it is noted that given the bigger picture of a possible primary degree fifth wave within a cycle degree fifth wave within a Super Cycle degree fifth wave, that some odd instances of bearish signals and divergence may now begin to accumulate.
Today upwards movement has strong support from rising market breadth. There is no new short-term divergence.
VOLATILITY – INVERTED VIX CHART
WEEKLY CHART
Click chart to enlarge. Chart courtesy of StockCharts.com. So that colour blind members are included, bearish signals
will be noted with blue and bullish signals with yellow.
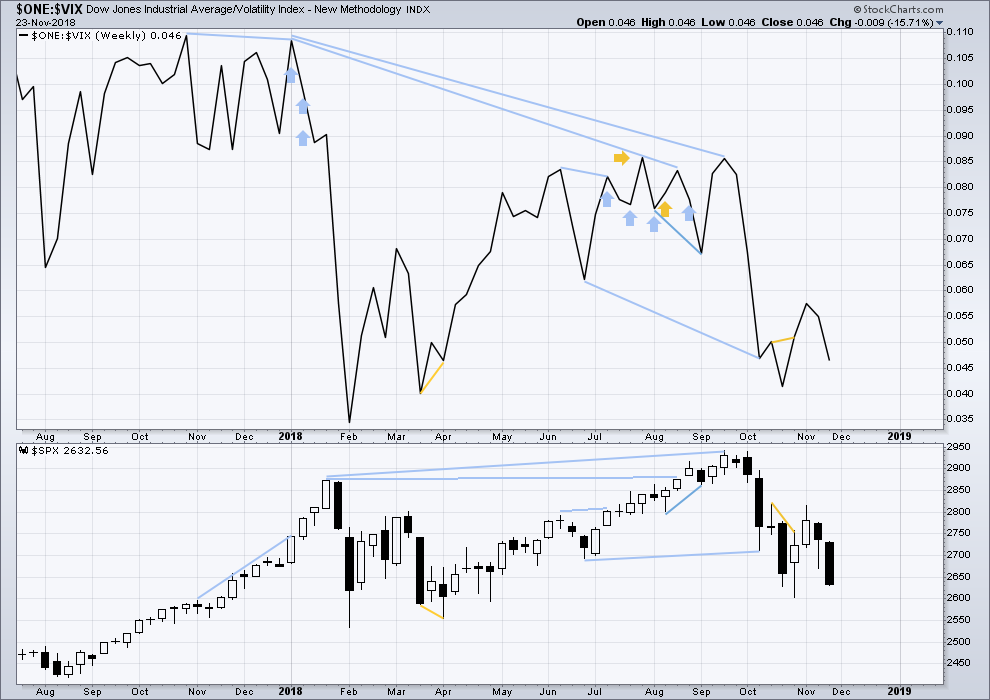
Last week both price and inverted VIX have moved lower. There is no new short-term divergence at this time frame.
DAILY CHART
Click chart to enlarge. Chart courtesy of StockCharts.com. So that colour blind members are included, bearish signals
will be noted with blue and bullish signals with yellow.
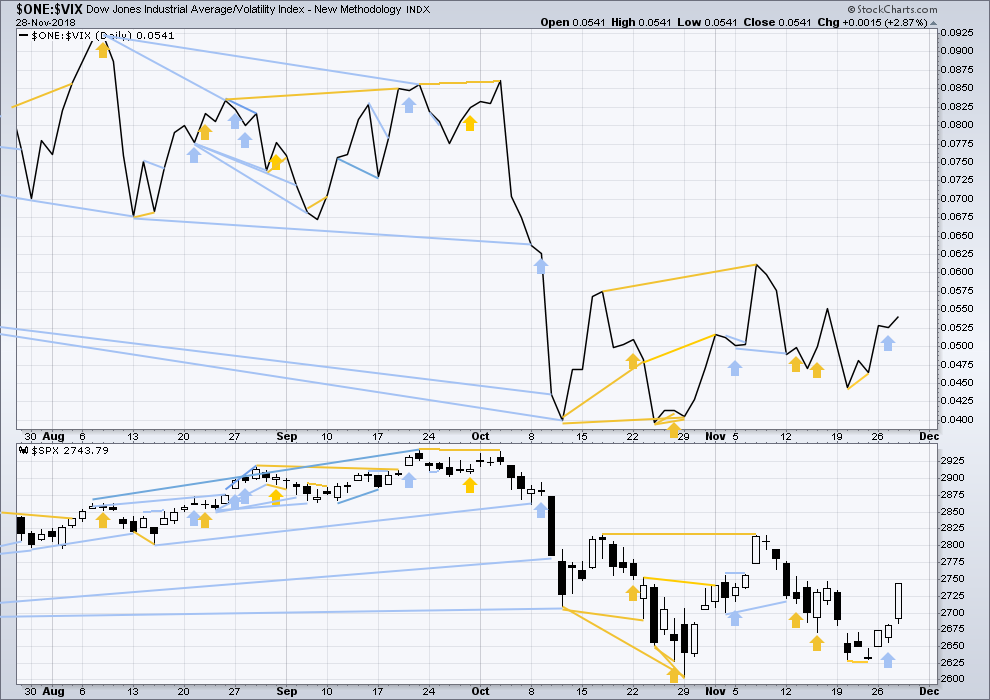
Normally, volatility should decline as price moves higher and increase as price moves lower. This means that normally inverted VIX should move in the same direction as price.
Bearish divergence noted in yesterday’s analysis has not been followed by any downwards movement, so it is considered to have failed for the short term.
However, like the AD line, inverted VIX may now begin to accumulate instances of bearish signals or divergence as a fifth wave at three large degrees comes to an end.
Today upwards movement has some support from a normal decline in VIX. There is no new short-term divergence.
DOW THEORY
The following lows need to be exceeded for Dow Theory to confirm the end of the bull market and a change to a bear market:
DJIA: 23,344.52.
DJT: 9,806.79.
S&P500: 2,532.69.
Nasdaq: 6,630.67.
Published @ 08:16 p.m. EST.
—
Careful risk management protects your trading account(s).
Follow my two Golden Rules:
1. Always trade with stops.
2. Risk only 1-5% of equity on any one trade.

Yipee!
With a little co-operation from Mr. Market I will be dropping one large in the Salvation Army red kettle tomorrow from those spec puts!
End of wave and OpEX synchronicity make for nice speculative trades!
Have a great evening all! 🙂
Hundo or grand?
1K! 🙂
They actually put 0.98 of every dollar given to good use! 🙂
That’s quite generous. Good for you!
and them.
Nice Verne. And congrats.
Obviously…you move size!!! And your confidence in your trades is impressive. I sure struggle with that sometimes.
Paid some serious dues! You will get there… Thx.
🙂
Double top in ES! 🙂
SPY 275 strike puts expiring tomorrow sure look like a tasty SPECULATIVE trade.
This kind of trade to be made ONLY with “play” money….capisce??!! 🙂
Got ’em for a buck….
SPY should re-trace to at least 273 or a bit lower tomorrow giving a quick double on 275 strike puts, probably a good place to ring the register! 🙂
So far it looks like a quiet day. Which fits for a fifth wave to end minor wave 1.
If minute v = minute i then a target for minor 1 to end would be about 2,766. That’s the most common Fibonacci ratio for a fifth wave to exhibit so this target has a reasonable probability.
I’m leaving the channel as it is. So far it contains all this upwards movement. While price remains within the channel, assume minor 1 may continue higher. When the channel is breached by downwards movement then draw a Fibonacci retracement along the length of this upwards wave and use the 0.382 and 0.618 Fibonacci ratios as targets for minor wave 2.
And the 73% fibo is right there around 2766. The 78.6% is just above 2776. Somewhere in there sounds about right!
Seems like another divergent high in fifth wave tomorrow then turn down
Very possible. I also believe that the minute 4 down already in play is possible, and we’ve seen an a down, are in a b up, and a c down is coming soon to take SPX to the 2700 pivot area to complete that minute 4. Either way, not too much directional movement for a day or two here likely. I call it “knife work” time.
Not sure if we’ll get 2700 for c of 4, may be around 2715ish or possibly end just close to 2722… obviously ? if we do get one….
Could possibly dip down then rise a but up & close around 2727 then gap up tomorrow
Yep! 🙂
I’ve been chewing in my mind on the question of “why is it necessary for the market to turn at these fibo level’s, particularly the 38% and 62%, in order to operate in a factal manner?”. I started thinking about fractal spirals and “why they work”, and the somewhat obvious answer finally popped up through the haze of my frequent state of mind.
It’s the ONLY way that PROPORTIONALITY at every level of “magnification” (timeframe in our market fractal universe) is maintained! If turns happen at random places, things can’t remain proportional at higher magnification (lower timeframe). Just consider what would happen if you tried to do a “fractal spiral” but instead used a random figure like 43%. It ain’t gonna work. That’s why fibo magic is a MUST in the market, and is so incredibly powerful as a turn timing tool. I think…
Leave it to my son to ask the obvious hard questions. “So why does it have to stay proportional at lower timeframes?”. Uhhhmmm. Ahhhh…because…ummm. I’ll have to think about that! But I’m SURE there’s an “obvious” explainable reason (aside from the fact based non-answer of “because it does!”.)
Almost as if there might be an unseen designer behind it all…
Yes…and no. “it’s just math.” Which really isn’t sayin’ anything, I know. We don’t HAVE to live in a universe where 1+1 necessarily equals 2. And at the quantum level…well, that gets weird beyond all conception, because the inescapable conclusion from known facts is that we don’t live in an externally objective causal reality at all. Double slit experiment shows that convincingly. So far at least, after many many more and more refined attempts to disprove the result! Most bizarrely, the double slit experiment indicates that nothing is rendered in this universe until required due to conscious observation. Serious twilight zone musak here!!
To fully put my cards on the table Curtis…YES. Little doubt about it for me based on available scientific evidence. This universe appears (this is an ANALOGY ONLY folks, because we can’t comprehend the transcendental from within the paradigms of this reality) to be a kind of “simulation”. Tippler has a PhD thesis claiming to prove that a quantum level simulation is INDISTINGUISHABLE from a “real” quantum universe, implying…they are one and the same. So what is this transcendental “realm” outside of our quantum based reality? Calling it God is fine by me. But we can’t stop there; why does the universe only manifest when OBSERVED by consciousness? Doesn’t that make “us” rather “special”? Yes it does. My hypothesis (shared by some others): we at the level of consciousness/soul are “extensions” of that transcendental “thing”. Why would “it” or “they” do all this, create this reality, then exist within it? Best analogy I can come up with is some combination of (1) to have experiences and/or (2) to learn! When we terminate here…we wake up in the transcendental realm (heaven if you like). Just a wacky theory…
A seriously thoughtful response, Kevin. Thank you!
I’ll zero in on this. You wrote: ‘My hypothesis (shared by some others): we at the level of consciousness/soul are “extensions” of that transcendental “thing”.’
Your hypothesis is solid and has a very familiar ring to it. From the Hebrew/Christian Scriptures (Genesis 1:27): “So God created mankind in his own image, in the image of God he created them; male and female he created them.”
Word, Curtis! We approach this from different angles…but come to very similar conclusions.
Didja see the size of that open interest on tomorrow’s SPY 250 strike puts??!!
Gadzooks!!!!! 🙂
We could sell some ’em some more! Except I don’t think anyone’s buying, even at the minimum price of $1. Somebody’s out some serious cash there. Well, “the market was supposed to go down”, you know, it was in the news!
30k? Is that really out of whack?
One day to expiration, and that far OTM??!!
Absolutely nuts!!!!!
Unless, of course, they know something the rest of us don’t!
🙂
If they were bot today, then I get it, but do you know when were they purchased?
I bot some a while back for a buck which I pushed further out.
Could be insitutional hedge.
I don’t know when they were purchased, but I believe with ToS you can use the “go back in time” function and find out! I’m not going to bother myself. But my first order guess would be those are old dead options that some big money just plain “got wrong” on.
Break from VIX bullish falling wedge….. 🙂
Crazy how just a few words from the white house can move the markets instantly. Feels like the market is starting to ignore their comments. Don’t think many believe their statements on China deal coming around.
That being said, put a stop on my bag of SPY commons in green. If we do get a dive down, I want some of it.
Looking for at least a re-test of the pivots.
How price re-acts there will tell us all we need to know about the near term market direction.
VIX 20.08 also important….
I’m riding downtown on the RTY, short trip, then gonna take the uptown express (hopefully)
Also yesterday was the first day trading from my phone on the Mexican internet: lesson- grab a small profit and go to the beach …..
Assuming SPX is now in a minute 4 down (likely I think), where’s the likely bottom? It can’t go to the 61.8%, that’ll violate the top of the I believe. 50% turns happen, but are much less common. That leaves the 38%…which is right around the magic 2700 level. So I’ll be on my toes if/when that level approached, and ready to jump on the long side if and as it turns and triggers.
“C” waves are a lot like third waves…! 🙂
Does QQQ turn and initiate a daily tf move back down off it’s trend line? I see that as a critical indicator of what’s likely over the next week or so. Also of course, SPX moved up to exactly that fibo cluster and swing high I mentioned yesterday, and stopped right there. Same key question: does it push up and through here, or is that wonderful “fractal structure” turn point for it? I can guess but I’m trying not to. Let the market inform. So I’m only small potatoes trading so far today, and cashing nicely profitable positions on the long side that COULD go further…or could get much less profitable for the next week. Profits in the bank and secure is always a good thing; eliminate FOMA! (fear of missing out). The markets are eternal; birds in hand provide daily nourishment!
The daily QQQ view I’m talking about…trend line + key fibo retrace price levels are POWERFUL. I’ve got a tactical QQQ short here in case this does what seems to me to be “most likely”, and obviously there’s a very low risk stop level just overhead. Nice win/loss ratio here as I see it, and “should” be very +EV (expected value).
I also have a tactical short via IWM options on RUT. Which is particularly weak today.
Took my small IWM short profits at the first indication of a turn at the 23% retrace level. That’s was freakin’ perfect. Now I’m suspicious we see a turn back down at the 78% retrace up of the down move (1527).
Freakin’ perfect again, tag and turn, I jumped it immediately for puts again. How far down it goes TBD, but my risk level is virtually zero, because I bail the instance it goes over that 78%.
I LOVE FRACTAL STRUCTURE!
Verne your comment about “not many use spreads” yesterday got me thinking.
Lots and lots and lots of people use spreads, and “education” on spread trading is everywhere. However, in all my poking around (which in the options word is “some” but not super extensive), I have NEVER yet run across a description of using credit spreads as a means of “milking volatility” via closing the short leg for a profit then riding the long leg the other way to secure some/all or even more of that profit. Are you aware of any published material that discussed that method? I’m always a student so I’m interested in looking at any out there.
You are quite right Kevin.
I traded with Ken Trester for several years and learned a lot about credit spreads from him. The strategy of exiting the short leg to execute counter-trend trades is one I developed. If other traders do it, they are not talking. You will not find the technique described in any manual on options trading so please keep it quiet!
But seriously, not many folk get just how awesome this is.
I know you got it immediately from some of the trades you made after I posted about it.
KEEP IT QUIET!
We don’t want them making it illegal now do we? 🙂
You got it friend. Not a word from me! Well, except MAYBE to one or two listening here? But you started that so….thank you!! It’s a fabulous tool in my bag now!
🙂
Man I need to start learning…. before it’s too late
Okay Peter I’m NOT LAUGHING AT YOU. But I am ROTFL. Very healthy. We’ve all been there man!
I am curious.
Does anyone else think the Powell remarks were a “co-inky-dink”?
( I had heard rumors) Using leverage can be risky! 🙂
What is co-inky-dink?
a play off the word “coincidence”.
i.e. powell used those words to goose the market up for the banksters and their long positions. everything is explainable with a conspiracy theory…including the “EW drives everything” conspiracy theory!
Thanks Kevin! 🙂
I think the inner Elliott Wave that drives the markets (and everything under the sun) put those words (“just below neutral”) into his mouth to fulfill the requirements of the wave structure. (Twilight Zone music here…)
Bingo! 🙂
I do think however, he did it with a nod and a wink…!
Rememer the massive 260 SPY call open interest?….Ahem…!
Uno! ( in Mexico, just until the border opens back up? Fake news?) anyways…. Salud!
Dos!
If you don’t speak Spanish in CA, you can sometimes feel like a foreigner. Se habla espanol? Un poco, amigo, un poco.
Looks like you might be there a while. I hope all is well and stays well.