Upwards movement has continued as the main Elliott wave count expected.
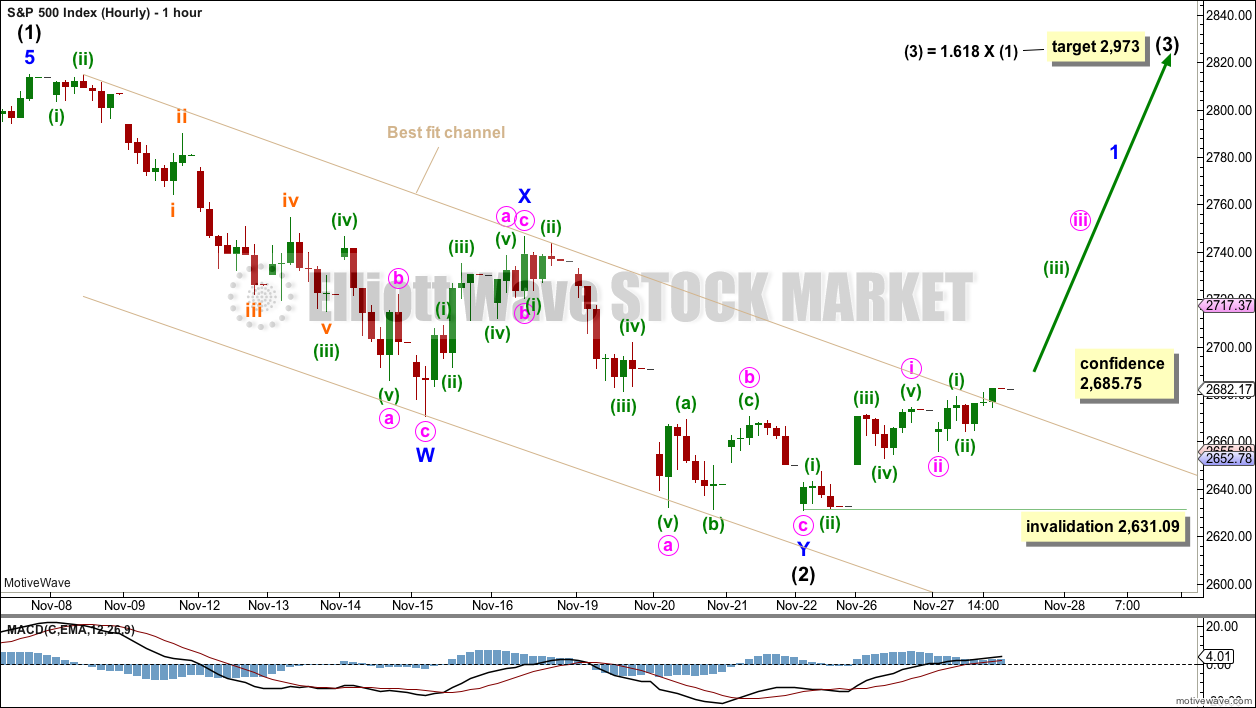
Summary: For the short term, a low may be in place if the teal trend line offers support. A target for the next wave up is 2,973. Have some confidence in this view if price makes a new high above 2,685.75.
The main wave count now expects this bull market to end at the end of December 2018 at the earliest, and possibly in March 2019, at 3,090.
Today’s bearish divergence between price and both of the AD line and inverted VIX suggests the alternate daily zigzag wave count could be correct. It is possible a final push lower to 2,602 may occur before the bull market resumes.
New updates to this analysis are in bold.
The biggest picture, Grand Super Cycle analysis, is here.
Last published monthly chart is here, video is here.
MAIN ELLIOTT WAVE COUNT
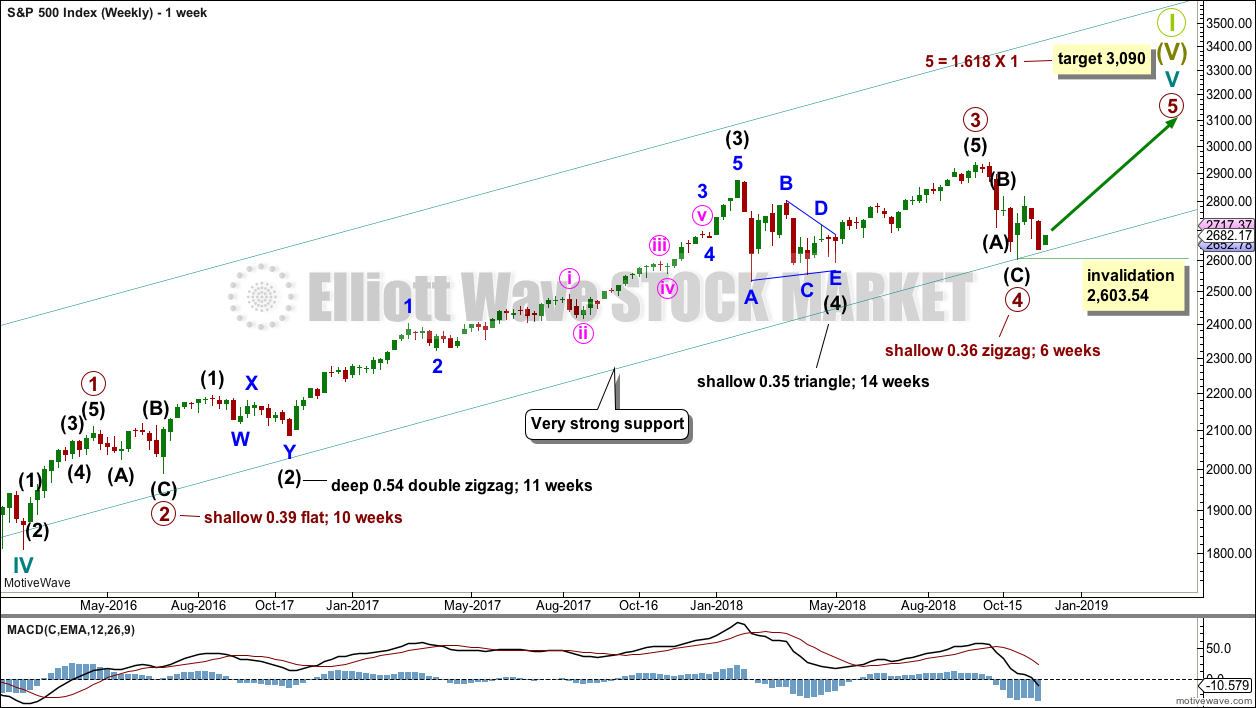
WEEKLY CHART
Cycle wave V must complete as a five structure, which should look clear at the weekly chart level and also at the monthly chart level. It may only be an impulse or ending diagonal. It is clear it is an impulse.
Within cycle wave V, the third waves at all degrees may only subdivide as impulses.
Within primary wave 3, there is perfect alternation and excellent proportion between intermediate waves (2) and (4).
Primary wave 4 may have found very strong support about the lower edge of the teal channel. This channel is copied over from the monthly chart and contains the entire bull market since its beginning in March 2009. While Super Cycle wave (V) is incomplete, this channel should not be breached at the weekly chart level.
Draw the teal channel from the high of cycle wave I at 1,343.80 on the week beginning 3rd July 2011, to the high of cycle wave III at 2,079.46 on the week beginning 30th November 2014, and place a parallel copy on the low of cycle wave II at 1,074.77 on the week beginning 2nd October 2011. Draw this chart on a semi-log scale. A small overshoot, like that seen at the end of cycle wave IV, would be entirely acceptable. If price does move below the channel, then it should reverse reasonably quickly.
The proportion between primary waves 2 and 4 is reasonable. Flat corrections tend to be longer lasting structures than zigzags. There would be perfect alternation in structure and inadequate alternation in depth. This is acceptable.
This wave count has the right look at the monthly chart level.
If primary wave 5 ends at or after the end of December 2018 and the AD line fails to make new all time highs, there would then be the minimum required four months of bearish divergence between price and the AD line. If this happens, then the conditions for the end of this bull market would be in place.
A target is calculated for primary wave 5 to end. If primary wave 5 were to be only equal in length with primary wave 1, then it would be truncated. A truncated primary wave 5 would be unlikely as then there could be no bearish divergence with the AD line. The next Fibonacci ratio in the sequence is used to calculate a target for primary wave 5.
Within primary wave 5, no second wave correction may move beyond the start of its first wave below 2,603.54.
DAILY CHART
The subdivisions of primary wave 4 are seen in exactly the same way as most of the charts below except the degree of labelling is just moved up one degree.
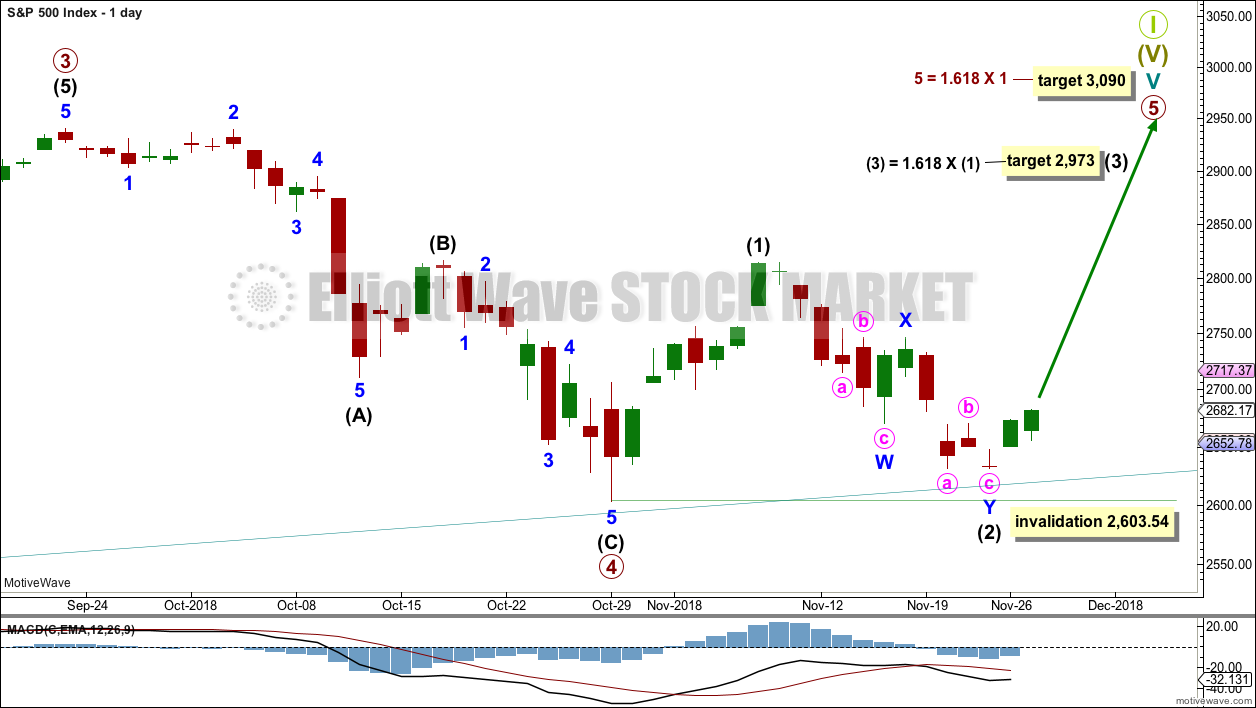
Within primary wave 5, intermediate wave (1) may be over. Intermediate wave (2) may not move beyond the start of intermediate wave (1) below 2,603.54. Intermediate wave (2) may have ended at support at the lower edge of the teal trend channel.
Primary wave 5 may subdivide either as an impulse (more likely) or an ending diagonal (less likely). Intermediate wave (1) may be seen as either a five wave impulse or a three wave zigzag at lower time frames, and so at this stage primary wave 5 could be either an impulse or a diagonal.
Primary wave 5 at its end may be expected to exhibit reasonable weakness. At its end, it should exhibit a minimum of 4 months bearish divergence with the AD line, it may exhibit bearish divergence between price and RSI and Stochastics, and it may lack support from volume; it may not be possible to distinguish a weak fifth wave from a B wave.
HOURLY CHART
Intermediate wave (3) may only subdivide as an impulse if primary wave 5 subdivides as an impulse.
Within intermediate wave (3), minor wave 1 may be incomplete.
Within minor wave 1, minute wave i may be complete at yesterday’s high, or it may continue a little higher. Minute wave ii may not move beyond the start of minute wave i below 2,631.09.
Some confidence may be had in this wave count now that price has broken above the upper edge of the best fit channel. Further confidence may be had if price makes a new high above 2,685.75.
ALTERNATE ELLIOTT WAVE COUNT
WEEKLY CHART
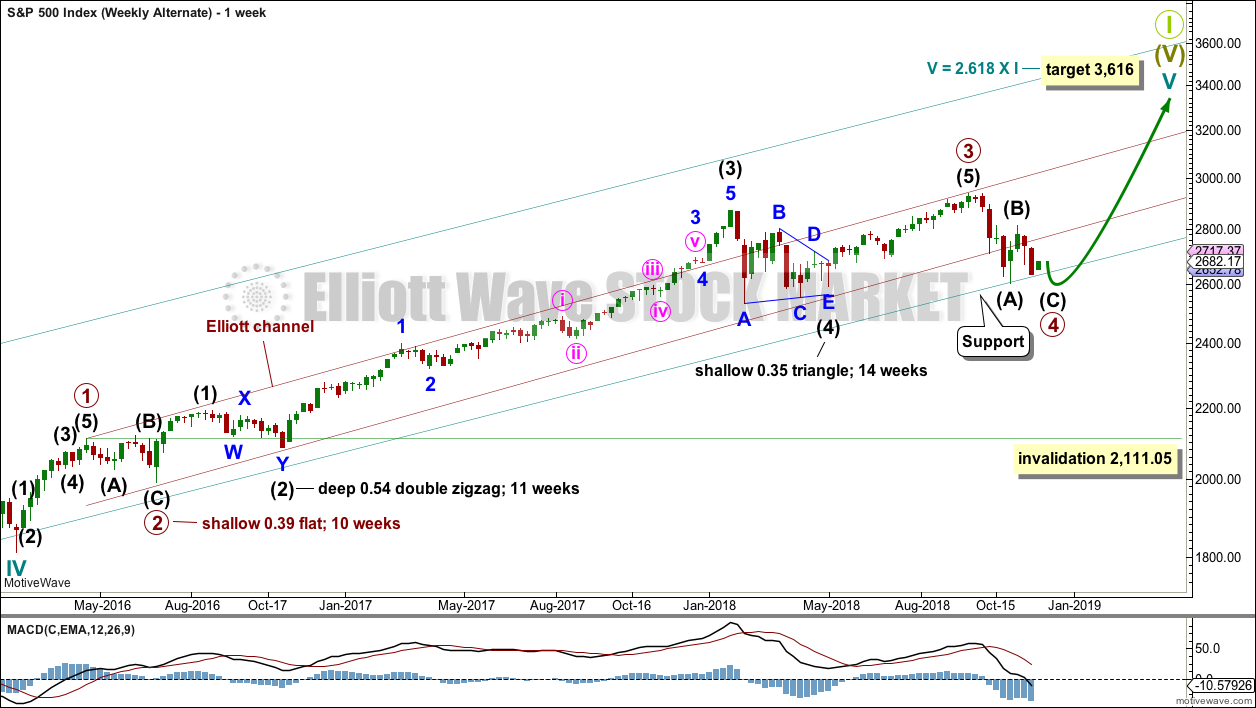
It is also still possible that primary wave 4 may be incomplete. However, at this stage, if primary wave 4 is incomplete and continues for a further several weeks, it would now be out of proportion to primary wave 2. Primary wave 2 lasted 10 weeks. If primary wave 4 is incomplete, then so far it has lasted 10 weeks.
If primary wave 4 is incomplete, then the most likely structure would be a zigzag which could complete this week.
Primary wave 4 may not move into primary wave 1 price territory below 2,111.05.
For this alternate wave count, when primary wave 4 may be complete, then the final target may be calculated at primary degree. At that stage, there may be two targets, or the target may widen to a small zone.
DAILY CHART – ZIGZAG
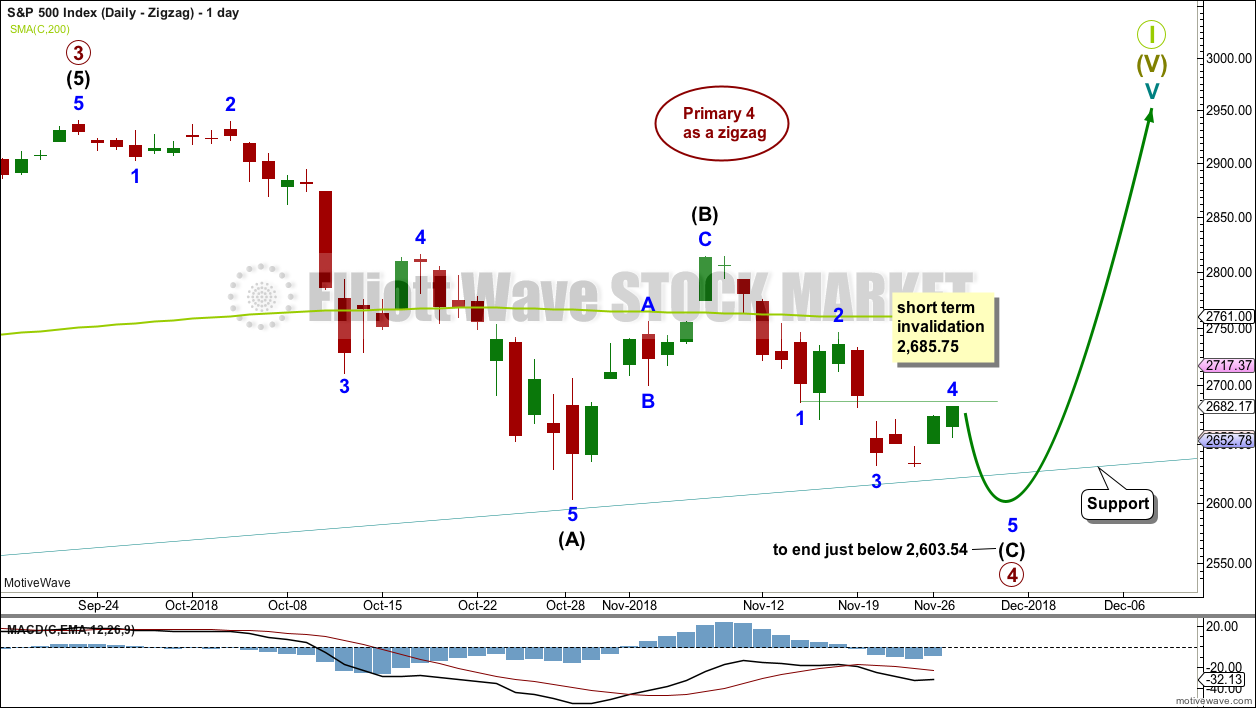
Primary wave 4 may be unfolding as a single zigzag, which is the most common type of corrective structure. This would provide perfect alternation with the flat correction of primary wave 2.
Within the zigzag, intermediate wave (B) may be a complete structure, ending close to the 0.618 Fibonacci ratio of intermediate wave (A).
Intermediate wave (C) may now unfold lower as a five wave structure. Intermediate wave (C) would be very likely to end at least slightly below the end of intermediate wave (A) at 2,603.54 to avoid a truncation. It may end about support at 2,600.
Within intermediate wave (C), minor waves 1 through to 4 may be complete. If this labelling is correct, then minor wave 4 may not move into minor wave 1 price territory above 2,685.75. Minor wave 5 may be relatively short and brief; this structure could be complete as quickly as just one more session.
This wave count could expect a reasonably small overshoot of the teal trend channel if the labelling within intermediate wave (C) is correct.
If the lower edge of the teal channel is overshot, then it would most likely be followed by a fairly quick reversal, possibly even intraday. If the bull market remains intact, then it would be most likely that there would not be a full daily candlestick below the trend channel, and very unlikely for a full weekly candlestick to print below the channel.
HOURLY CHART – ZIGZAG
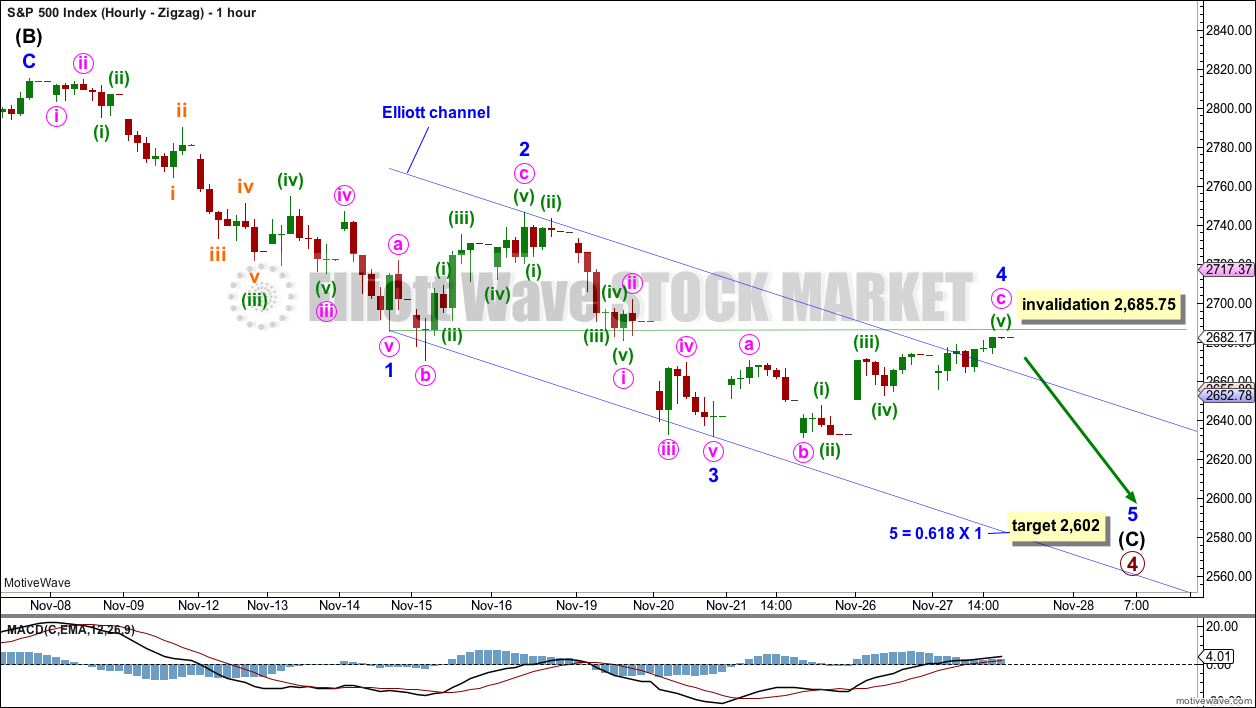
Intermediate wave (C) is labelled as an almost complete five wave impulse.
Minor wave 3 is shorter than minor wave 1, and it exhibits no Fibonacci ratio to minor wave 1. This limits minor wave 5 to no longer than equality in length with minor wave 3, so that the core rule stating a third wave may not be the shortest is met. This limit is at 2,567.22.
Because there is no adequate Fibonacci ratio between minor waves 3 and 1, it is more likely that minor wave 5 will exhibit a Fibonacci ratio to either of minor waves 3 or 1. A ratio to minor wave 1 would be most likely.
DAILY CHART – TRIANGLE
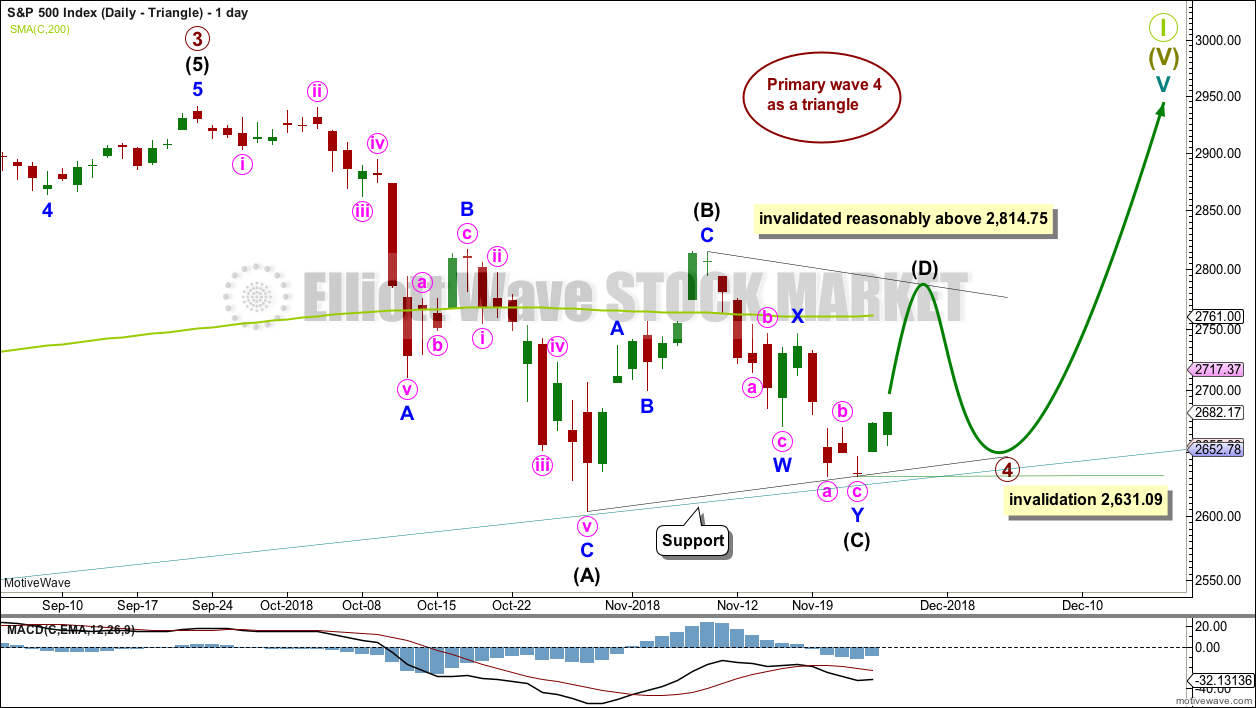
If primary wave 4 unfolds as a triangle, it would have perfect alternation with the regular flat correction of primary wave 2. It would also continue to find support about the lower edge of the teal trend channel. Triangles are fairly common structures for fourth waves.
The triangle is relabelled to see intermediate waves (A), (B) and (C) now all complete. Intermediate wave (B) is shorter than B waves of triangles usually are; this gives the triangle an odd look. However, considering the duration of primary wave 4 so far, this labelling now makes more sense.
Intermediate wave (C) may have completed as a double zigzag. This is the most common triangle sub-wave to subdivide as a multiple.
Price has bounced up off the lower edge of the teal trend channel.
If the triangle is a regular contracting triangle, which is the most common type, then intermediate wave (D) may not move beyond the end of intermediate wave (B) above 2,814.75.
If the triangle is a regular barrier triangle, then intermediate wave (D) may end about the same level as intermediate wave (B). As long as the (B)-(D) trend line remains essentially flat a triangle would remain valid. This invalidation point is not exact; intermediate wave (D) can end very slightly above 2,814.75.
The final wave down for intermediate wave (E) may not move beyond the end of intermediate wave (C) below 2,631.09.
DAILY CHART – COMBINATION
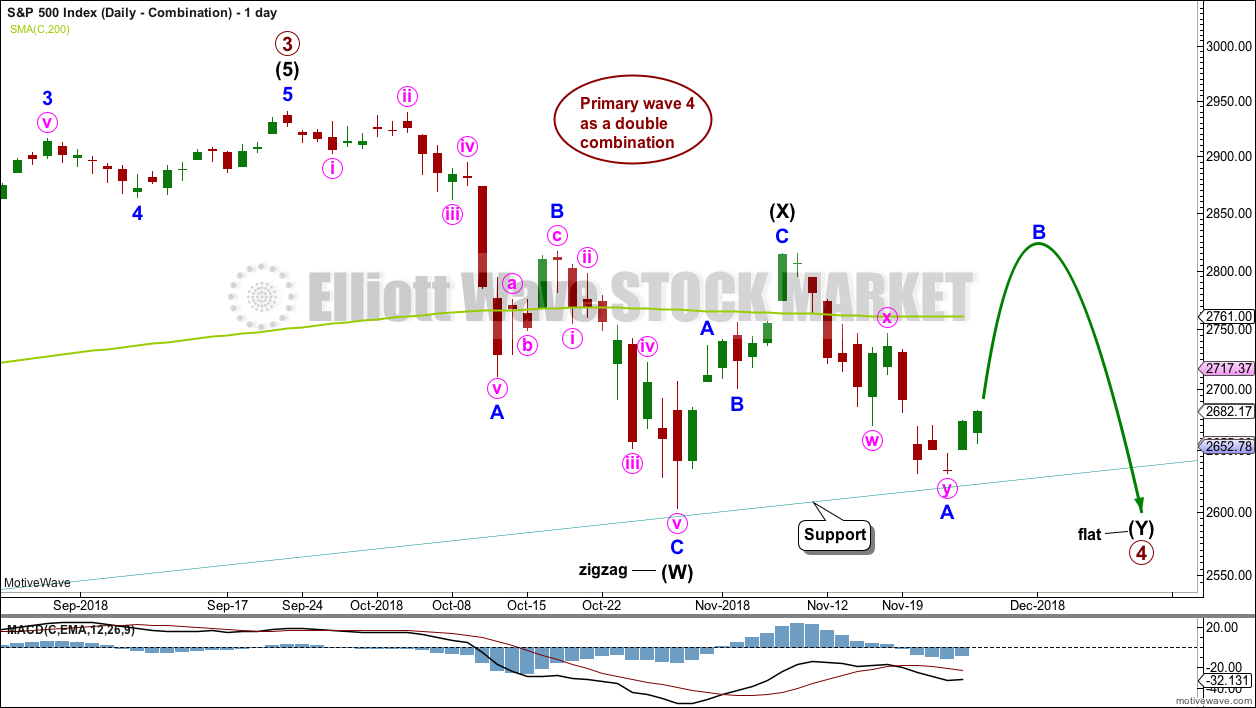
This wave count is judged to have only a lower probability than the triangle. If this wave count is correct, then primary wave 4 may be a few weeks longer in duration than primary wave 2. This wave count now has a problem of proportion.
Primary wave 4 may be unfolding as a double combination. The first structure in the double may be a complete zigzag labelled intermediate wave (W). The double may be joined by a three in the opposite direction labelled intermediate wave (X). Intermediate wave (X) may be complete as a single zigzag; it is deep at 0.63 the length of intermediate wave (W), which looks reasonable.
Intermediate wave (Y) would most likely be a flat correction, which should subdivide 3-3-5. At its end, it would now require a reasonable overshoot of the lower edge of the teal trend channel. This further reduces the probability of this wave count today.
At the hourly chart level, minor wave A may be a complete double zigzag.
Within the flat correction of intermediate wave (Y), minor wave B must retrace a minimum 0.9 length of minor wave A at 2,796.74. The common range for minor wave B is from 1 to 1.38 times the length of minor wave A giving a range from 2,815.15 to 2,885.09. Minor wave B may make a new high above the start of minor wave A at 2,815.15 as in an expanded flat.
DAILY CHART – FLAT
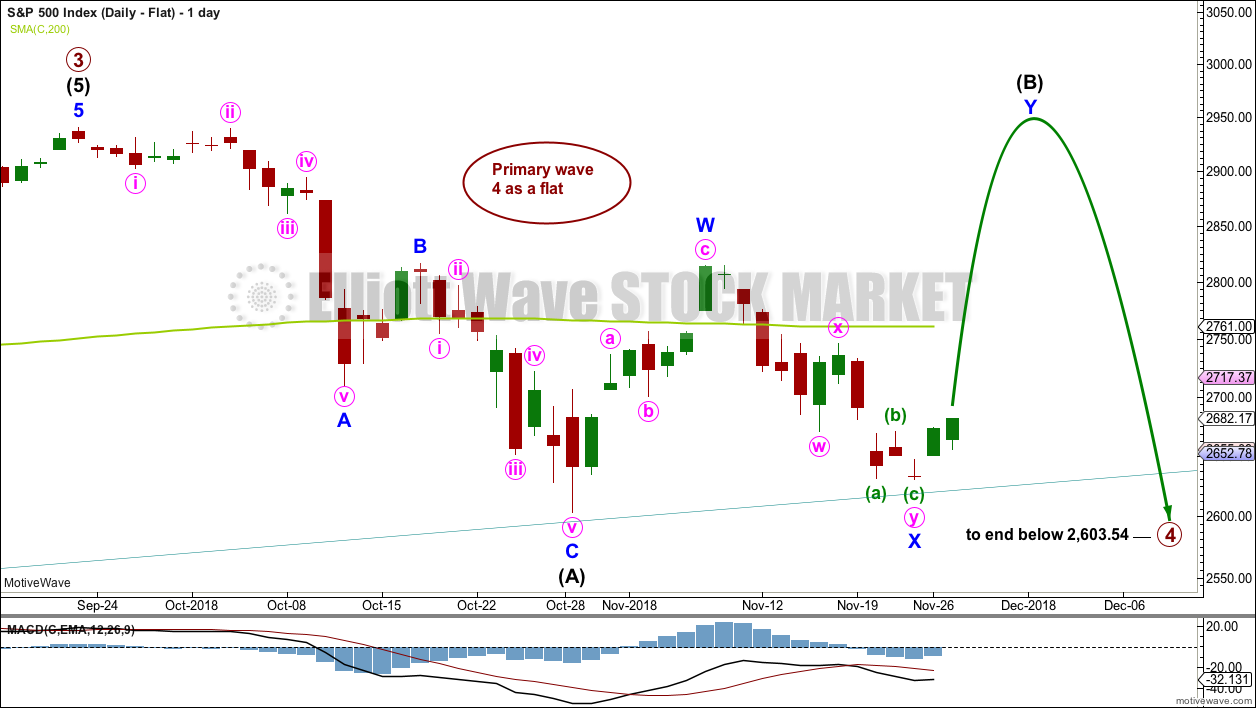
Primary wave 2 was a regular flat correction. If primary wave 4 unfolds as a flat correction, then there would be no alternation in structure between the two corrections; for this reason, this wave count is judged to have a low probability.
However, alternation is a guideline, not a rule, and it is not always seen. This wave count is possible.
If primary wave 4 is a flat correction, then within it intermediate wave (B) must move higher to retrace a minimum 0.9 length of intermediate wave (A).
When intermediate wave (B) is complete, then intermediate wave (C) should move below the end of intermediate wave (A) at 2,603.54 to avoid a truncation. This would expect a large overshoot of the teal trend line, which further reduces the probability of this wave count.
DAILY CHART – DOUBLE ZIGZAG
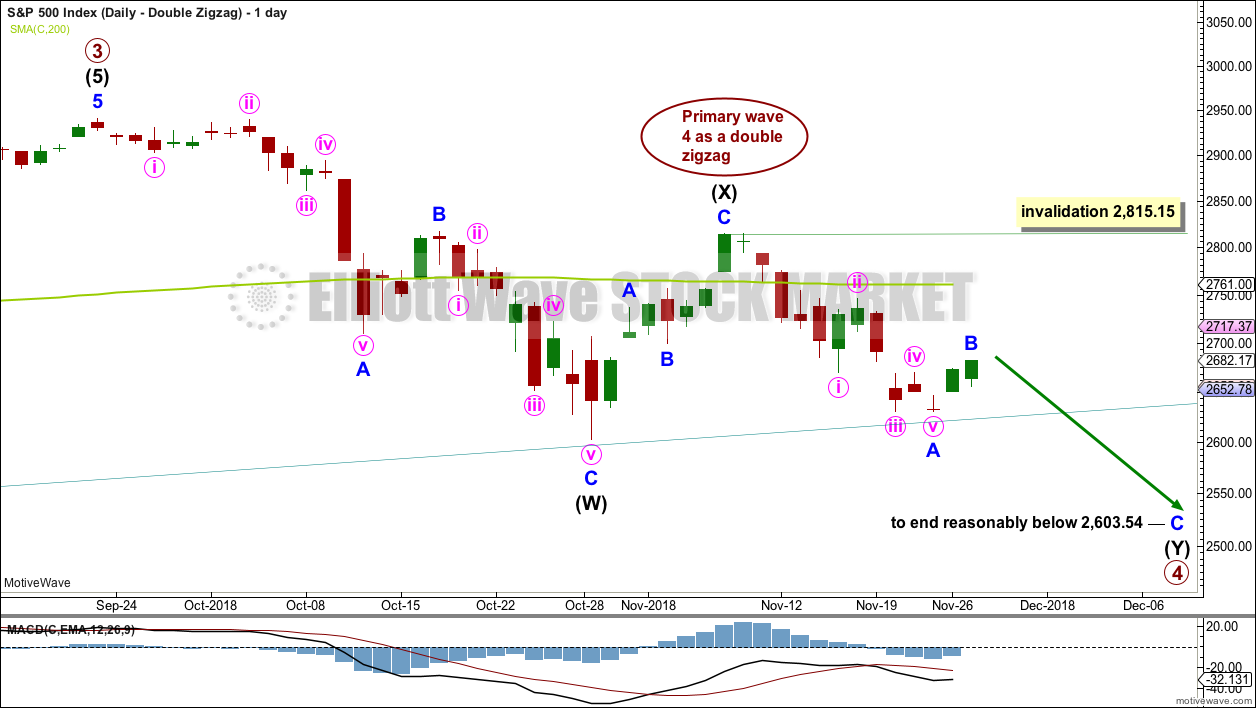
Primary wave 4 may also be unfolding as a double zigzag.
The first zigzag in the double may be complete, labelled intermediate wave (W). The double may joined by a complete three in the opposite direction, a zigzag labelled intermediate wave (X).
The second zigzag in the double may have begun. It is labelled intermediate wave (Y). Within intermediate wave (Y), minor wave B may not move beyond the start of minor wave A above 2,815.15.
The purpose of a second zigzag in a double is to deepen the correction when the first zigzag does not move price deep enough. To achieve this purpose intermediate wave (Y) should be expected to end reasonably below the end of intermediate wave (W) at 2,603.54. This would expect a very large overshoot of the teal trend channel; for this reason, this wave count is judged to have the lowest probability.
TECHNICAL ANALYSIS
WEEKLY CHART
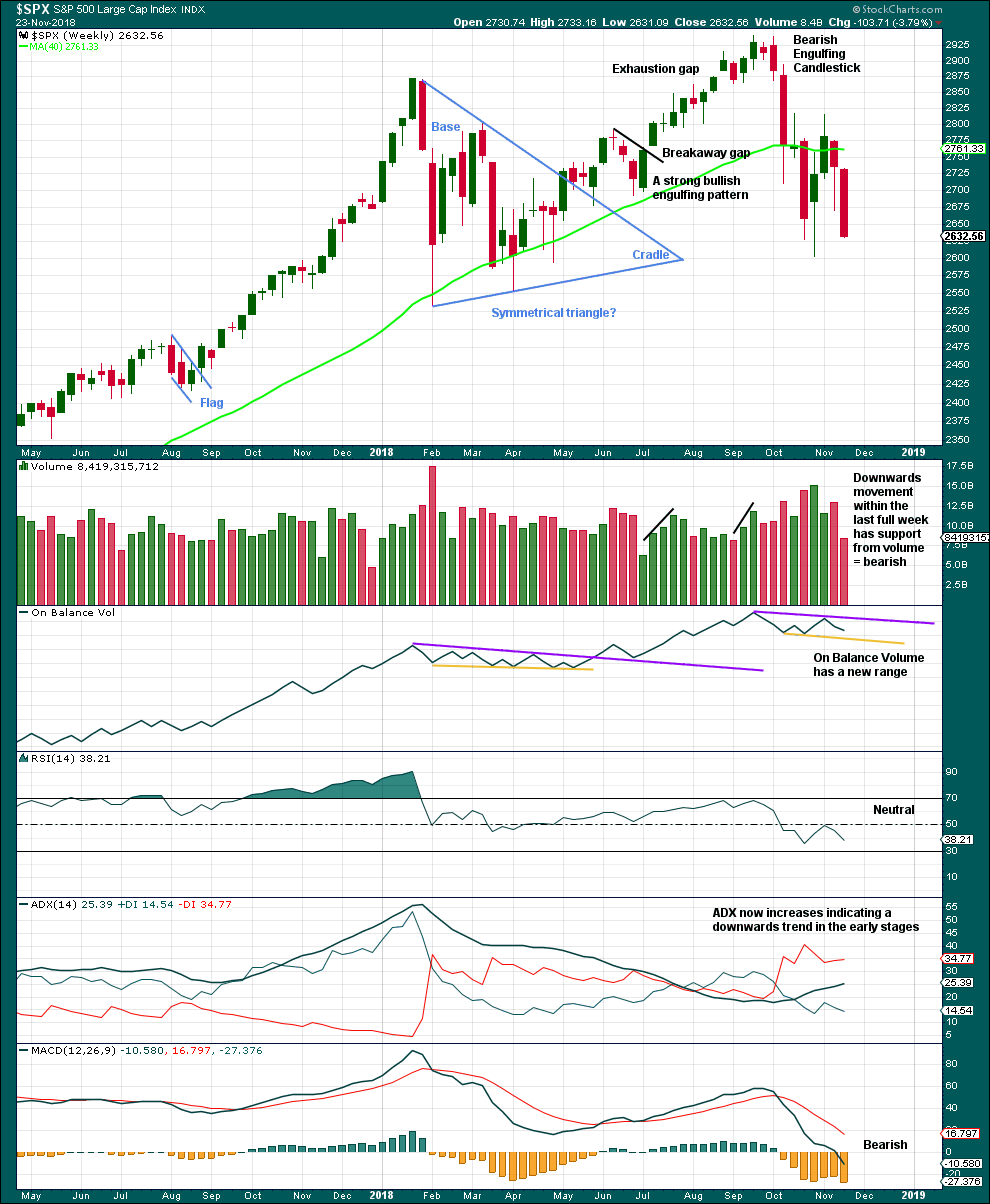
Click chart to enlarge. Chart courtesy of et=”_blank”>StockCharts.com.
With price closing almost at the low for last week, it looks like this week may move price lower.
Although volume is lighter last week, it was not a full trading week. No conclusion here about last week’s volume shall be drawn.
DAILY CHART
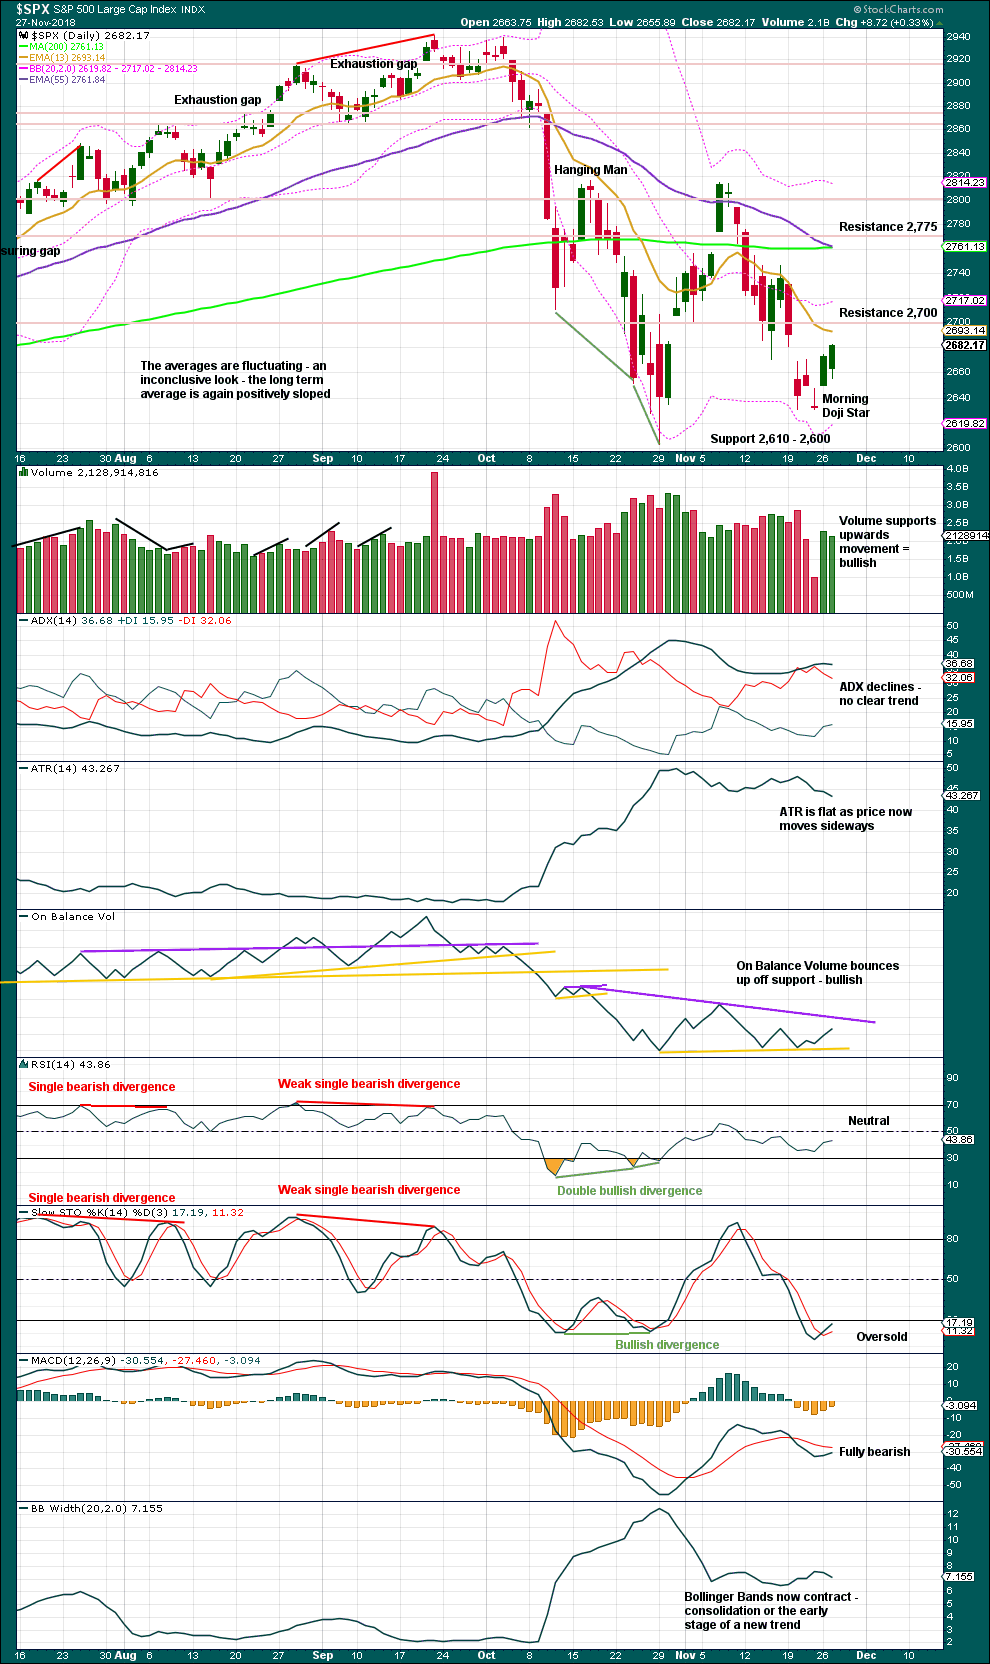
Click chart to enlarge. Chart courtesy of StockCharts.com.
The lower edge of the teal trend channel is not shown on this chart, but it should be considered as part of this technical analysis. Expect that trend line to continue to provide support, until it does not.
The last gap may be either a pattern or breakaway gap. It remains open, which is bearish.
Yesterday completes a Morning Doji Star reversal pattern, which is very bullish. There is a gap between the doji and the first and third candlesticks of the pattern. This may be an abandoned baby bottom, which is extremely rare, although the candlestick of the 20th of November is within the range of the pattern.
Volume still offers some support for upwards movement although this is waning. This is not a concern in current market conditions; price has been rising on light and declining volume for many months.
BREADTH – AD LINE
WEEKLY CHART
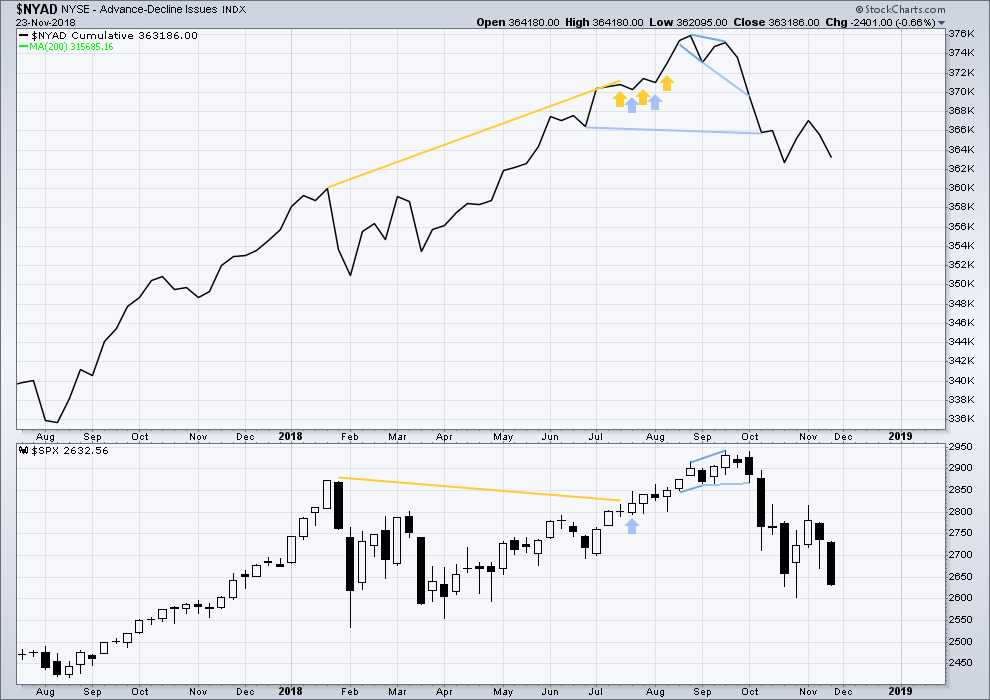
Click chart to enlarge. Chart courtesy of StockCharts.com. So that colour blind members are included, bearish signals
will be noted with blue and bullish signals with yellow.
Last week both price and the AD line have moved lower. There is no short-term divergence at this time frame.
DAILY CHART
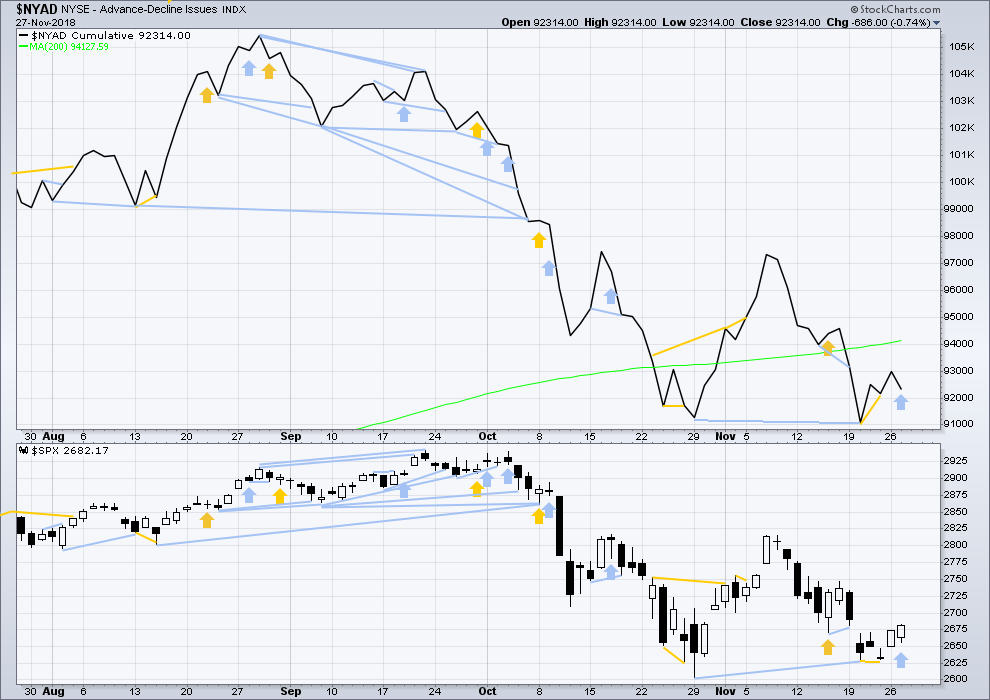
Click chart to enlarge. Chart courtesy of StockCharts.com. So that colour blind members are included, bearish signals
will be noted with blue and bullish signals with yellow.
There is normally 4-6 months divergence between price and market breadth prior to a full fledged bear market. This has been so for all major bear markets within the last 90 odd years. With no longer-term divergence yet at this point, any decline in price should be expected to be a pullback within an ongoing bull market and not necessarily the start of a bear market. New all time highs from the AD line on the 29th of August means that the beginning of any bear market may be at the end of December 2018, but it may of course be a lot longer than that.
Breadth should be read as a leading indicator.
Today completed a very clear upwards day, but the AD line has declined. Upwards movement today does not have support from a rise in market breadth. This divergence is clear and bearish for the short term. This divergence today supports the alternate daily zigzag wave count.
VOLATILITY – INVERTED VIX CHART
WEEKLY CHART
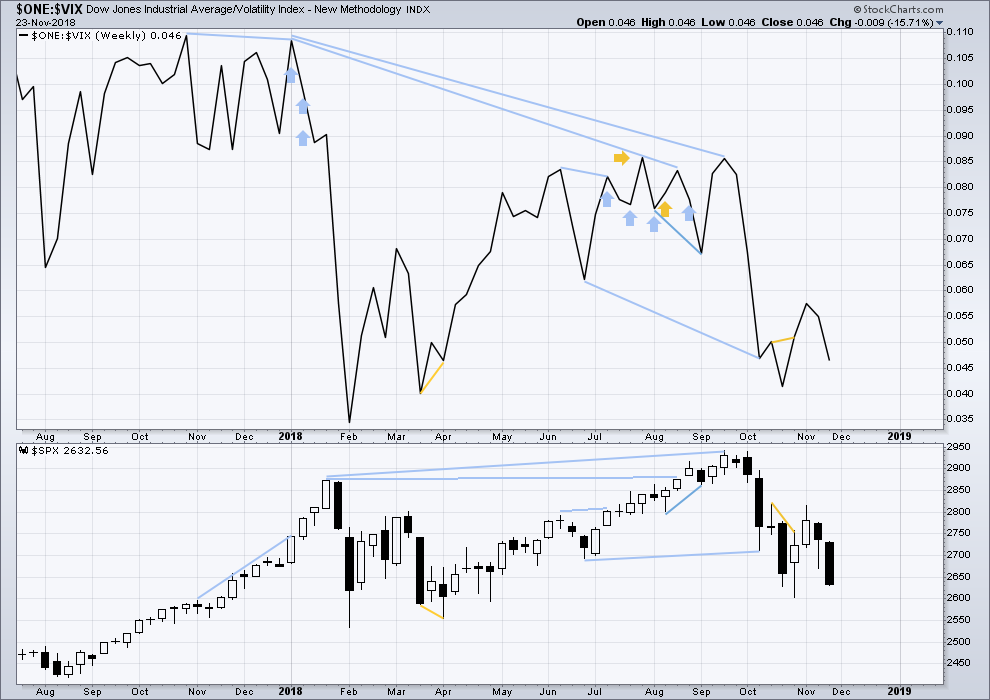
Click chart to enlarge. Chart courtesy of StockCharts.com. So that colour blind members are included, bearish signals
will be noted with blue and bullish signals with yellow.
Last week both price and inverted VIX have moved lower. There is no new short-term divergence at this time frame.
DAILY CHART
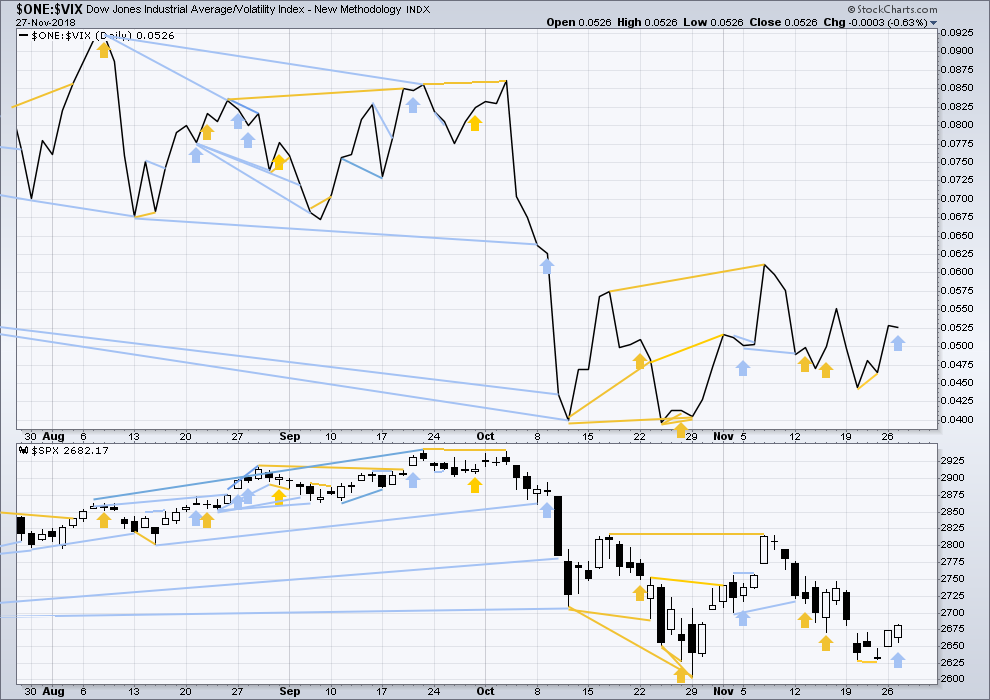
Click chart to enlarge. Chart courtesy of StockCharts.com. So that colour blind members are included, bearish signals
will be noted with blue and bullish signals with yellow.
Normally, volatility should decline as price moves higher and increase as price moves lower. This means that normally inverted VIX should move in the same direction as price.
Today price moved higher, but inverted VIX moved slightly lower. This short-term divergence is bearish and supports the alternate daily zigzag Elliott wave count.
DOW THEORY
The following lows need to be exceeded for Dow Theory to confirm the end of the bull market and a change to a bear market:
DJIA: 23,344.52.
DJT: 9,806.79.
S&P500: 2,532.69.
Nasdaq: 6,630.67.
Published @ 07:25 p.m. EST.
—
Careful risk management protects your trading account(s).
Follow my two Golden Rules:
1. Always trade with stops.
2. Risk only 1-5% of equity on any one trade.

TLT to the short side is looking very, very good to me now. Daily tf has polarity inversion, the retracement symmetry of the multi-week bull move is smashed, a significant recent swing low has been violated, and the trend at the hourly level is bright red. I taking a largish put position, and considering the entire purchase price risk capital. By buying a jun expiry, I have a loooong time to be right. And the monthly and secular trends are clearly down.
Not trading advice, just something to consider.
NFLX has broken the shorter term daily tf down trend as well as polarity inverted. Daily trend still weak down, but hourly strong up. The hourly has also smashed bearish symmetry. 300-ish has a minor swing high and a bunch of overlapped fibo levels. I’ll be mildly surprised if price isn’t up there over the next week. This isn’t the time to enter though; gotta wait for a pullback of substance on the 5 minute, even if that means getting in at higher prices. Reducing risk to me is far more important than avoiding “missing out” or “maximizing gains” (false memes, or at least, subversive memes!).
I took a short on QQQ right here off the 1 minute action. Pulling the trigger early to give me tiny risk. Seems reasonable that there might be some profit taking here. “Splashing around” is what I call this. Once cent of new highs and I’m gone.
Just before I logged onto Motive Wave to see what the markets were up to, I was reading some local NZ news on Granny Herald (we all call it that down here) and a headline: “Down! Down! Down! Markets fall give rise to fears of recession” caught my attention. I didn’t click on it, but I did think maybe the markets have fallen today and the zigzag count was the one. Which slightly surprised me.
I open Motive Wave and lo and behold a beautiful big green candlestick.
My practice of not reading much financial news is reinforced today. I’ll still watch Chris Ciovacco’s videos though. They’re always really helpful. And read Lowry’s. Happy in my nice little bubble.
Anyway, I may decide to discard the zigzag count now. It’s not invalidated at the daily chart level, I could label minor B as continuing, but it’s just getting too long in duration for good proportion. I may discard other ideas of P4 continuing too based upon duration and proportion.
The main wave count has further confidence today. It really is looking like P4 was over and not a third wave up for P5 is underway to new all time highs. Along the way intermediate (4) should be a multi week interruption, about 2-4 weeks at most.
THANK YOU LARA!!!!!
Exceptional guidance through this P4. I leaned on your higher/highest probability counts these last few days significantly…and got paid for it today!
Hi Lara
I guess you mean and “now” a third wave up is underway for P5?
Oh yes, I do. Well spotted Nick.
Only half a coffee in me when that comment was made 🙂
Chris Ciovacco is terrific! He’s always helpful in times of market despair.
Thank you Lara for your excellent navigation 🙂
I’ll be watching NDX very carefully here for the next several hours. Break or turn at the major daily tf down trend line? If it turns and starts falling, a significant correction is in play (almost certainly across all markets). If it slices up and through (and maybe retests and then starts up again?), that will be a huge bullish signal to me.
Thanks Kevin, always very helpful !
Thank you kindly Debbie. Having just too much fun today!! I love it when the “force is strong” with the market.
Looking for SPX to perhaps get to that next set of fibos here around 2745-2747. I’ll be cashing yet again at that level, because at SOME point this market’s going to initiate a small correction. Its seems far away…but the line just keeps movin’ up!
EEM (which has a HUGE options market) is flashing pretty strong bull signals after it’s 10 month sell off (daily chart shown, today has moved trend at this tf to “up”). Hasn’t quite broken that trend line yet, but if/when it does here, it will also be polarity inverting at this tf, and the structure since the low back in October screams “break out pattern” to me. I REALLY like a bull put spread here! Super low risk…and super potential to cash the short leg at much higher prices, and ride it back down for high profits through loss reduction on the long leg (thank you Verne!). I’m using March expiry.
Most welcome!
I love spreads!
Amazing how few traders trade ’em! 🙂
MACD has a bullish crossover on the daily chart.
2740 is the next battle line and the 200 day ma is around 2760. I am thinking some short correction about that time. Of course, followed by another push up through the 2740-2760 congestion area.
Interest rates on 20 year bonds taking off; TLT in intraday crash mode. Strongly appears the counter-trend move at the daily TF is over. I took my loss on my long and doubled down on my short (with a march expiry so I have time to “be right”).
Any NDX traders? Hourly view. I will be taking profits for sure as price approaches the combination of that major down trend line and the 100% retrace fibo from a prior swing high (around 6908).
Wow, that looks like 3rd wave move ?
Yup. iii of 3 of some degree (no time to look at the moment).
Look at those overlapped fibos….that’s proof of FRACTAL MARKET STRUCTURE right there. Awesome.
Hourly trend shot from neutral to strong up with the crack of the trend line yesterday. Up up and away! May be some significant small degree iv forming under the 78.6%, that’s absolutely nominal, and for those wanting to get on board, may provide a slightly lower entry point.
So Kevin that RUT strong turn up earlier was a sign then, I think RUT seems like behaving a leading indicator. It was the first one to breakdown in Sep.
You don’t have anywhere near enough data points to have reasonable confidence in that. Nor will you ever. Bulkowski “shows” patterns work by assessing what, 50-200 such situations? Not statistically significant in a situation with high variance, which is why I have zero confidence in his pattern claims. From the world of online poker, I have learned that we don’t get REAL confidence in positive expectation until we get perhaps 50,000 hands worth of data, 20,000 bare minimum,. As an example.
Nope! It is a ” C” wave. 🙂
Ok sorry I confused you.
When I said it will have more downside. I meant once P5 completes and all markets go into bear markets, RUT should fall faster and lower than the rest.
I am currently long RUT.
Yea, that’s quite different!
Right off I’d tend to agree with that assessment. But pragmatically, I’m not sure it matters. The coming price collapse after the P5 will be EPIC EPIC EPIC across all markets. Does the whole financial system go belly up is the serious question. Perhaps Chris sometime can inform us as to what good strategies might be to both participate…and protect ourselves!
My current hourly view of RUT.
That’s a nice strong turn and bounce off a 100% retrace fibo, and indicates that the likely general direction at this TF is up. However, the actually MEASURED trend is still sideways (neutral = white).
Love to see RUT push up above the 78.6% overhead. If/when that happens, could/should be off to the races.
Yea HAW!!!!
I expect a bit of consolidation right under that 78.6%. I took my profits right here, with an intent to reenter lower. Or…a bit higher if need be.
SPX also stalling right at a 78.6% (2722). Standard.
The first and most basic principle of successful trading is getting the immediate trend right. If you do not have a set of metrics that let you confidently determine what it is (everthing else is market noise) you are probably going to get bamboozled by the banksters.
When’s the turn Verne?
Thank you, Mr. Powell!
I will be cashing in very profitable upside hedges at the open tomorrow.
I am now massively short! 🙂
Ian:
Look for an impulsive move back below the DJIA 25K and SPX 2.7K pivots.
I think we will probably see it this week. 🙂
Can you define “immediate trend” for us in this context?
Can you inform us what metrics you utilize to determine this “immediate trend”?
With your definitions and measures, what’s the state of SPX right now?
That’s what I use ADX for. It indicates if the market is trending, or not.
And if it’s trending it tells you what direction.
The limitation of course is it is a lagging indicator as it’s based upon averages.
And so the only other method I use is looking for a series of higher highs and higher lows for a bull trend, or lower lows and lower highs for a bear trend.
Keeps it nice and simple. IMO.
I’ll add that interpreting the DI+, DI-, and ADX value in combination is a little tricky. Here’s what I do for my trend indicator (and if someone has better suggestions here I’m all ears!). Note: what I call “ADX trend” here is my “computed” assessment of the trend. The final result is always one of up, neutral, or down.
• If ADX >= 15 and the ADX trend reading of the prior bar is UP and
the current bar’s DI+ > DI-, then ADX trend for the current bar is UP.
• If ADX >= 15 and the ADX trend reading of the prior bar is DOWN and the current bar’s DI- > DI+, then the ADX trend for the current bar is DOWN.
• If the prior bar’s ADX trend is NEUTRAL or DOWN and DI+ > DI- and the ADX value is higher than the prior bar’s ADX value, then the ADX trend for the current bar is UP.
• If the prior bar’s ADX trend is NEUTRAL or UP and DI- > DI+ and the current bar’s ADX value is lower than the prior bar’s ADX value, then the ADX trend for the current bar is DOWN.
* If ADX < 15 then ADX trend is NUETRAL.
Then I layer onto that reading the Commodity Channel Index, and if CCI > 100 then it's STRONG up, and if CCI < 100 it's STRONG down. Otherwise, I interpret the above ADX assessment as "mild up" or "mild down".
That's how I get my "5 levels" of trend, for every timeframe I look at.
Also RUT is really underperforming now, looked very strong there for a day or 2..
perhaps because interest rates have been rising since the high last Friday. RUT extremely sensitive to interest rates.
Thanks Kevin.
RUT has always moves in mysterious ways. After I close my current trade I will only short it towards the end of P5.
I think it will have more downside.
Now it seems the best and strongest of the rest… hmm maybe started it 3rd wave around 1520+ if correct
So the zigzag alternate count is invalidated now??
What are other options for verne’s bearish 2400 target? (Not sure if 2400 was mentioned)
On Lara’s daily chart for the Zig-Zag, she indicates 2685.75 as the “short term” invalidation. So the Zig-Zag as labeled is invalidated. However, I think “short term” means there may be another way to label the Zig-Zag which keeps it as possible.
That being said, breaking the 2685.75 today and breaking out of the downward sloping channel yesterday, gives a great deal of confidence in the main count with Primary 4 over.
Lara will confirm or correct my comment late in the day when she checks in. I hope this helps.
I do believe that “target” will be hit (and price will go much, much, much further down). After the P5 completes the entire grand super cycle.
My $0.02.
I could label minor B of the zigzag continuing. But it would be getting just way too long in duration now.
I may discard it.
I may also discard other ideas of P4 continuing.
My main count has reasonable confidence now. It does look like P4 was over and now P5 is underway.
It’s put up or shut up time for the market re: our models. Either into 3 of 3 action in the next day or two…or down in the zig-zag (or double z-z).
That makes things rather deterministic here: re how to manage whatever market action we get. Up means up and probably some high momentum up. And down means very very likely some high momentum down.
Who said trading was hard. (Actually I do.)
That’s what straddles are for right ?…:)
Me too.
Premarket futures are telling us “It is up, up and away.”
I am going to steal the following from an article and also post the link to the article.
Why? because I am old and remember all the following and what was said at that time as well…
“This is how old I am. … Old enough to remember being told that by now…
We would be living through a new Ice Age by the year 2000.
We would all die when the ozone layer disappeared.
The oceans would be dead.
Global Cooling would destroy the world.
Acid rain would destroy our forests.
Overpopulation would result in worldwide famine.
We would deplete our natural resources.
We would run out of oil.
The polar ice caps would melt.
Manhattan would be underwater.
People who live in cities will have to wear gas masks.
Nitrogen buildup will make the land unusable.
“Decaying organic pollutants would use up all of the oxygen in America’s rivers, causing freshwater fish to suffocate.”
And that is just the Big Stuff, the world-shaking predictions the oh-so holy scientific consensus got horribly wrong during my lifetime. Yes, that science was also declared settled.”
This article is worth a read…
https://www.breitbart.com/politics/2018/11/27/nolte-only-anti-science-suckers-believe-climate-change-hysteria/
I think the geo-physicists do a much better job at trying to compute possible anthropogenic perturbation on global weather and climate, as compared to so-called climatologists. Some of the data put out by the latter is highly problematic, and this fact is starting to find its way into the public domain.
One thing the geo-physicists have consistently shown is that barring cataclysmic events like massive volcanic eruptions, geo-centric causation for cooling and warming cycles is miniscule compared to solar-centric ones. If you look at the expected efficacy of doing EVERYTHING the climate change adherents demand, ignoring any kind of cost/benefit ratio analysis, you would come to the inescapable conclusion that you were missing something. O.K Joe. I took the bait and that is my two pennies on the subject! Interesting read. Thanks for the link! 🙂
Leaving these comments here because everyone is remaining super polite.