
Upwards movement completes a candlestick reversal pattern. This and volume indicate the Elliott wave counts should be swapped over today.
Summary: For the short term, a low may be in place if the teal trend line offers support. A target for the next wave up is either 2,973 or 2,975. Have some confidence in this view if price makes a new high above 2,685.75 and if price breaks out of the best fit channel on the main hourly chart.
It now looks most likely that primary wave 4 was over on the 29th of October.
New updates to this analysis are in bold.
The biggest picture, Grand Super Cycle analysis, is here.
Last published monthly chart is here, video is here.
MAIN ELLIOTT WAVE COUNT
WEEKLY CHART
Click chart to enlarge.
The main and alternate wave counts are swapped over.
Today’s classic technical analysis more strongly favours this wave count.
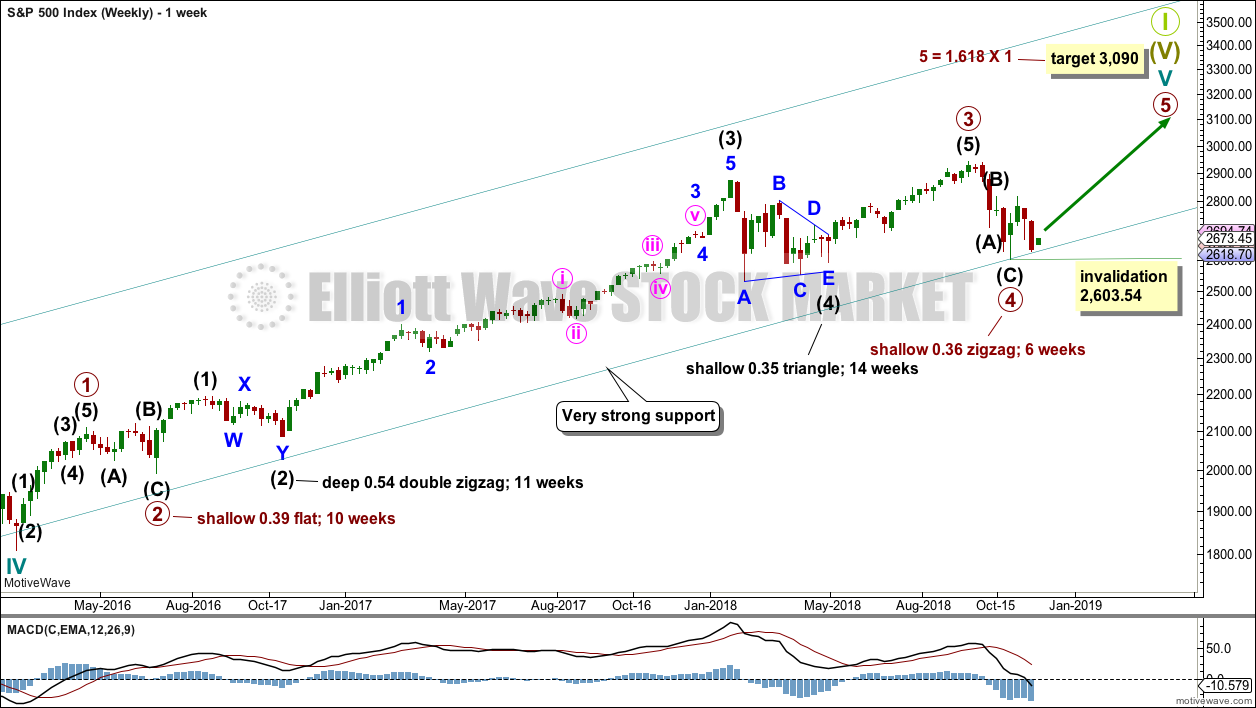
Cycle wave V must complete as a five structure, which should look clear at the weekly chart level and also now at the monthly chart level. It may only be an impulse or ending diagonal. It is clear it is an impulse.
Cycle wave V has passed equality in length with cycle wave I, and 1.618 the length of cycle wave I. The next Fibonacci ratio is used to calculate a target. When primary wave 4 is complete and the starting point for primary wave 5 is known, then the final target may also be calculated at primary degree. At that stage, there may be two targets, or the final target may widen to a small zone.
Within cycle wave V, the third waves at all degrees may only subdivide as impulses.
Within primary wave 3, there is perfect alternation and excellent proportion between intermediate waves (2) and (4).
Primary wave 4 may find very strong support about the lower edge of the teal channel, and it looks like this is from where price bounced on the 29th of October. This channel is copied over from the monthly chart and contains the entire bull market since its beginning in March 2009. While Super Cycle wave (V) is incomplete, this channel should not be breached at the weekly chart level.
Draw the teal channel from the high of cycle wave I at 1,343.80 on the week beginning 3rd July 2011, to the high of cycle wave III at 2,079.46 on the week beginning 30th November 2014, and place a parallel copy on the low of cycle wave II at 1,074.77 on the week beginning 2nd October 2011. Draw this chart on a semi-log scale. Price is right at the lower edge of this channel. This may provide support. A small overshoot, like that seen at the end of cycle wave IV, would be entirely acceptable. If price does move below the channel, then it should reverse reasonably quickly.
It is possible that primary wave 4 could be over as a relatively quick zigzag, ending about support at the lower edge of the teal channel.
The proportion between primary waves 2 and 4 is reasonable. Flat corrections tend to be longer lasting structures than zigzags. There would be perfect alternation in structure and inadequate alternation in depth. This is acceptable.
This wave count has the right look at the monthly chart level.
If primary wave 5 ends at or after the end of December 2018 and the AD line fails to make new all time highs, there would then be the minimum required four months of bearish divergence between price and the AD line. If this happens, then the conditions for the end of this bull market would be in place.
A target is calculated for primary wave 5 to end. If primary wave 5 were to be only equal in length with primary wave 1, then it would be truncated. A truncated primary wave 5 would be unlikely as then there could be no bearish divergence with the AD line. The next Fibonacci ratio in the sequence is used to calculate a target for primary wave 5.
Within primary wave 5, no second wave correction may move beyond the start of its first wave below 2,603.54.
DAILY CHART
Click chart to enlarge.
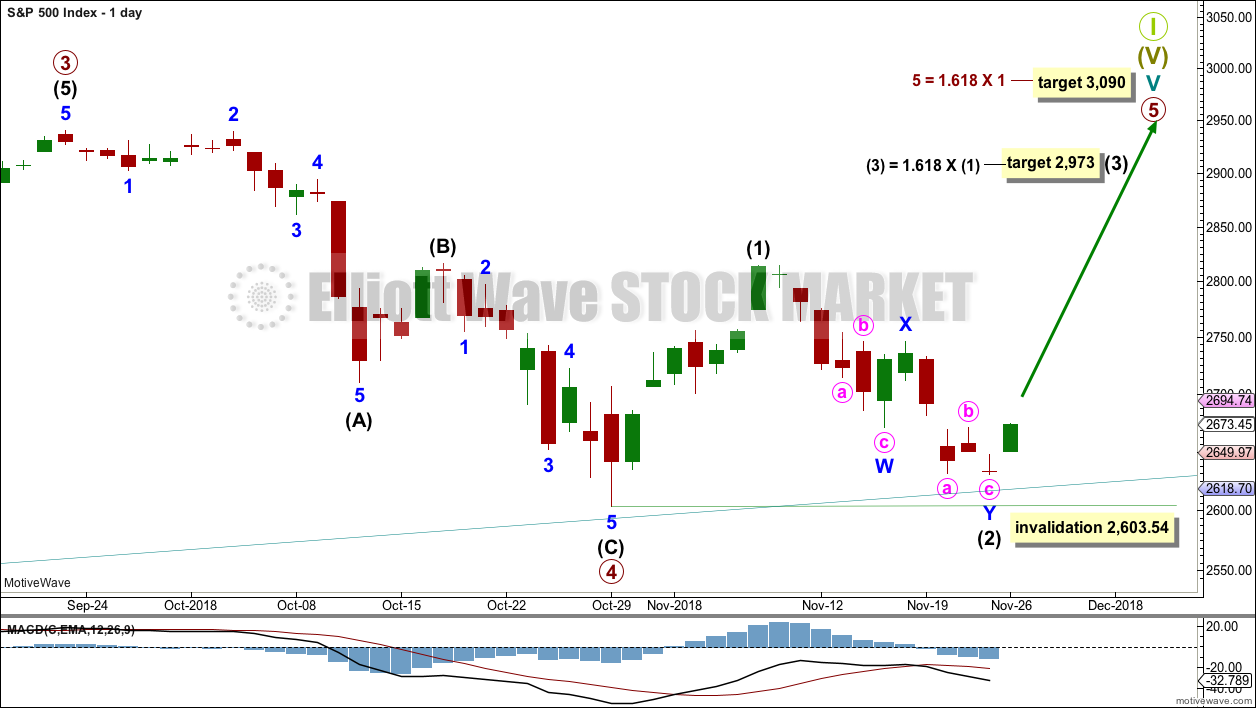
The subdivisions of primary wave 4 are seen in exactly the same way as most of the charts below except the degree of labelling is just moved up one degree.
Within primary wave 5, intermediate wave (1) may be over. Intermediate wave (2) may not move beyond the start of intermediate wave (1) below 2,603.54. Intermediate wave (2) may have ended at support at the lower edge of the teal trend channel.
Primary wave 5 may subdivide either as an impulse (more likely) or an ending diagonal (less likely). Intermediate wave (1) may be seen as either a five wave impulse or a three wave zigzag at lower time frames, and so at this stage primary wave 5 could be either an impulse or a diagonal.
Primary wave 5 at its end may be expected to exhibit reasonable weakness. At its end, it should exhibit a minimum of 4 months bearish divergence with the AD line, it may exhibit bearish divergence between price and RSI and Stochastics, and it may lack support from volume; it may not be possible to distinguish a weak fifth wave from a B wave.
HOURLY CHART
Click chart to enlarge.
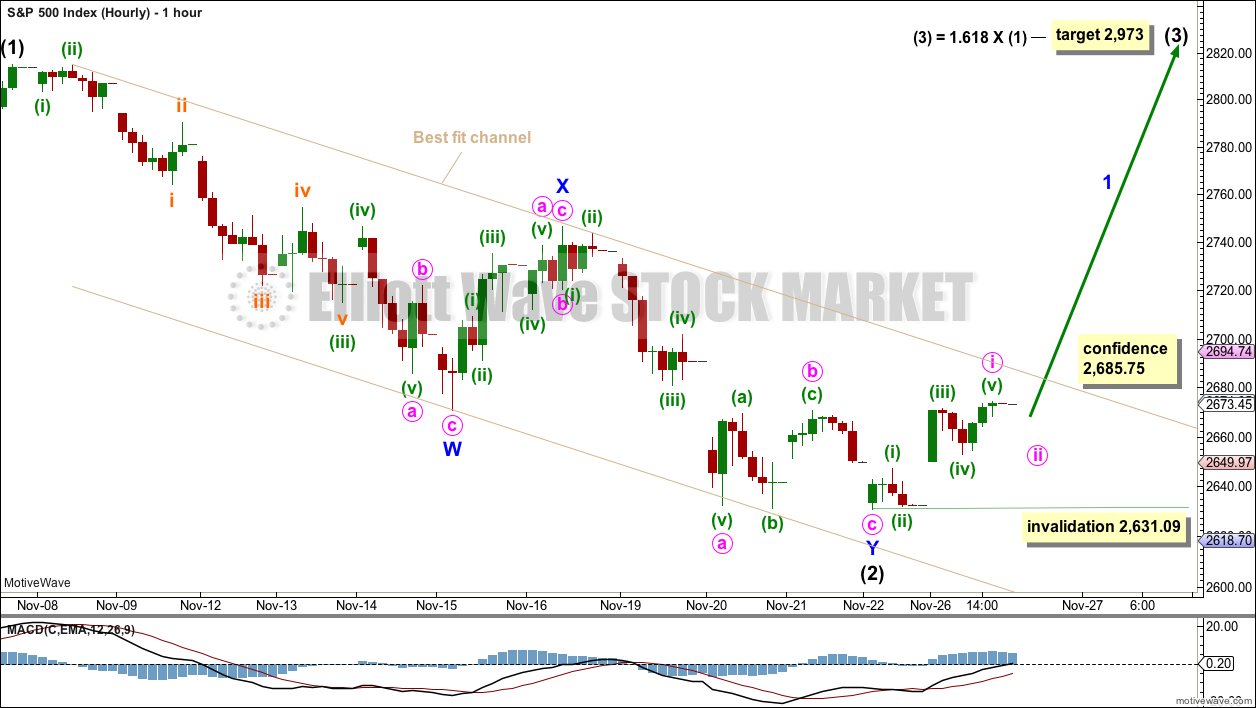
Intermediate wave (3) may only subdivide as an impulse if primary wave 5 subdivides as an impulse.
Within intermediate wave (3), minor wave 1 may be incomplete.
Within minor wave 1, minute wave i may be complete at today’s high, or it may continue a little higher when markets open tomorrow. Minute wave ii may not move beyond the start of minute wave i below 2,631.09.
Some confidence may be had in this wave count if price breaks above the upper edge of the best fit channel. Further confidence may be had if price makes a new high above 2,685.75.
ALTERNATE ELLIOTT WAVE COUNT
WEEKLY CHART
Click chart to enlarge.
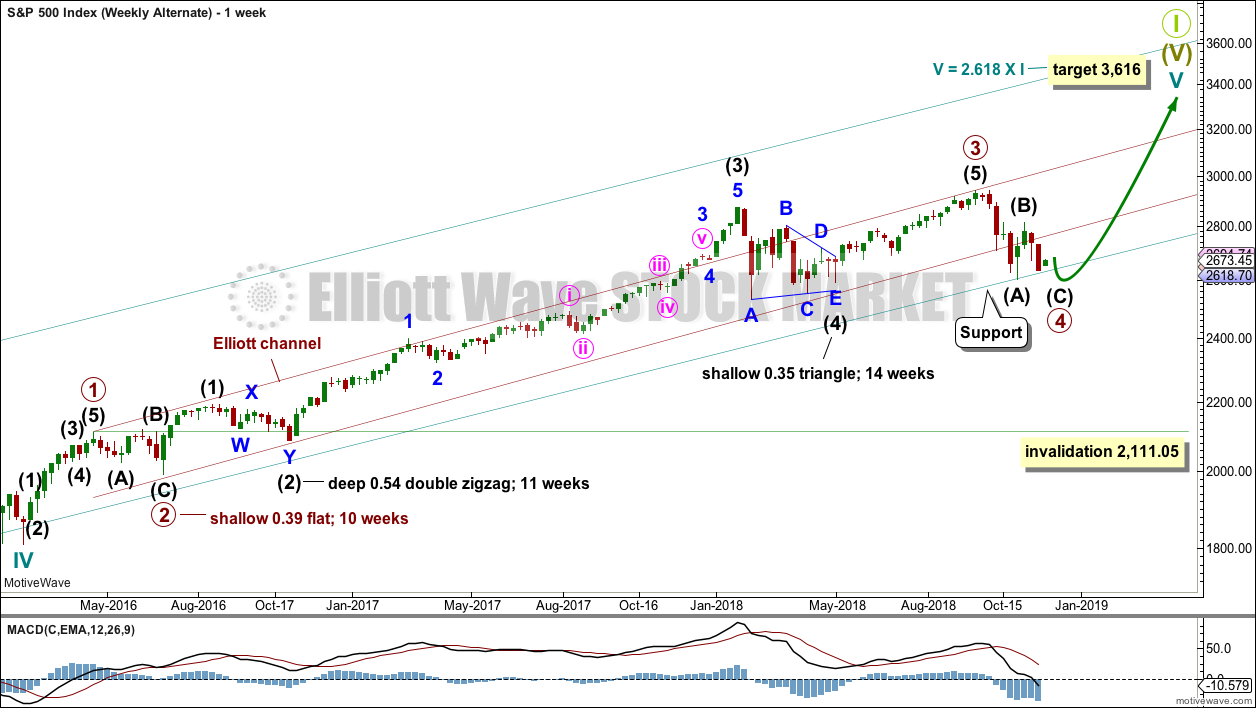
It is also still possible that primary wave 4 may be incomplete. However, at this stage, if primary wave 4 is incomplete and continues for a further several weeks, it would now be out of proportion to primary wave 2. Primary wave 2 lasted 10 weeks. If primary wave 4 is incomplete, then so far it has lasted 10 weeks.
If primary wave 4 is incomplete, then the most likely structure would be a zigzag which could complete this week.
Primary wave 4 may not move into primary wave 1 price territory below 2,111.05.
For this alternate wave count, when primary wave 4 may be complete, then the final target may be calculated at primary degree. At that stage, there may be two targets, or the target may widen to a small zone.
DAILY CHART – ZIGZAG
Click chart to enlarge.
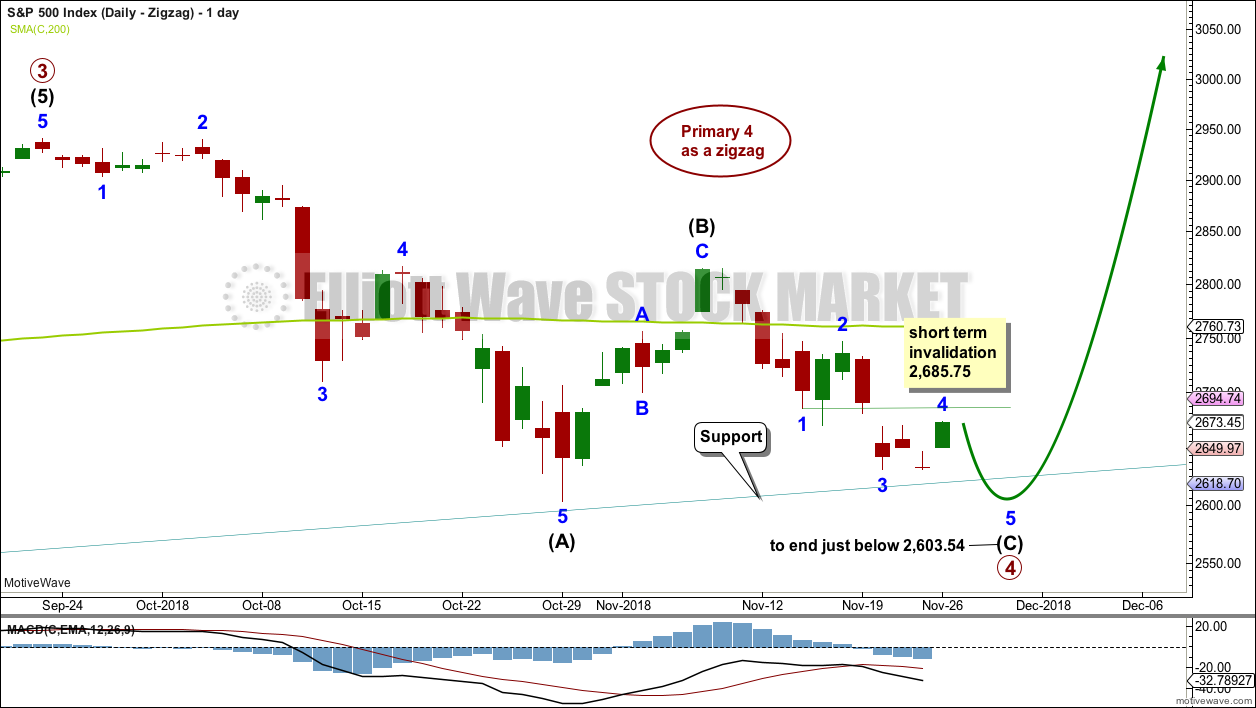
Primary wave 4 may be unfolding as a single zigzag, which is the most common type of corrective structure. This would provide perfect alternation with the flat correction of primary wave 2.
Within the zigzag, intermediate wave (B) may be a complete structure, ending close to the 0.618 Fibonacci ratio of intermediate wave (A).
Intermediate wave (C) may now unfold lower as a five wave structure. Intermediate wave (C) would be very likely to end at least slightly below the end of intermediate wave (A) at 2,603.54 to avoid a truncation. It may end about support at 2,600.
Within intermediate wave (C), minor waves 1 through to 4 may be complete. If this labelling is correct, then minor wave 4 may not move into minor wave 1 price territory above 2,685.75. Minor wave 5 may be relatively short and brief; this structure could be complete as quickly as just one more session.
This wave count could expect a reasonably small overshoot of the teal trend channel if the labelling within intermediate wave (C) is correct.
If the lower edge of the teal channel is overshot, then it would most likely be followed by a fairly quick reversal, possibly even intraday. If the bull market remains intact, then it would be most likely that there would not be a full daily candlestick below the trend channel, and very unlikely for a full weekly candlestick to print below the channel.
HOURLY CHART – ZIGZAG
Click chart to enlarge.
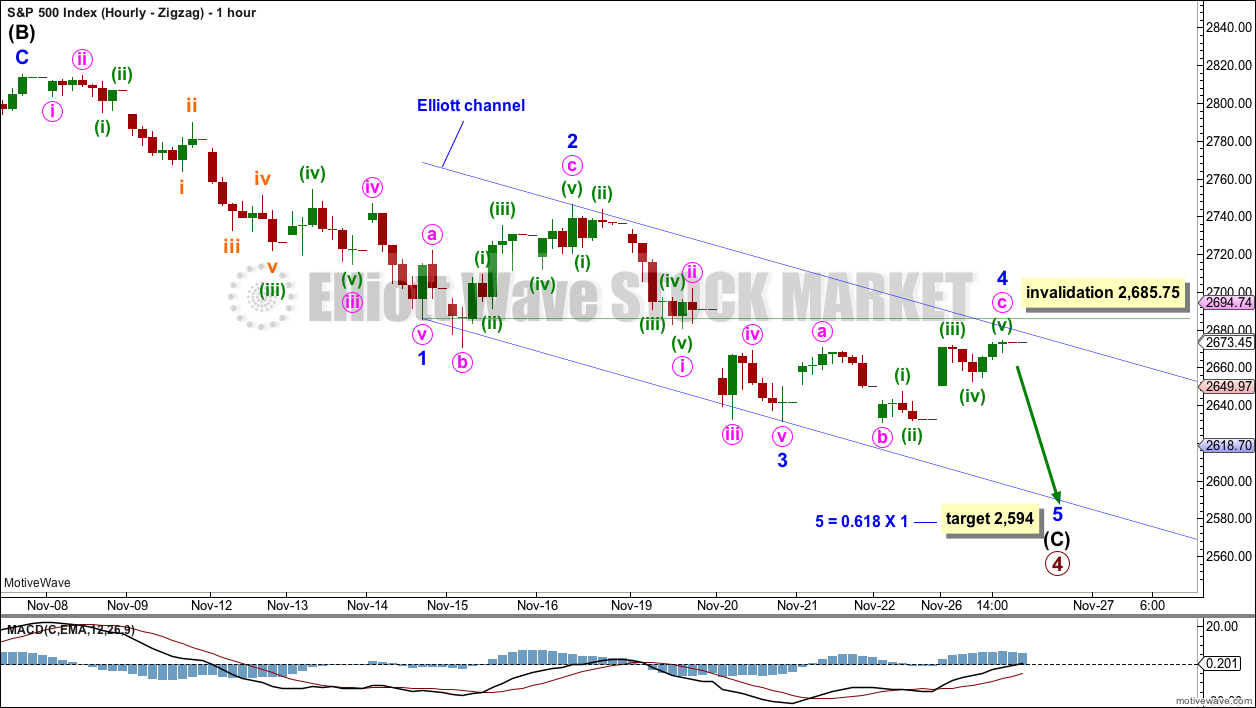
Intermediate wave (C) is labelled as an almost complete five wave impulse.
Minor wave 3 is shorter than minor wave 1, and it exhibits no Fibonacci ratio to minor wave 1. This limits minor wave 5 to no longer than equality in length with minor wave 3, so that the core rule stating a third wave may not be the shortest is met. This limit is at 2,559.12.
Because there is no adequate Fibonacci ratio between minor waves 3 and 1, it is more likely that minor wave 5 will exhibit a Fibonacci ratio to either of minor waves 3 or 1. A ratio to minor wave 1 would be most likely.
If the target is wrong, it may be too low. There is very strong support below at the teal trend line, which is seen on the daily and weekly charts.
DAILY CHART – TRIANGLE
Click chart to enlarge.
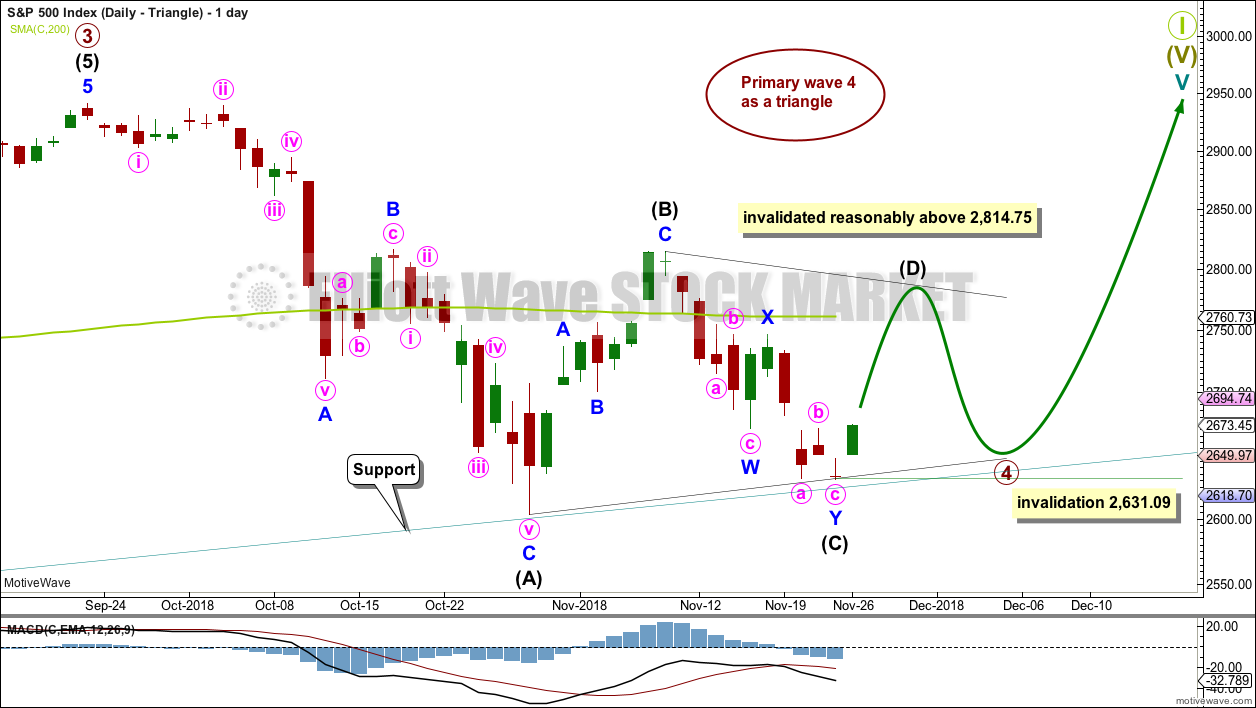
If primary wave 4 unfolds as a triangle, it would have perfect alternation with the regular flat correction of primary wave 2. It would also continue to find support about the lower edge of the teal trend channel. Triangles are fairly common structures for fourth waves.
The triangle is relabelled today to see intermediate waves (A), (B) and (C) now all complete. Intermediate wave (B) is shorter than B waves of triangles usually are; this gives the triangle an odd look. However, considering the duration of primary wave 4 so far, this labelling now makes more sense.
Intermediate wave (C) may have completed as a double zigzag. This is the most common triangle sub-wave to subdivide as a multiple.
Price has bounced up off the lower edge of the teal trend channel.
If the triangle is a regular contracting triangle, which is the most common type, then intermediate wave (D) may not move beyond the end of intermediate wave (B) above 2,814.75.
If the triangle is a regular barrier triangle, then intermediate wave (D) may end about the same level as intermediate wave (B). As long as the (B)-(D) trend line remains essentially flat a triangle would remain valid. This invalidation point is not exact; intermediate wave (D) can end very slightly above 2,814.75.
The final wave down for intermediate wave (E) may not move beyond the end of intermediate wave (C) below 2,631.09.
DAILY CHART – COMBINATION
Click chart to enlarge.
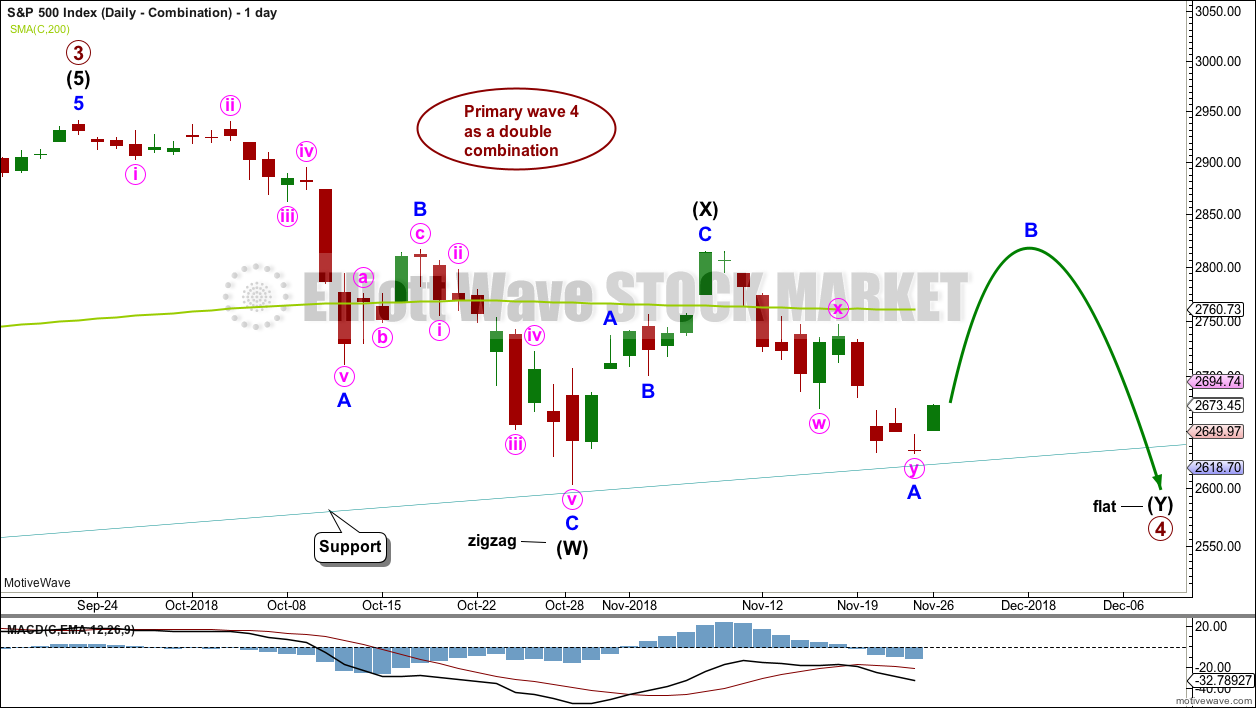
This wave count is judged to have only a very slightly lower probability than the triangle.
Primary wave 4 may be unfolding as a double combination. The first structure in the double may be a complete zigzag labelled intermediate wave (W). The double may be joined by a three in the opposite direction labelled intermediate wave (X). Intermediate wave (X) may be complete as a single zigzag; it is deep at 0.63 the length of intermediate wave (W), which looks reasonable.
Intermediate wave (Y) would most likely be a flat correction, which should subdivide 3-3-5. At its end, it may still find strong support about the lower edge of the teal trend channel.
At the hourly chart level, minor wave A may be a complete double zigzag.
Within the flat correction of intermediate wave (Y), minor wave B must retrace a minimum 0.9 length of minor wave A at 2,796.74. The common range for minor wave B is from 1 to 1.38 times the length of minor wave A giving a range from 2,815.15 to 2,885.09. Minor wave B may make a new high above the start of minor wave A at 2,815.15 as in an expanded flat.
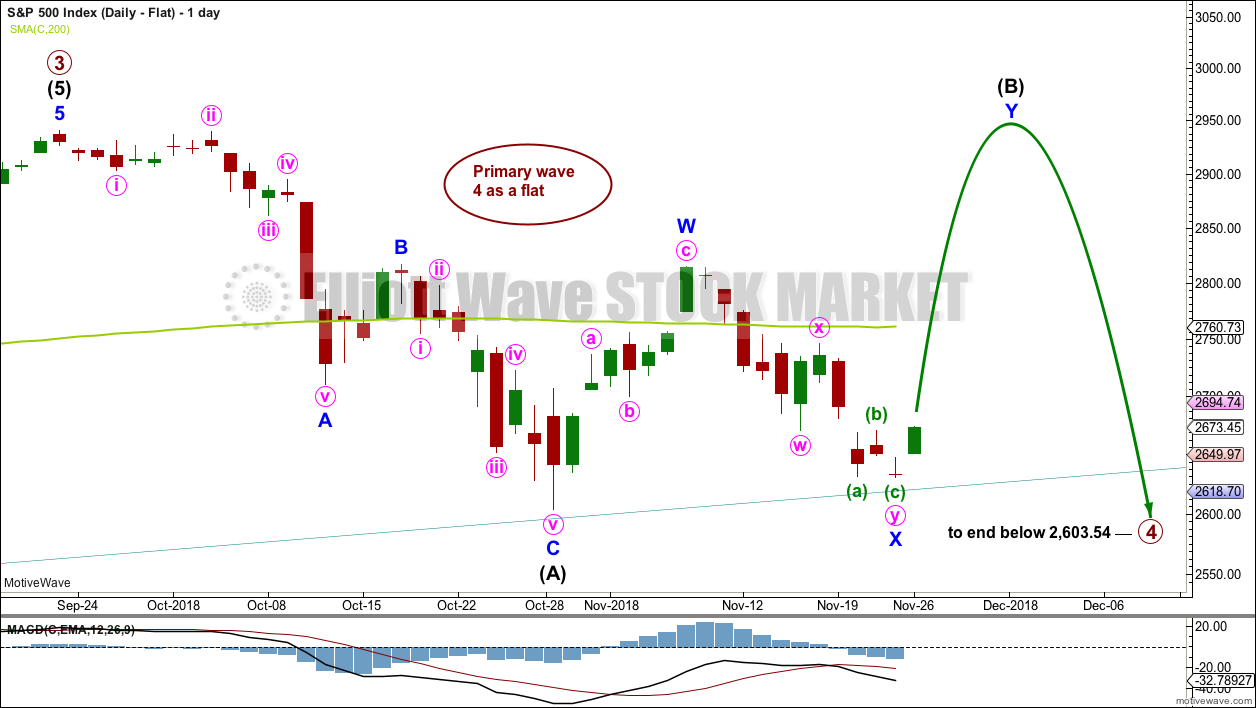
DAILY CHART – FLAT
Click chart to enlarge.
Primary wave 2 was a regular flat correction. If primary wave 4 unfolds as a flat correction, then there would be no alternation in structure between the two corrections; for this reason, this wave count is judged to have a low probability.
However, alternation is a guideline, not a rule, and it is not always seen. This wave count is possible.
If primary wave 4 is a flat correction, then within it intermediate wave (B) must move higher to retrace a minimum 0.9 length of intermediate wave (A).
When intermediate wave (B) is complete, then intermediate wave (C) should move below the end of intermediate wave (A) at 2,603.54 to avoid a truncation. This would expect a large overshoot of the teal trend line, which further reduces the probability of this wave count.
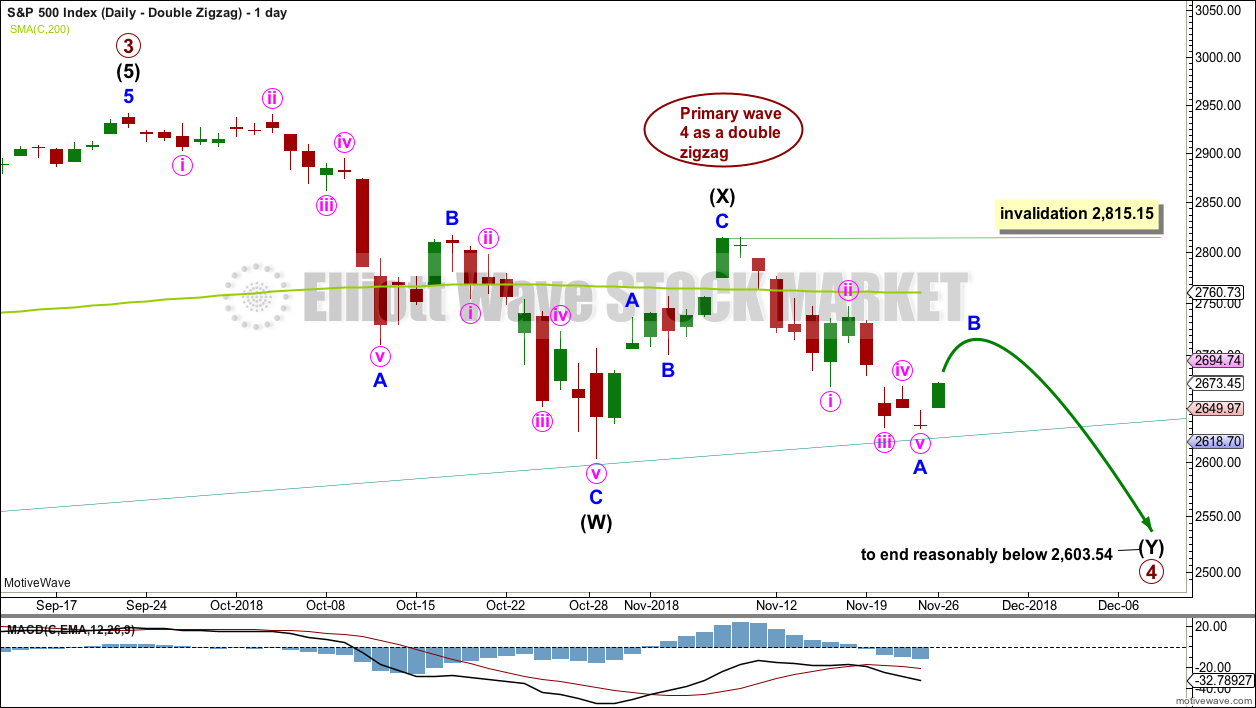
DAILY CHART – DOUBLE ZIGZAG
Click chart to enlarge.
Primary wave 4 may also be unfolding as a double zigzag.
The first zigzag in the double may be complete, labelled intermediate wave (W). The double may joined by a complete three in the opposite direction, a zigzag labelled intermediate wave (X).
The second zigzag in the double may have begun. It is labelled intermediate wave (Y). Within intermediate wave (Y), minor wave B may not move beyond the start of minor wave A above 2,815.15.
The purpose of a second zigzag in a double is to deepen the correction when the first zigzag does not move price deep enough. To achieve this purpose intermediate wave (Y) should be expected to end reasonably below the end of intermediate wave (W) at 2,603.54. This would expect a very large overshoot of the teal trend channel; for this reason, this wave count is judged to have the lowest probability.
TECHNICAL ANALYSIS
WEEKLY CHART
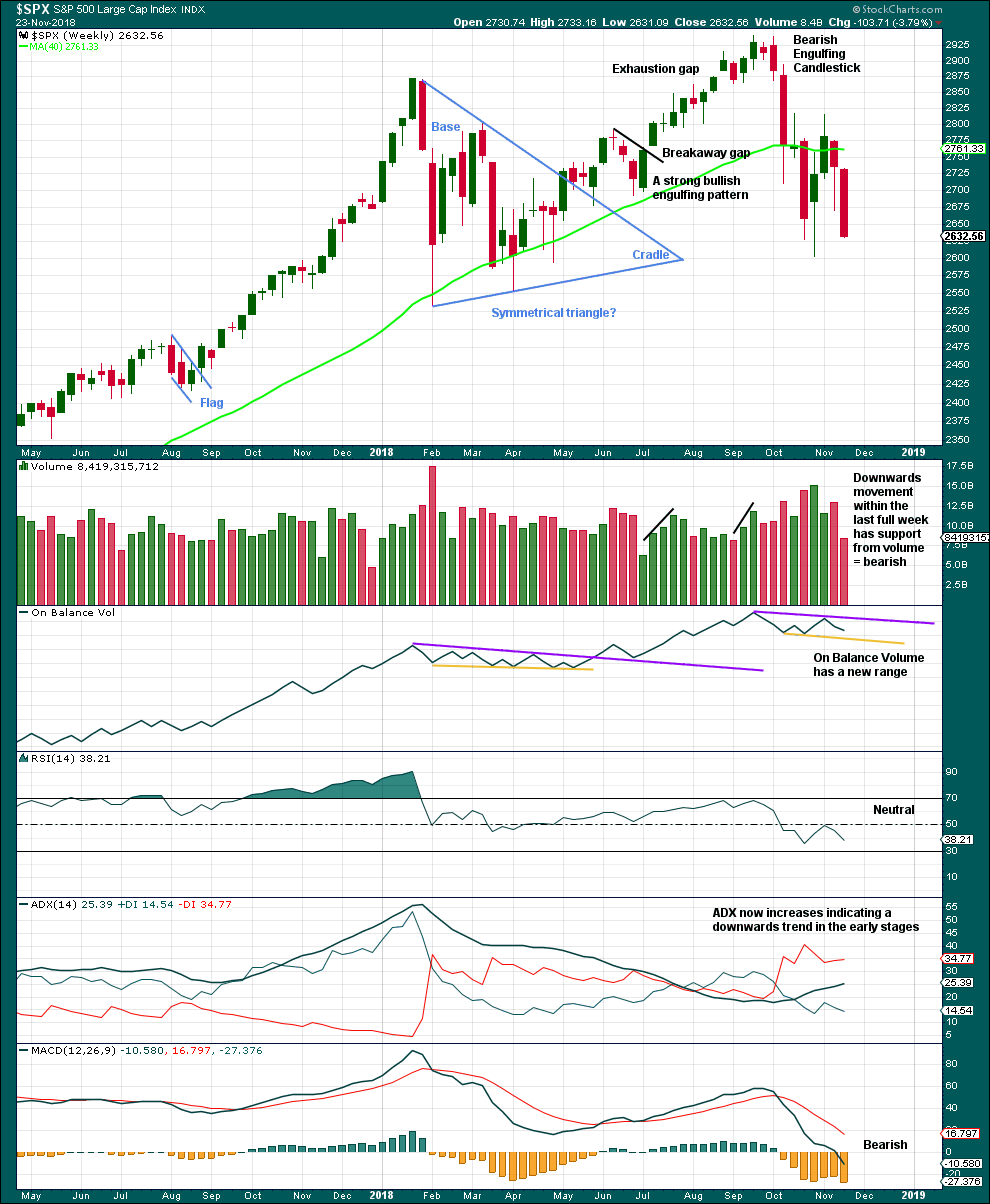
Click chart to enlarge. Chart courtesy of et=”_blank”>StockCharts.com.
With price closing almost at the low for last week, it looks like this week may move price lower.
Although volume is lighter last week, it was not a full trading week. No conclusion here about last week’s volume shall be drawn.
DAILY CHART
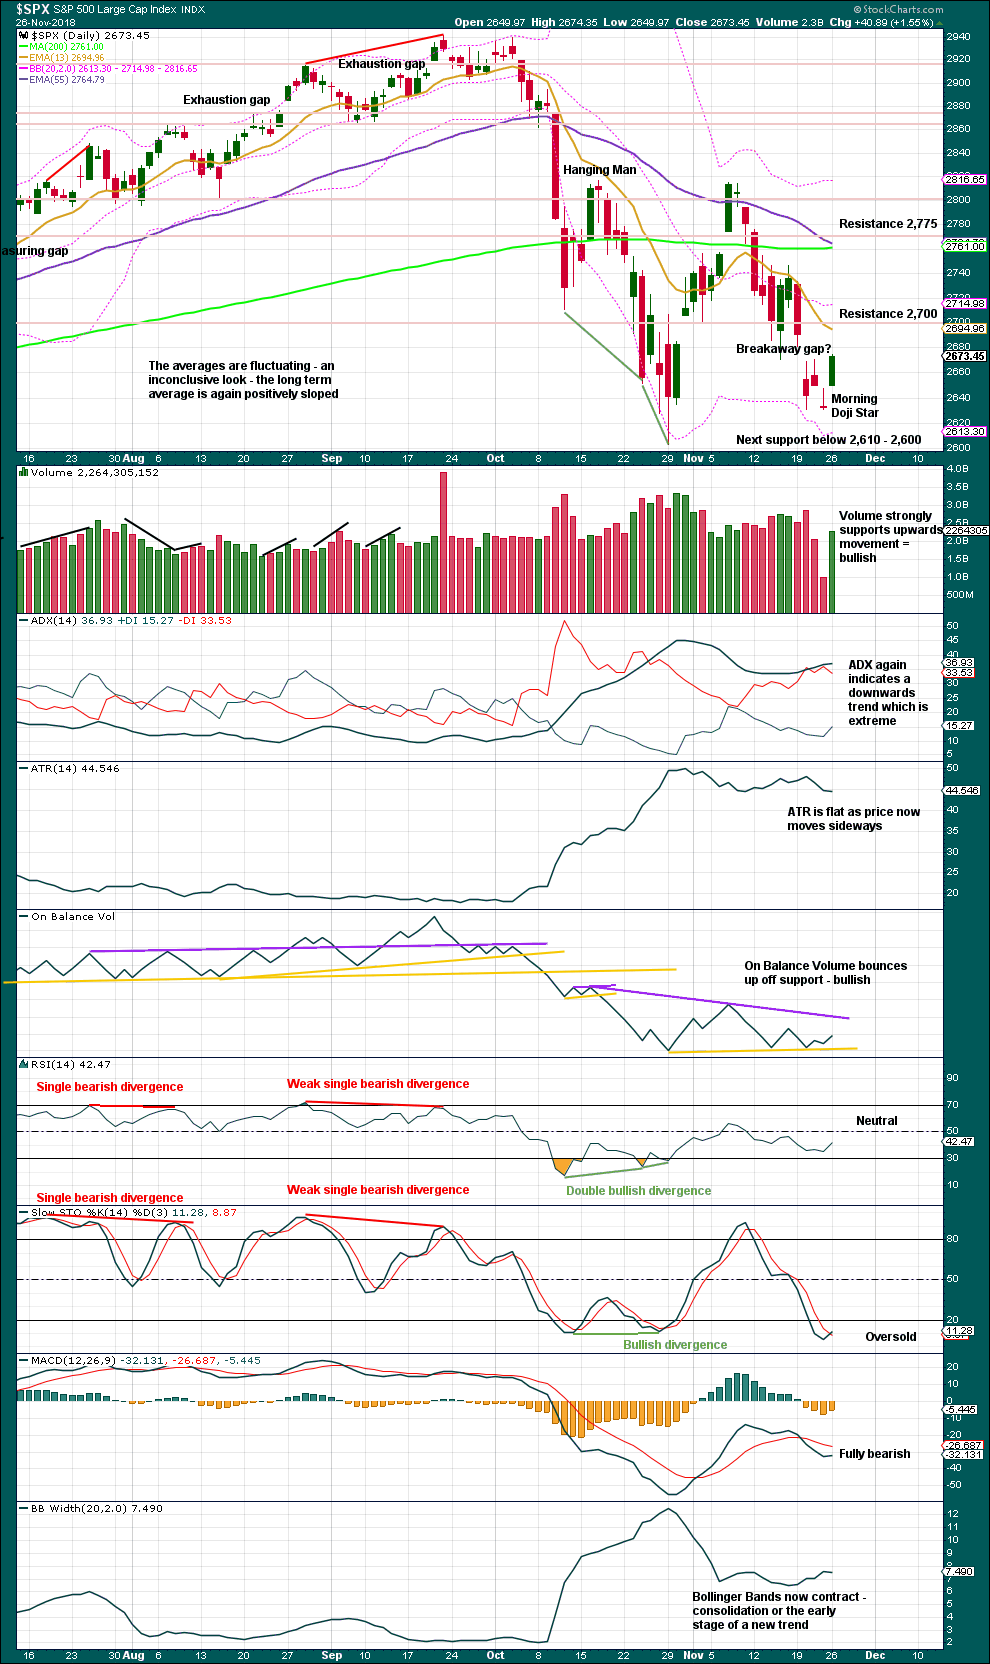
Click chart to enlarge. Chart courtesy of StockCharts.com.
The lower edge of the teal trend channel is not shown on this chart, but it should be considered as part of this technical analysis. Expect that trend line to continue to provide support, until it does not.
The last gap may be either a pattern or breakaway gap. It remains open, which is bearish.
Today completes a Morning Doji Star reversal pattern, which is very bullish. There is a gap between the doji and the first and third candlesticks of the pattern. This may be an abandoned baby bottom, which is extremely rare, although the candlestick of the 20th of November is within the range of the pattern.
Strong support from volume for today’s upwards movement and continued support for On Balance Volume all support the new main wave count.
BREADTH – AD LINE
WEEKLY CHART
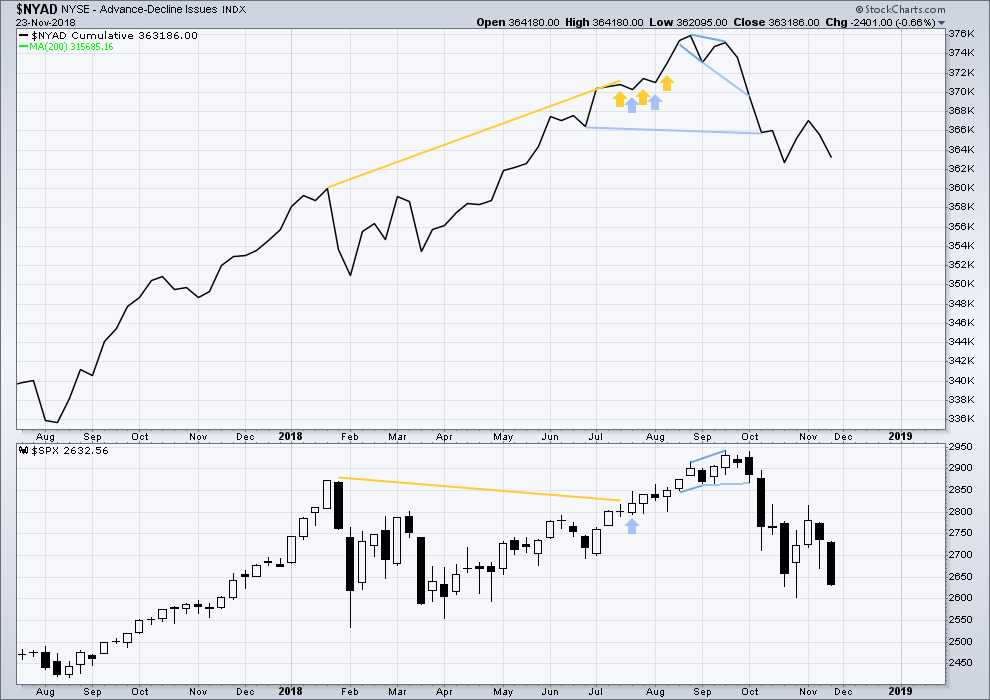
Click chart to enlarge. Chart courtesy of StockCharts.com. So that colour blind members are included, bearish signals
will be noted with blue and bullish signals with yellow.
Last week both price and the AD line have moved lower. There is no short-term divergence at this time frame.
DAILY CHART
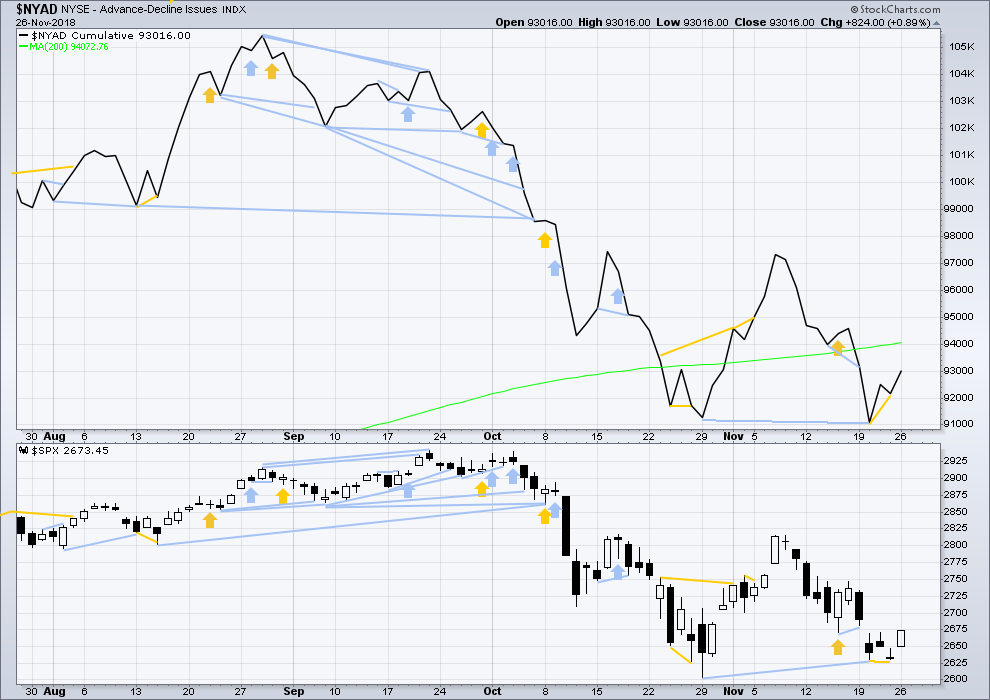
Click chart to enlarge. Chart courtesy of StockCharts.com. So that colour blind members are included, bearish signals
will be noted with blue and bullish signals with yellow.
There is normally 4-6 months divergence between price and market breadth prior to a full fledged bear market. This has been so for all major bear markets within the last 90 odd years. With no longer-term divergence yet at this point, any decline in price should be expected to be a pullback within an ongoing bull market and not necessarily the start of a bear market. New all time highs from the AD line on the 29th of August means that the beginning of any bear market may be at the end of December 2018, but it may of course be a lot longer than that.
Breadth should be read as a leading indicator.
Today’s upwards movement for price has support from rising market breadth. There is no new divergence.
VOLATILITY – INVERTED VIX CHART
WEEKLY CHART
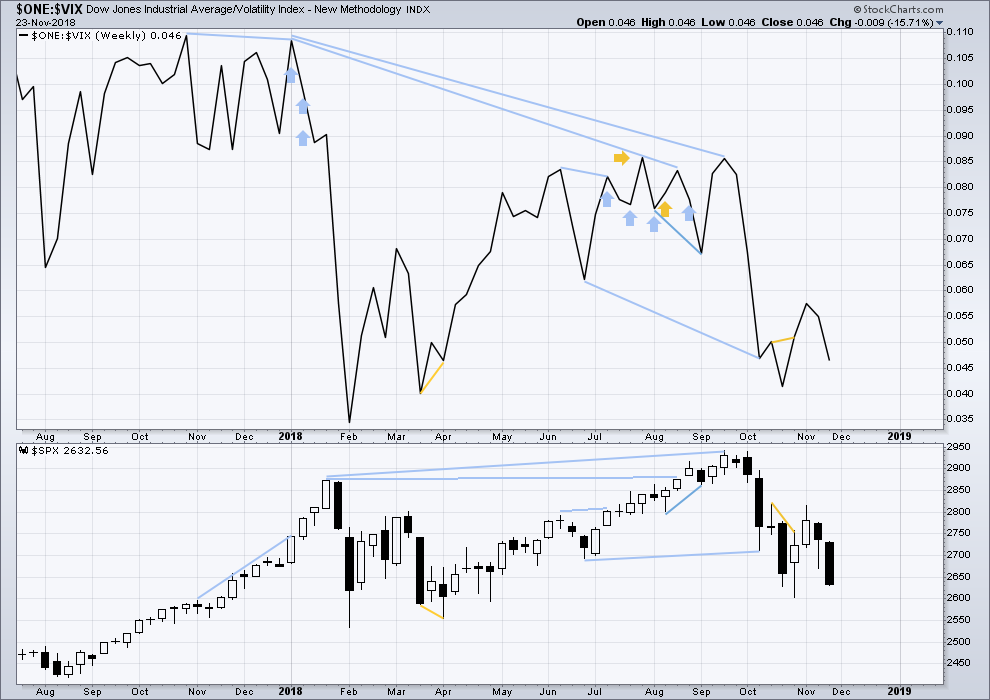
Click chart to enlarge. Chart courtesy of StockCharts.com. So that colour blind members are included, bearish signals
will be noted with blue and bullish signals with yellow.
Last week both price and inverted VIX have moved lower. There is no new short-term divergence at this time frame.
DAILY CHART
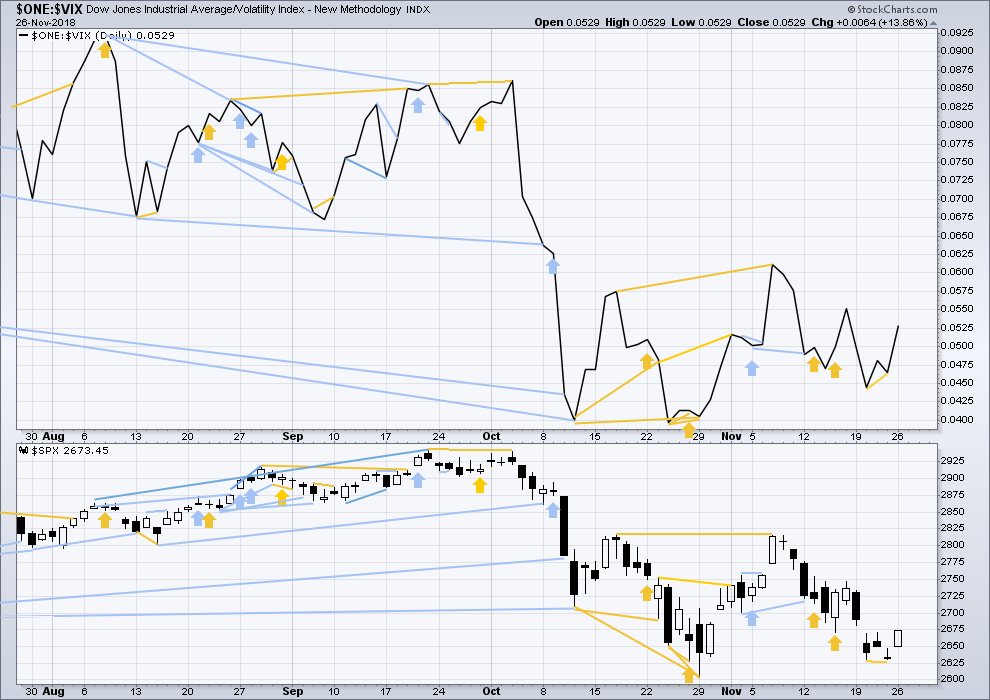
Click chart to enlarge. Chart courtesy of StockCharts.com. So that colour blind members are included, bearish signals
will be noted with blue and bullish signals with yellow.
Normally, volatility should decline as price moves higher and increase as price moves lower. This means that normally inverted VIX should move in the same direction as price.
Today’s upwards movement for price has support from a normal corresponding decline in VIX. There is no new divergence.
DOW THEORY
The following lows need to be exceeded for Dow Theory to confirm the end of the bull market and a change to a bear market:
DJIA: 23,344.52.
DJT: 9,806.79.
S&P500: 2,532.69.
Nasdaq: 6,630.67.
Published @ 10:16 p.m. EST.
—
Careful risk management protects your trading account(s).
Follow my two Golden Rules:
1. Always trade with stops.
2. Risk only 1-5% of equity on any one trade.
O.K. traders, notice the green VIX print today. 🙂
I have VIX closing @ 19 from 19.4 open, a red candle… or do u mean from yesterday close??
I took a small short (looking for that minor 2 down here off that trend line I believe) here at 2677. The instant my one minute trend indicator when “strong down”.
I already derisked a little by selling 1/4 of the position.
Just trying to make a little $ on this extremely slow day! And since I have significantly long…it’s kind of a “get in into a can’t lose position” kind of trade!
sorry, minute 2 down, not minor 2.
Sometimes (often times?) the action starting right at 3:30pm EST is “the real deal”, as the big players come in to adjust their positioning.
Hourly RUT view. Yes I like my fibo levels off “all” the significant swings; I like to see clusters (more potential for a turn there to be legitimate). The bright down line is a symmetric projection of the prior down move. Points right to a 100%/swing low. Yet more weight should the market turn there.
And of course price has pierced the uptrend line. But I like Lara view a trendline break as “complete” only when a bar fully underneath the TL forms.
I also look at the relative sizes of bars. I note from this chart that when RUT moves down significantly, it’s BIG BAR time. When it’s a sequence of little down bars, like here…the tendency is for a shorter swing to develop and complete. So as I see it, RUT is setting up nicely for a hourly TF long here. Turn and triggers.
The gap of the abandoned baby bottom may provide support. It remains open so far.
The upper edge of the best fit channel is providing resistance. Price is being squeezed. The wave count expects an upwards break above resistance, that may release energy for the middle of a third wave.
For the intrepid, NFLX has scribbled on it’s big 61.8% on the weekly/monthly chart, has bottomed and formed a higher low on the daily…but not yet a higher high. The hourly trend has shifted to strong up today per my indicator. And the 5 minute has executed an almost 61.8% pullback of the prior 5 move up, and turned back up.
I bought 290 calls for Jan. Stop is Friday’s low. I’m betting on up. If I take the small loss, I’ll be looking to try again a bit bigger, a bit lower. There are similarities to slot machines in instrument behavior; eventually, EVERY trend ends and turns, and that “history” can be edge if you work it right. It’s not dissimilar to playing blackjack; you don’t want to bet only on the first deal of a shuffle (i.e., move trades from here to there across instruments, vs. working a particularly instrument more thoroughly). You want to count as the deal progresses and wait for a deck rich in tens and aces to increase odds of BJ and the odds of the dealer busting…then make a much larger bet. That gives you an edge. It’s really the same thing re: “working” a particular instrument.
TLT showing pretty reasonable signs of turning back up exactly off the bottom of the bullish symmetry levels (prior down swing sizes during this 16 day so far up trend).
It still could tag the 38.2% at 115.9 and turn down though. Which will be fine by me too.
I note that RUT has moved up and has now turned down sharply off of the 61.8% retrace level of the prior multi-hour swing down. How far down it goes is anyone’s guess, but I do expect it will be “more”.
Similarly, SPX retraced and has initiated a turn off the 38.2% of the prior multi-hour down swing (11/16 high to 11/23 low). Not really “confirmed” yet though…
Here is what I have so far. I would say it is bullish in that the ‘b’ wave makes a higher high demonstrating relative strength. I suspect a flat correction for Minute ii will finish today or tomorrow morning. Minute iii should finally break out of the channel.
From t he chart, one might be able to see my difficulty in Minuette i off the Minor 2 low. It looks like a 3 wave move to me.
Also, this is not trading advice just commentary, the end of Minute ii around 2648 would be a good low risk entry to go long. The stop loss could be set below the bottom of Minor 2 which is about 2631 or 17 SPX points below. The upside is that Minute 3 and all of Primary 5 moves much higher as Lara has outlined.
Make minuette (ii) an expanded flat. Then everything fits.
My label for minuette (i) on my hourly chart is in the wrong place. I’ll fix that.
Thanks so much. I knew you would have an answer simple enough.
Verne’s not here but I think I know what he would say, and I have to agree: this action looks awfully corrective, and not impulsive. So far.
Yes Kevin it does look like that…
May be to trap as many people as they can, similarly at the top it never looks like that it will ever go down…
To me VIX has been crushed yesterday and doesn’t seem too bullish today as well, so may be a low VIX melt up as whole of last year
That is why you are a TRADER! 🙂
Question Lara. I struggled all day yesterday labeling the first move off the 2631.09 low. The main count has this low as the end of Primary 4 and the move up to 2647.55 labeled as Minuette i. On the hourly chart Minuette i looks fine. But on the 5 minute chart I cannot see how it is labeled as a 5 wave impulse.
Please clarify for me as you have time. Thanks and have a great day.
Perhaps it is a leading diagonal.
Not really sure if this changes your question, but doesn’t the main count have primary wave 4 ending on October 29th at 2603.54?
You are absolutely correct Paul C. Thanks for pointing it out. In the second sentence, I should have written Intermediate 2 instead of Primary 4. Let me restate it:
I struggled all day yesterday labeling the first move off the 2631.09 low. The main count has this low as the end of Intermediate 2 and the move up to 2647.55 labeled as Minuette i. On the hourly chart Minuette i looks fine. But on the 5 minute chart I cannot see how it is labeled as a 5 wave impulse.
Minor 2 not Primary 2 or Intermediate 2. Where is my head today? The chart I posted above gives a picture of my challenge to label Minuette i (green color).
This happens when I try to do two or three things at once. Slow down Rodney! My apologies to all for wasting your time with this major malfunction of the brain. It is one good reason for me to keep my trading / investing simple.
My guess is this Minute ii is headed to about 2648, the 61.8% retracement of Minute i.
Or 2640.5, the 78.6% retrace level. Saves the abandoned baby too…
Or, 38.2% was enough…
Can the abandoned baby bottom be invalidated at this point?
As all of us who have raised children know…that might be a sticky mess!
Charging the big down trend line…Giddyup!
Lara,
Do you still think that P5 will end around Oct-2019 or the current bullish main count has changed your mind?
I guess once it’s confirmed that we are in P5 you would be able to provide better timeline.
Thanks
For the new main wave count it could end any time from the end of this December.
Maybe March next year?
October is a common month for bear markets to begin. March is another.
Bullish abandoned baby bottom! I had to look up that one. They are quite rare but equally reliable. I think this 3 candle pattern fits all the requirements and is in fact, an abandoned baby bottom. It is ‘abandoned’ because it gets left behind. Santa Claus may be on his way.
Good spot Lara. Thanks. But I am not surprised you identified it.
McClellan Oscillator closed above zero today confirming the recent buy signal of last week.
I’m saying it “may” be an abandoned baby bottom, because yes, it does meet all the requirements as given in Nison for the three candlesticks.
But…
The candlestick immediately prior is within the range of the doji. So the gap is only between the doji and the other 2 candlesticks of the pattern, and not between the doji and the candlestick two sessions prior.
I would have thought a proper abandoned baby bottom would see the doji sitting below all prior movement so that it really is abandoned.
Claiming #1 and #2.
Rodney!! I thought pigs got slaughtered…
Oink Oink! Headed to the pork barrel.