
A quiet end to a short-trading week makes little difference to all five Elliott wave counts.
Classic technical analysis mostly favours the first presented Elliott wave count.
Summary: For the short term, a low may be in place if the teal trend line offers support. A target for the next wave up is either 2,843 or 2,975. Have some confidence in this view if price makes a new high above 2,685.75.
The zigzag wave count is given a closer look today. It is possible that price may move lower to overshoot the teal channel. The target for a low is about 2,591.
Five daily charts today look at five different structures for primary wave 4, in order of probability (roughly): zigzag, triangle, combination, flat and double zigzag.
Primary wave 4 could be over. The alternate wave count outlines this possibility.
New updates to this analysis are in bold.
The biggest picture, Grand Super Cycle analysis, is here.
Last published monthly chart is here, video is here.
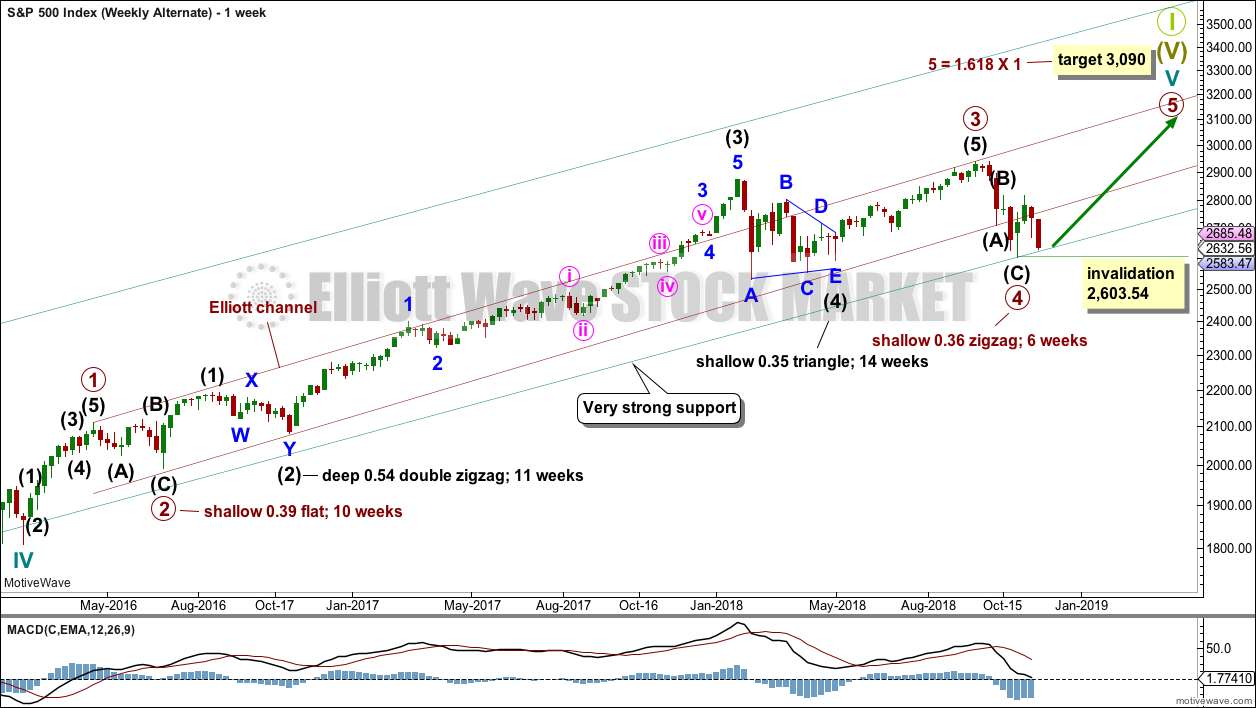
ELLIOTT WAVE COUNT
WEEKLY CHART
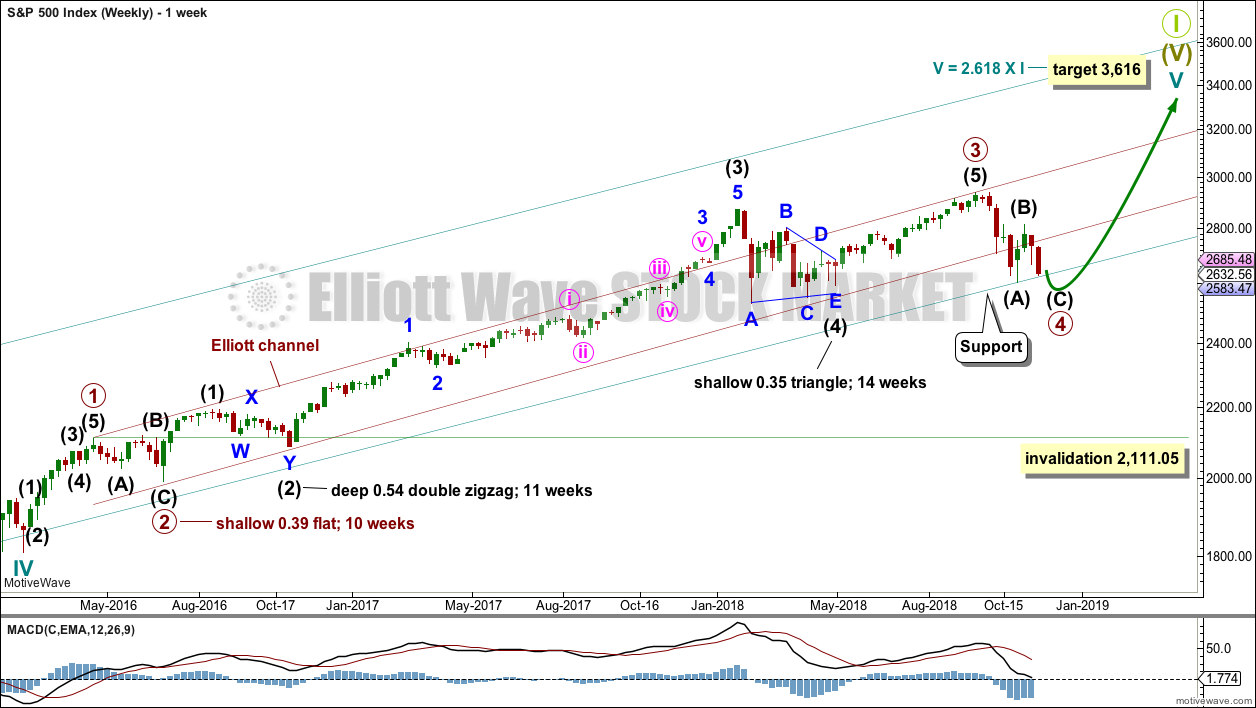
Click chart to enlarge.
Cycle wave V must complete as a five structure, which should look clear at the weekly chart level and also now at the monthly chart level. It may only be an impulse or ending diagonal. It is clear it is an impulse.
Cycle wave V has passed equality in length with cycle wave I, and 1.618 the length of cycle wave I. The next Fibonacci ratio is used to calculate a target. When primary wave 4 is complete and the starting point for primary wave 5 is known, then the final target may also be calculated at primary degree. At that stage, there may be two targets, or the final target may widen to a small zone.
Within cycle wave V, the third waves at all degrees may only subdivide as impulses.
Within primary wave 3, there is perfect alternation and excellent proportion between intermediate waves (2) and (4).
The maroon channel is drawn about primary degree waves. The first trend line is drawn from the ends of primary waves 1 to 3, then a parallel copy is placed upon the low of primary wave 2. The overshoot of the upper edge of this channel by the end of intermediate wave (3) looks typical. For the S&P, its third waves are usually the strongest portion of an impulse; they often exhibit enough strength to overshoot channels.
Primary wave 4 may find very strong support about the lower edge of the teal channel, and it looks like this is from where price bounced on the 29th of October. This channel is copied over from the monthly chart and contains the entire bull market since its beginning in March 2009. While Super Cycle wave (V) is incomplete, this channel should not be breached at the weekly chart level.
Draw the teal channel from the high of cycle wave I at 1,343.80 on the week beginning 3rd July 2011, to the high of cycle wave III at 2,079.46 on the week beginning 30th November 2014, and place a parallel copy on the low of cycle wave II at 1,074.77 on the week beginning 2nd October 2011. Draw this chart on a semi-log scale. Price is right at the lower edge of this channel. This may provide support. A small overshoot, like that seen at the end of cycle wave IV, would be entirely acceptable. If price does move below the channel, then it should reverse reasonably quickly.
Primary wave 4 may not move into primary wave 1 price territory below 2,111.05.
At this stage, the expectation is for the final target to be met in October 2019. If price gets up to this target and either the structure is incomplete or price keeps rising through it, then a new higher target would be calculated.
At this stage, the various possible structures for primary wave 4 will be published as five separate daily charts, presented in order of probability (roughly).
DAILY CHART – ZIGZAG
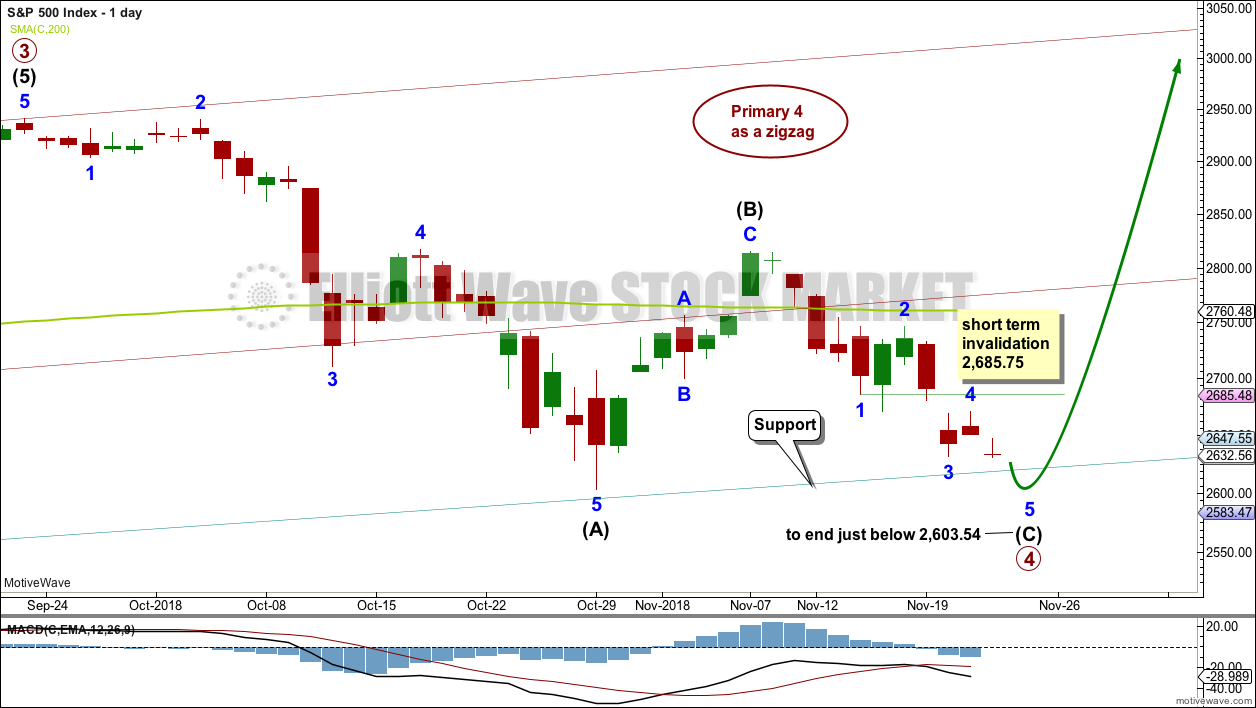
Click chart to enlarge.
Primary wave 4 may be unfolding as a single zigzag, which is the most common type of corrective structure. This would provide perfect alternation with the flat correction of primary wave 2.
Within the zigzag, intermediate wave (B) may be a complete structure, ending close to the 0.618 Fibonacci ratio of intermediate wave (A).
Intermediate wave (C) may now unfold lower as a five wave structure. Intermediate wave (C) would be very likely to end at least slightly below the end of intermediate wave (A) at 2,603.54 to avoid a truncation. It may end about support at 2,600.
Within intermediate wave (C), minor waves 1 through to 4 may be complete. If this labelling is correct, then minor wave 4 may not move into minor wave 1 price territory above 2,685.75. Minor wave 5 may be relatively short and brief; this structure could be complete as quickly as just one more session.
This wave count could expect a reasonably small overshoot of the teal trend channel if the labelling within intermediate wave (C) is correct.
If the lower edge of the teal channel is overshot, then it would most likely be followed by a fairly quick reversal, possibly even intraday. If the bull market remains intact, then it would be most likely that there would not be a full daily candlestick below the trend channel, and very unlikely for a full weekly candlestick to print below the channel.
HOURLY CHART – ZIGZAG
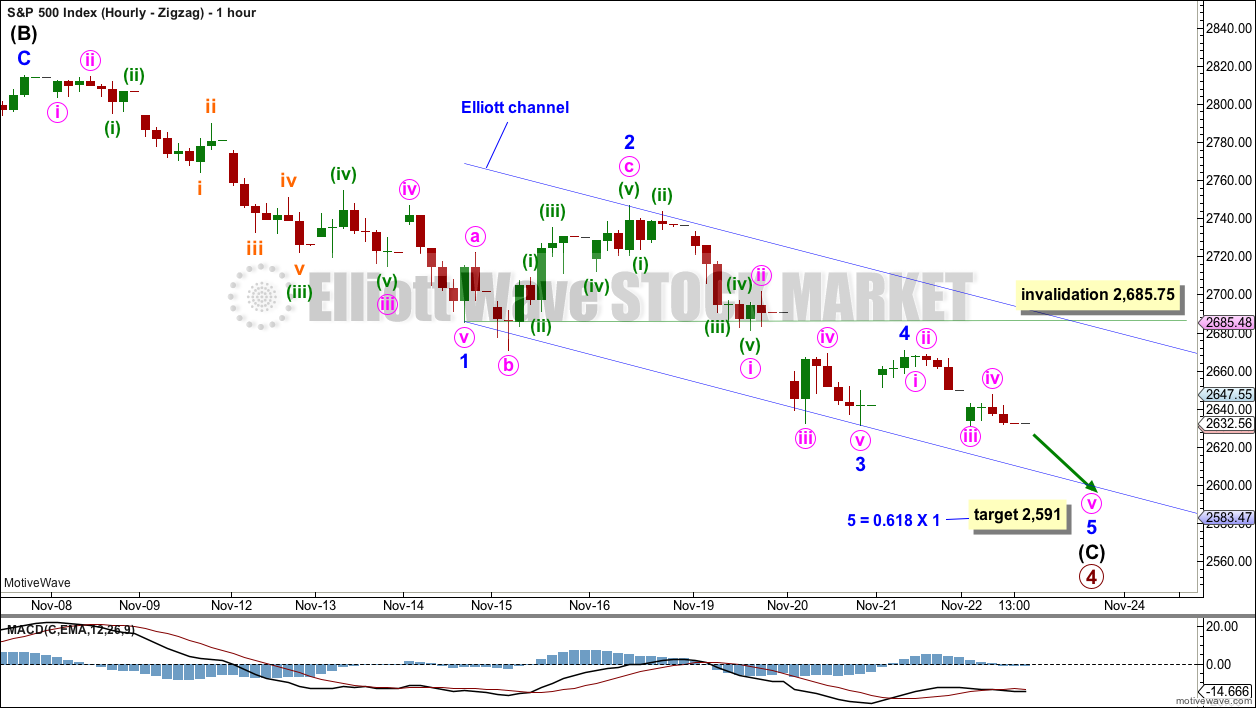
Click chart to enlarge.
Intermediate wave (C) is labelled as an almost complete five wave impulse.
Minor wave 3 is shorter than minor wave 1, and it exhibits no Fibonacci ratio to minor wave 1. This limits minor wave 5 to no longer than equality in length with minor wave 3, so that the core rule stating a third wave may not be the shortest is met. This limit is at 2,555.50.
Because there is no adequate Fibonacci ratio between minor waves 3 and 1, it is more likely that minor wave 5 will exhibit a Fibonacci ratio to either of minor waves 3 or 1. A ratio to minor wave 1 would be most likely.
If the target is wrong, it may be too low. There is very strong support below at the teal trend line, which is seen on the daily and weekly charts.
DAILY CHART – TRIANGLE
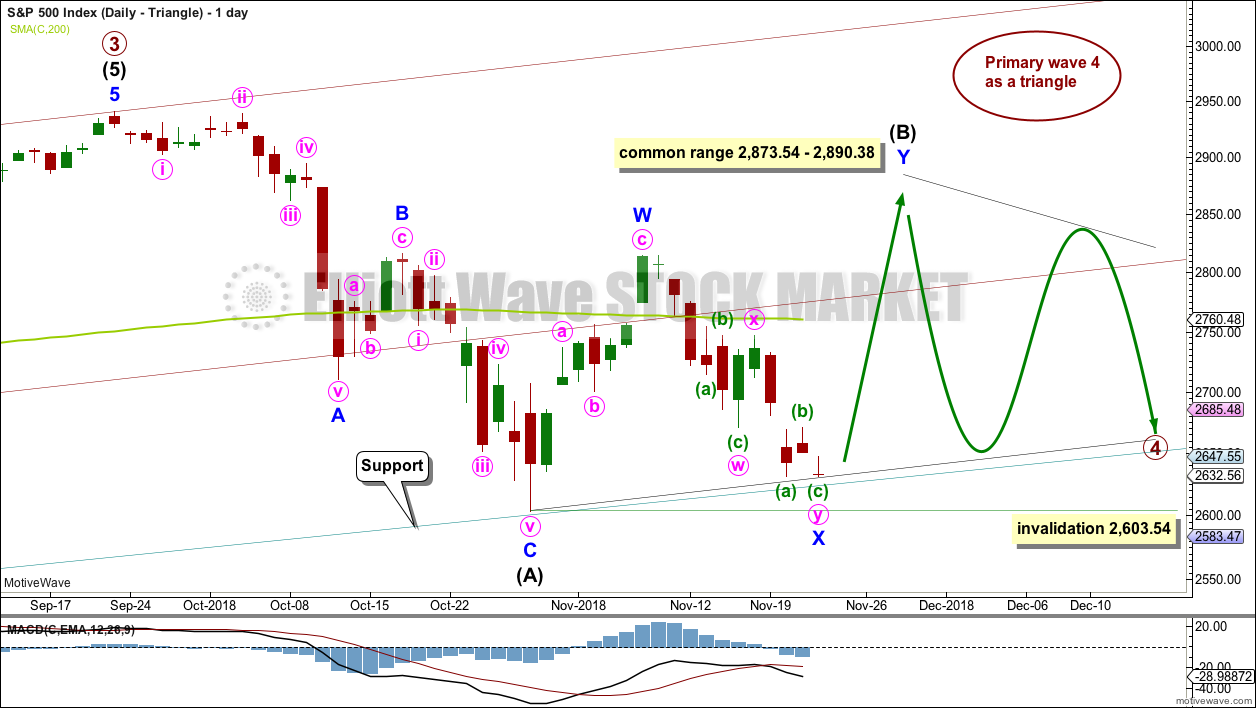
Click chart to enlarge.
If primary wave 4 unfolds as a triangle, it would have perfect alternation with the regular flat correction of primary wave 2. It would also continue to find support about the lower edge of the teal trend channel. Triangles are fairly common structures for fourth waves. However, at this time, the triangle would have lasted nine weeks and would be less than half way complete. This wave count is looking less likely; if primary wave 4 continues to complete a triangle, then it would be much longer in duration than the 10 weeks of primary wave 2.
Price is almost right at the lower edge of the teal trend channel. This may provide enough support to halt the fall in price here.
If primary wave 4 is unfolding as a triangle, then within it intermediate wave (B) would most likely be incomplete. To label intermediate wave (B) over at the last swing high is possible, but it would look too shallow for a normal looking Elliott wave triangle.
Triangle sub-waves are often about 0.8 to 0.85 the length of the prior wave. This gives a target range for intermediate wave (B).
One triangle sub-wave may subdivide as a multiple; this is most often wave C, but it may also be wave B. Intermediate wave (B) may be unfolding higher as a double zigzag.
There is no upper invalidation point for this wave count. Intermediate wave (B) may make a new high above the start of intermediate wave (A) as in a running triangle. Intermediate wave (B) should exhibit clear weakness. If price does make a new high, then for this wave count it should come with weak volume and bearish divergence between price and one or both of RSI or Stochastics.
Within the triangle, intermediate wave (C) may not move beyond the end of intermediate wave (A) below 2,603.54.
HOURLY CHART – TRIANGLE
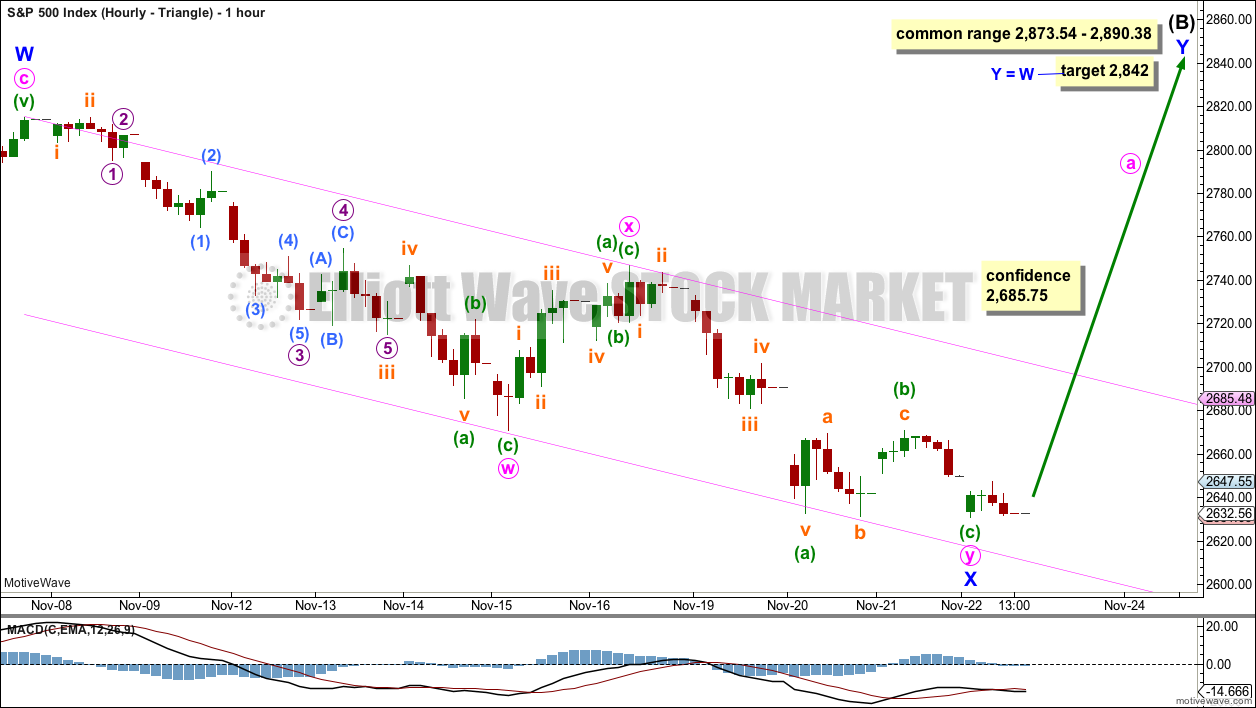
Click chart to enlarge.
Minor wave X may be seen as a complete double zigzag. While waves W, Y and Z within multiples may only themselves subdivide into a single corrective structure, X waves may subdivide into any Elliott wave structure. The Elliott wave rule applicable here is the maximum number of corrective structures within a multiple is three, and this count of three applies to W, Y and Z.
Confidence that a low is most likely in place would come if price breaks above the upper edge of the pink Elliott channel drawn about minor wave X.
The target at 2,842 would see intermediate wave (B) just a little shorter than the most common length for a triangle sub-wave. This would be acceptable.
DAILY CHART – COMBINATION
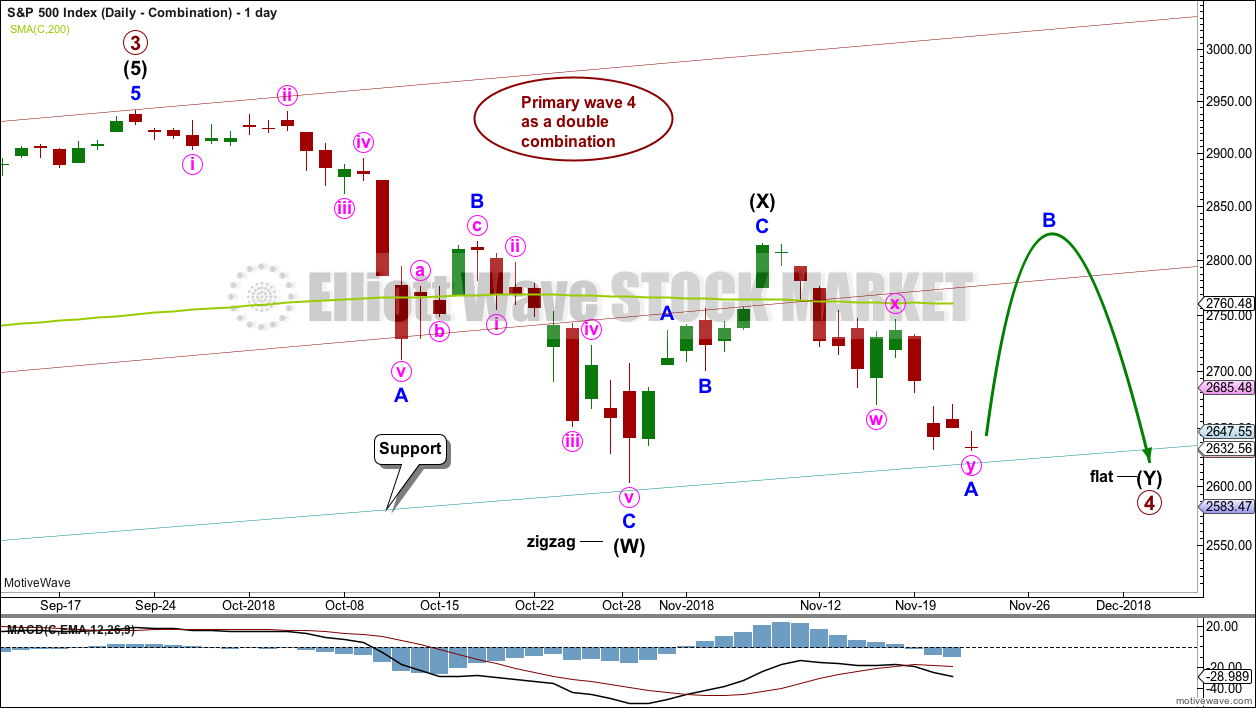
Click chart to enlarge.
This wave count is judged to have only a very slightly lower probability than the triangle.
Primary wave 4 may be unfolding as a double combination. The first structure in the double may be a complete zigzag labelled intermediate wave (W). The double may be joined by a three in the opposite direction labelled intermediate wave (X). Intermediate wave (X) may be complete as a single zigzag; it is deep at 0.63 the length of intermediate wave (W), which looks reasonable.
Intermediate wave (Y) would most likely be a flat correction, which should subdivide 3-3-5. At its end, it may still find strong support about the lower edge of the teal trend channel.
At the hourly chart level, minor wave A may be a complete double zigzag, in exactly the same way as minor wave X on the hourly chart published above.
Within the flat correction of intermediate wave (Y), minor wave B must retrace a minimum 0.9 length of minor wave A at 2,796.74. The common range for minor wave B is from 1 to 1.38 times the length of minor wave A giving a range from 2,815.15 to 2,885.09. Minor wave B may make a new high above the start of minor wave A at 2,815.15 as in an expanded flat.
DAILY CHART – FLAT
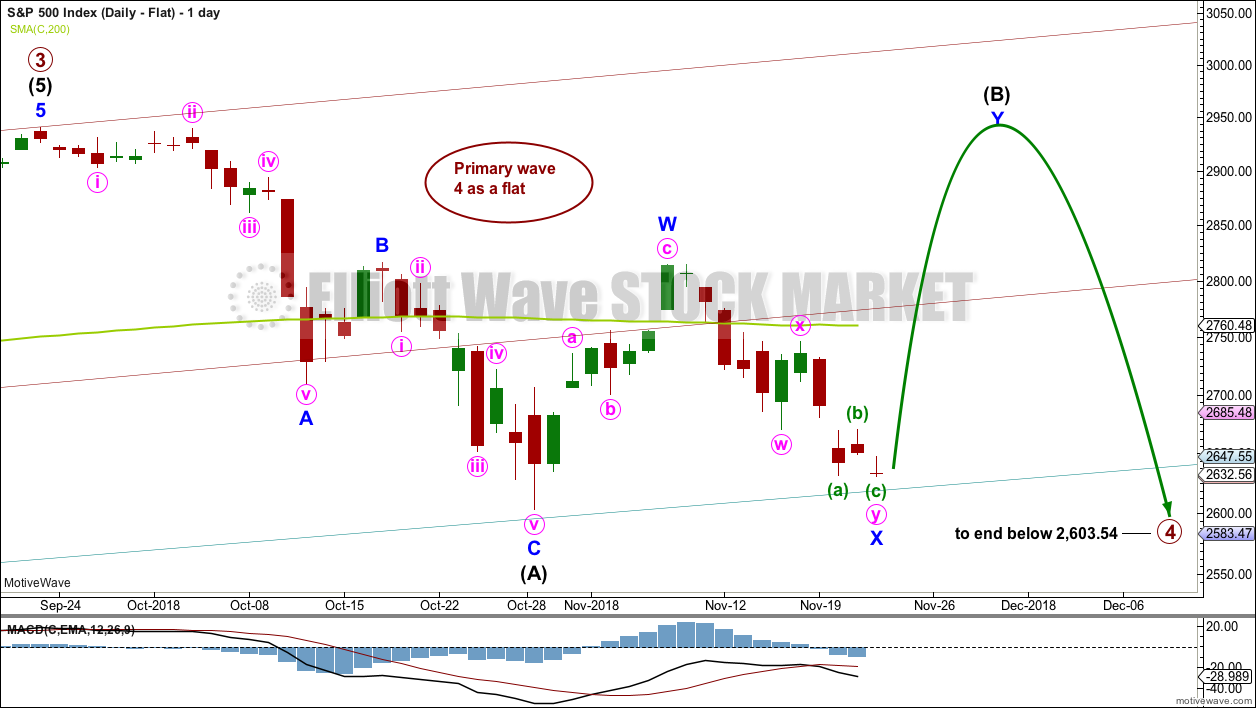
Click chart to enlarge.
Primary wave 2 was a regular flat correction. If primary wave 4 unfolds as a flat correction, then there would be no alternation in structure between the two corrections; for this reason, this wave count is judged to have a low probability.
However, alternation is a guideline, not a rule, and it is not always seen. This wave count is possible.
If primary wave 4 is a flat correction, then within it intermediate wave (B) must move higher to retrace a minimum 0.9 length of intermediate wave (A).
When intermediate wave (B) is complete, then intermediate wave (C) should move below the end of intermediate wave (A) at 2,603.54 to avoid a truncation. This would expect a large overshoot of the teal trend line, which further reduces the probability of this wave count.
DAILY CHART – DOUBLE ZIGZAG
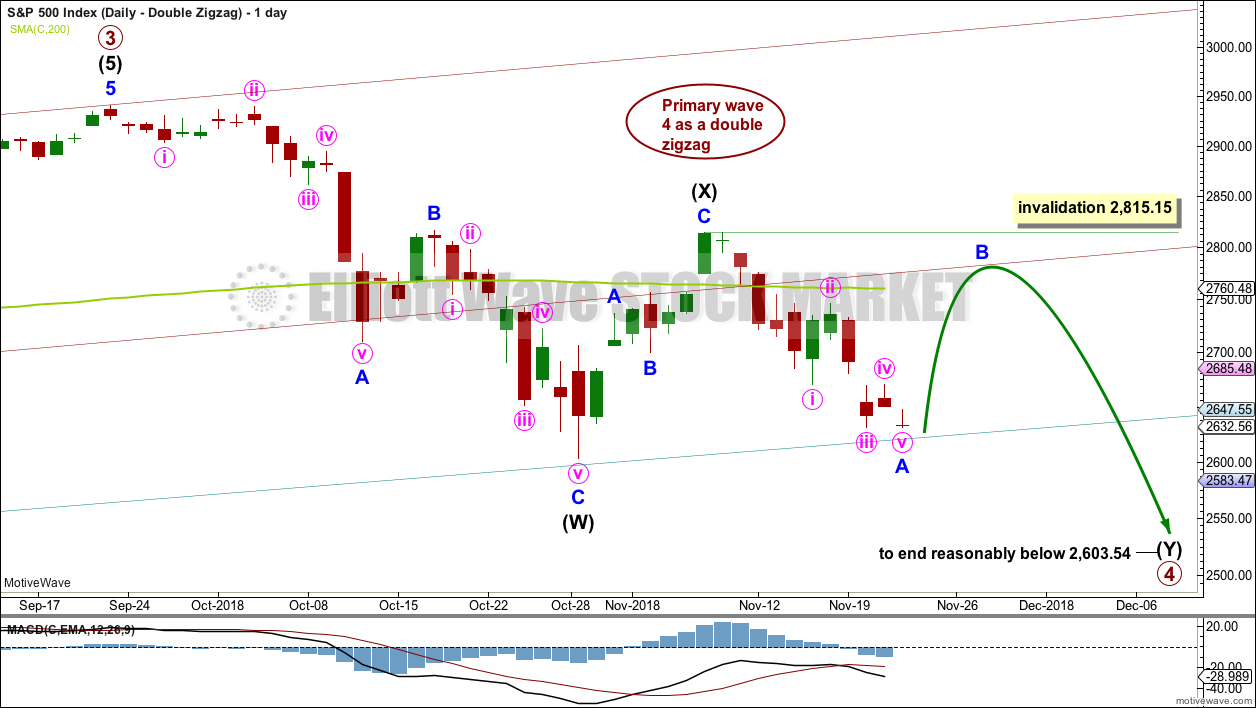
Click chart to enlarge.
Primary wave 4 may also be unfolding as a double zigzag.
The first zigzag in the double may be complete, labelled intermediate wave (W). The double may joined by a complete three in the opposite direction, a zigzag labelled intermediate wave (X).
The second zigzag in the double may have begun. It is labelled intermediate wave (Y). Within intermediate wave (Y), minor wave B may not move beyond the start of minor wave A above 2,815.15.
The purpose of a second zigzag in a double is to deepen the correction when the first zigzag does not move price deep enough. To achieve this purpose intermediate wave (Y) should be expected to end reasonably below the end of intermediate wave (W) at 2,603.54. This would expect a very large overshoot of the teal trend channel; for this reason, this wave count is judged to have the lowest probability.
BULLISH ALTERNATE ELLIOTT WAVE COUNT
WEEKLY CHART
Click chart to enlarge.
It is possible that primary wave 4 could be over as a relatively quick zigzag, ending about support at the lower edge of the teal channel.
The proportion between primary waves 2 and 4 is reasonable. Flat corrections tend to be longer lasting structures than zigzags. There would be perfect alternation in structure and inadequate alternation in depth. This is acceptable.
This wave count has the right look at the monthly chart level.
If primary wave 5 ends at or after the end of December 2018 and the AD line fails to make new all time highs, there would then be the minimum required four months of bearish divergence between price and the AD line. If this happens, then the conditions for the end of this bull market would be in place.
A new target is calculated for primary wave 5 to end. If primary wave 5 were to be only equal in length with primary wave 1, then it would be truncated. A truncated primary wave 5 would be unlikely as then there could be no bearish divergence with the AD line. The next Fibonacci ratio in the sequence is used to calculate a target for primary wave 5.
Within primary wave 5, no second wave correction may move beyond the start of its first wave below 2,603.54.
DAILY CHART
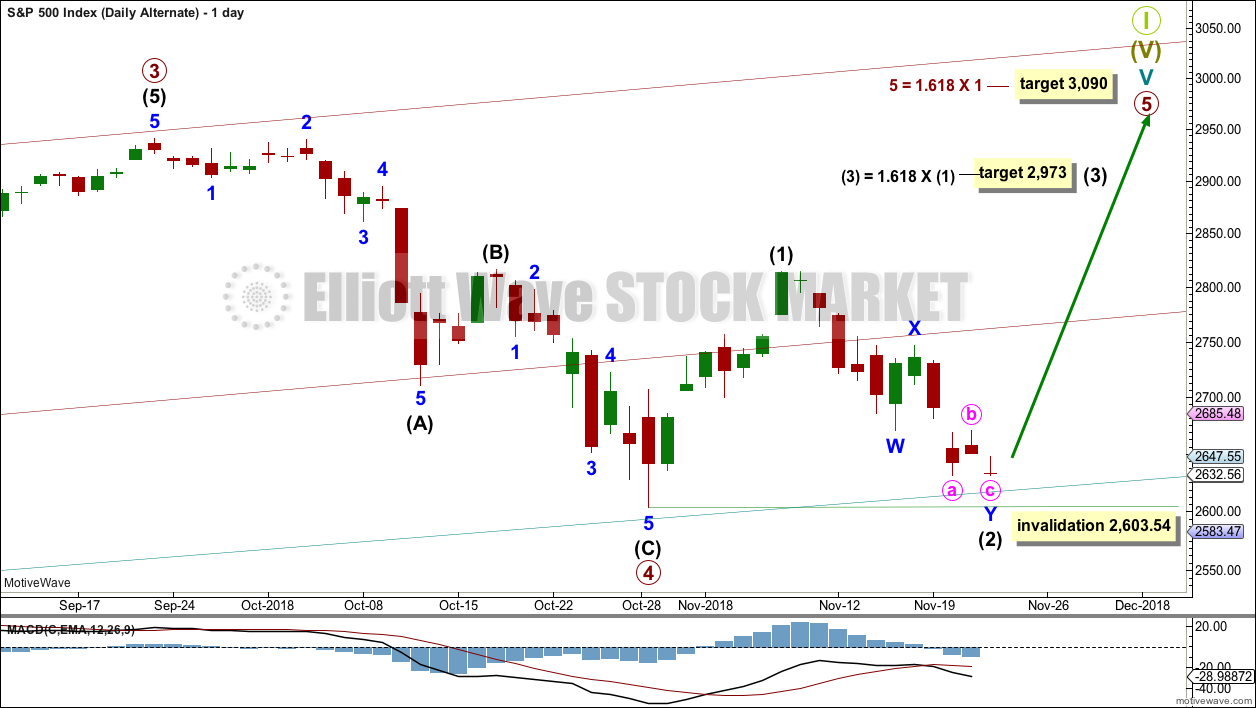
Click chart to enlarge.
The subdivisions of primary wave 4 are seen in exactly the same way as most of the charts above except the degree of labelling is just moved up one degree.
Within primary wave 5, intermediate wave (1) may be over. Intermediate wave (2) may not move beyond the start of intermediate wave (1) below 2,603.54. Intermediate wave (2) may have ended at support at the lower edge of the teal trend channel.
Primary wave 5 may subdivide either as an impulse (more likely) or an ending diagonal (less likely). Intermediate wave (1) may be seen as either a five wave impulse or a three wave zigzag at lower time frames, and so at this stage primary wave 5 could be either an impulse or a diagonal.
Primary wave 5 at its end may be expected to exhibit reasonable weakness. At its end, it should exhibit a minimum of 4 months bearish divergence with the AD line, it may exhibit bearish divergence between price and RSI and Stochastics, and it may lack support from volume; it may not be possible to distinguish a weak fifth wave from a B wave.
TECHNICAL ANALYSIS
WEEKLY CHART
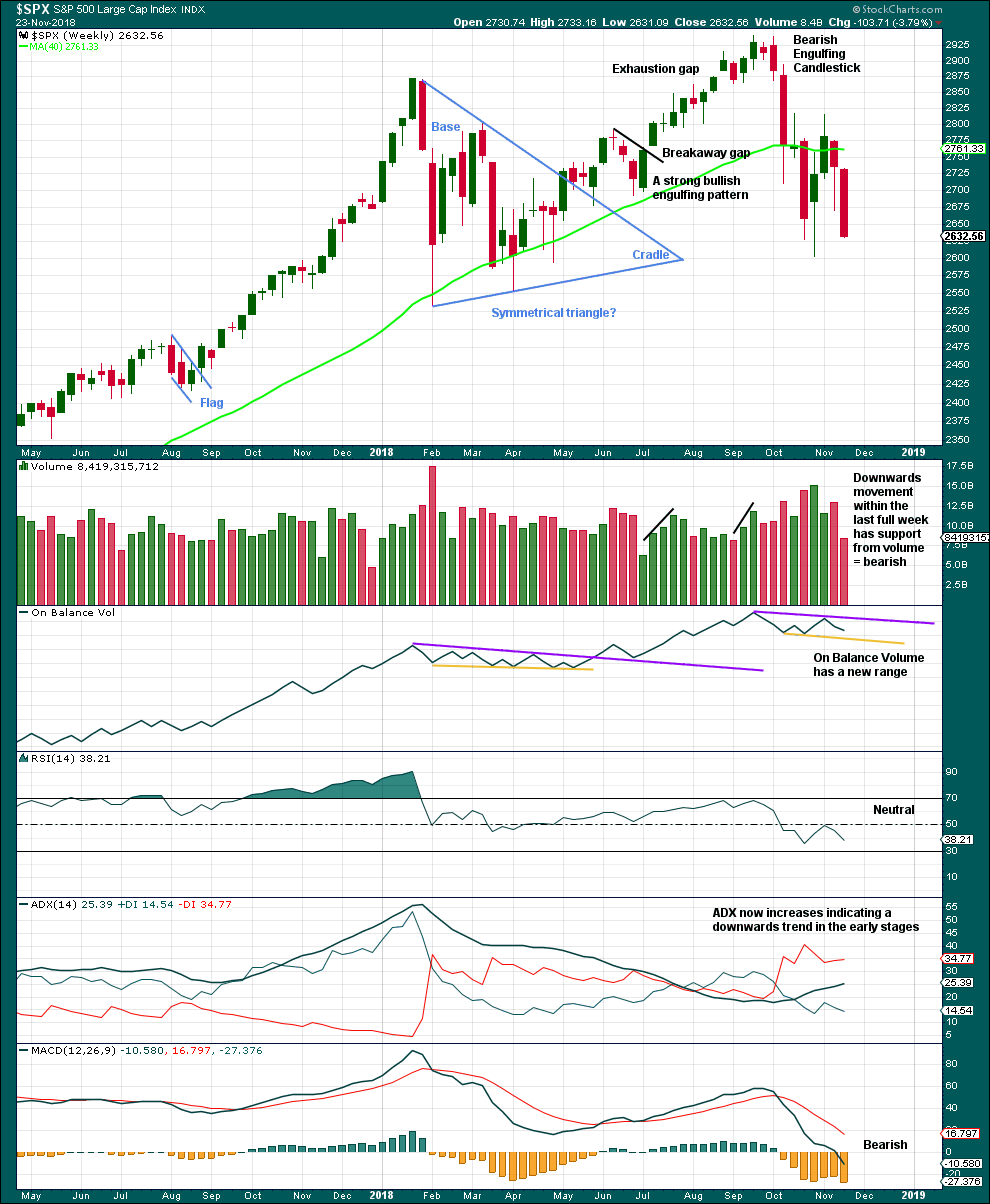
Click chart to enlarge. Chart courtesy of et=”_blank”>StockCharts.com.
With price closing almost at the low for the week, it looks like next week may move price lower.
Although volume is lighter this week, it was not a full trading week. No conclusion here about this week’s volume shall be drawn.
DAILY CHART
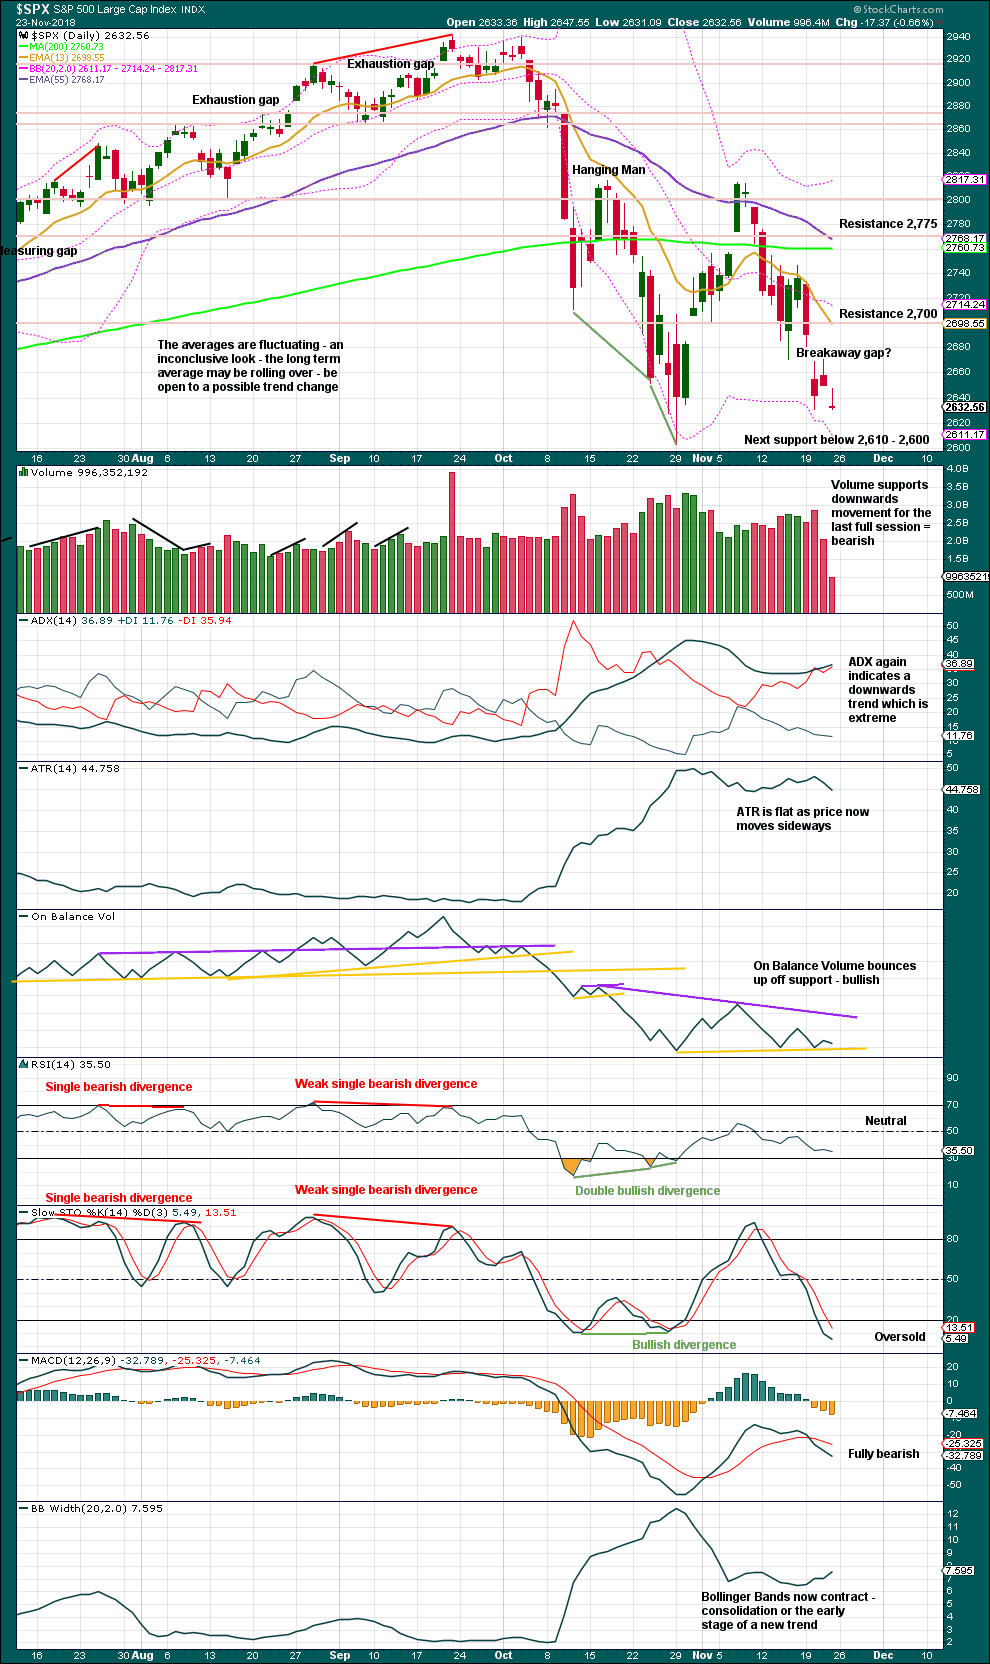
Click chart to enlarge. Chart courtesy of StockCharts.com.
The lower edge of the teal trend channel is not shown on this chart, but it should be considered as part of this technical analysis. Expect that trend line to continue to provide support, until it does not.
The last gap may be either a pattern or breakaway gap. It remains open, which is bearish, but price remains range bound. If price does move lower, then look for strong support about 2,610 – 2,600.
For the short term, Friday’s candlestick is a Gravestone doji; but it does not come at the end of an upwards movement, so it is not a bearish reversal signal.
If price does make a new low below the prior swing low of the 29th of October, then close attention should be paid to RSI. If it makes a corresponding new low, that would be bearish. But if RSI does not make a corresponding new low, then there would be further bullish divergence.
BREADTH – AD LINE
WEEKLY CHART
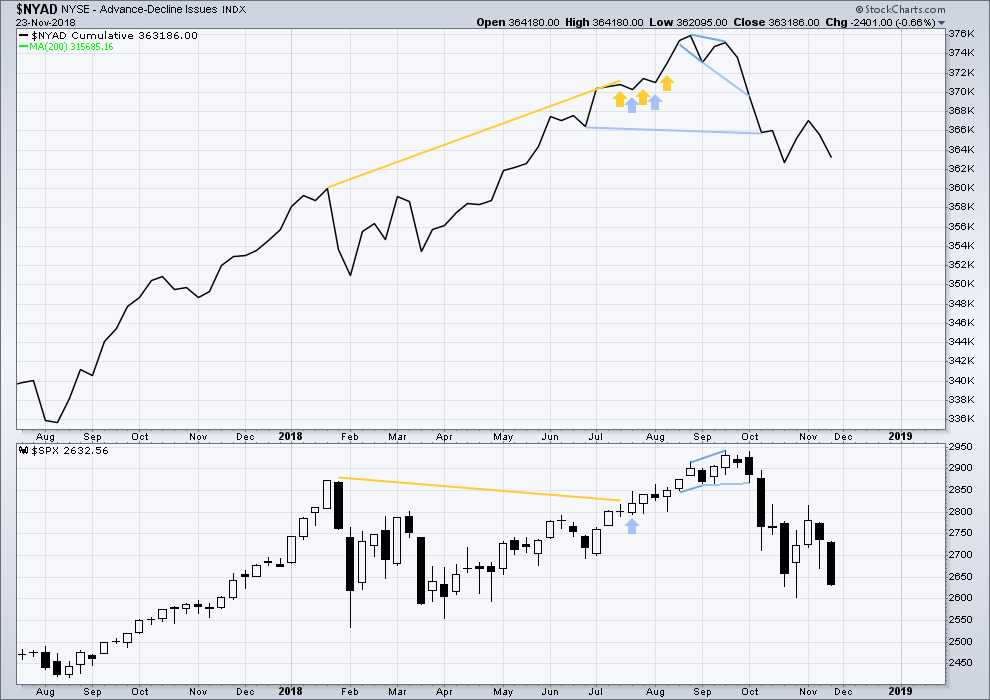
Click chart to enlarge. Chart courtesy of StockCharts.com. So that colour blind members are included, bearish signals
will be noted with blue and bullish signals with yellow.
This week both price and the AD line have moved lower. There is no short-term divergence at this time frame.
DAILY CHART
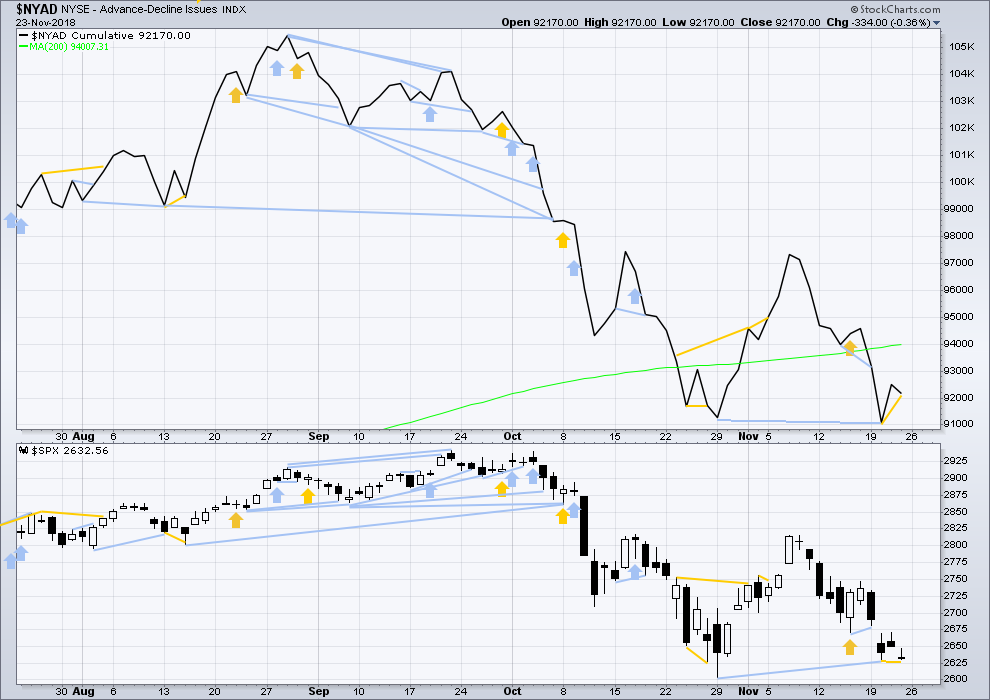
Click chart to enlarge. Chart courtesy of StockCharts.com. So that colour blind members are included, bearish signals
will be noted with blue and bullish signals with yellow.
There is normally 4-6 months divergence between price and market breadth prior to a full fledged bear market. This has been so for all major bear markets within the last 90 odd years. With no longer-term divergence yet at this point, any decline in price should be expected to be a pullback within an ongoing bull market and not necessarily the start of a bear market. New all time highs from the AD line on the 29th of August means that the beginning of any bear market may be at the end of December 2018, but it may of course be a lot longer than that. My next expectation for the end of this bull market may now be October 2019.
Breadth should be read as a leading indicator.
Price has made a slight new low below the low two sessions prior, but the AD line has not. Downwards movement lacks support from falling market breadth. This divergence is bullish.
VOLATILITY – INVERTED VIX CHART
WEEKLY CHART
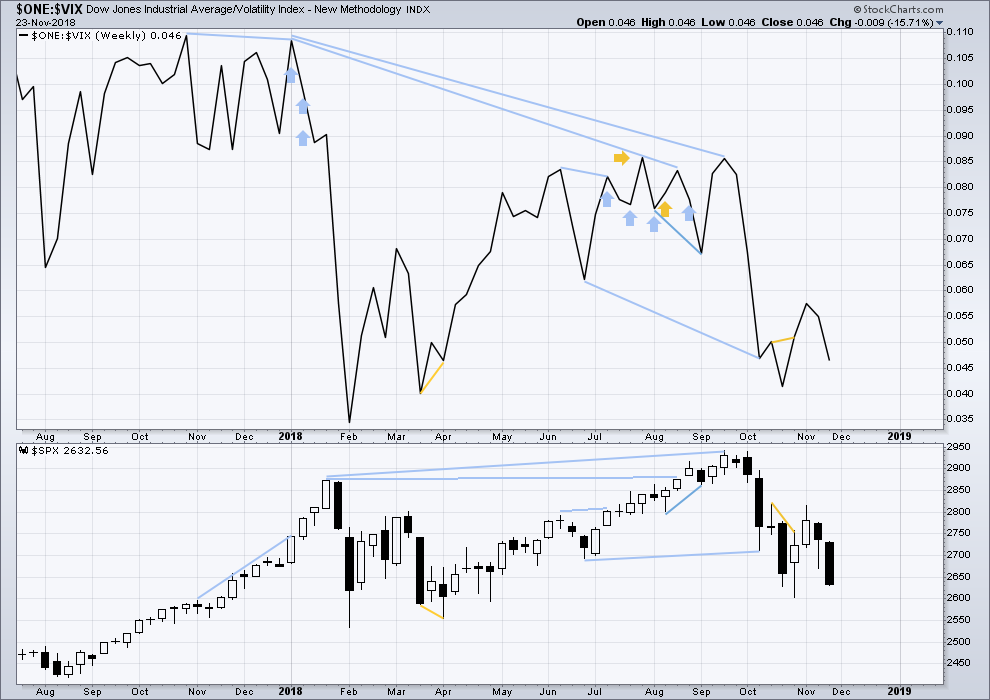
Click chart to enlarge. Chart courtesy of StockCharts.com. So that colour blind members are included, bearish signals
will be noted with blue and bullish signals with yellow.
This week both price and inverted VIX have moved lower. There is no new short-term divergence at this time frame.
DAILY CHART
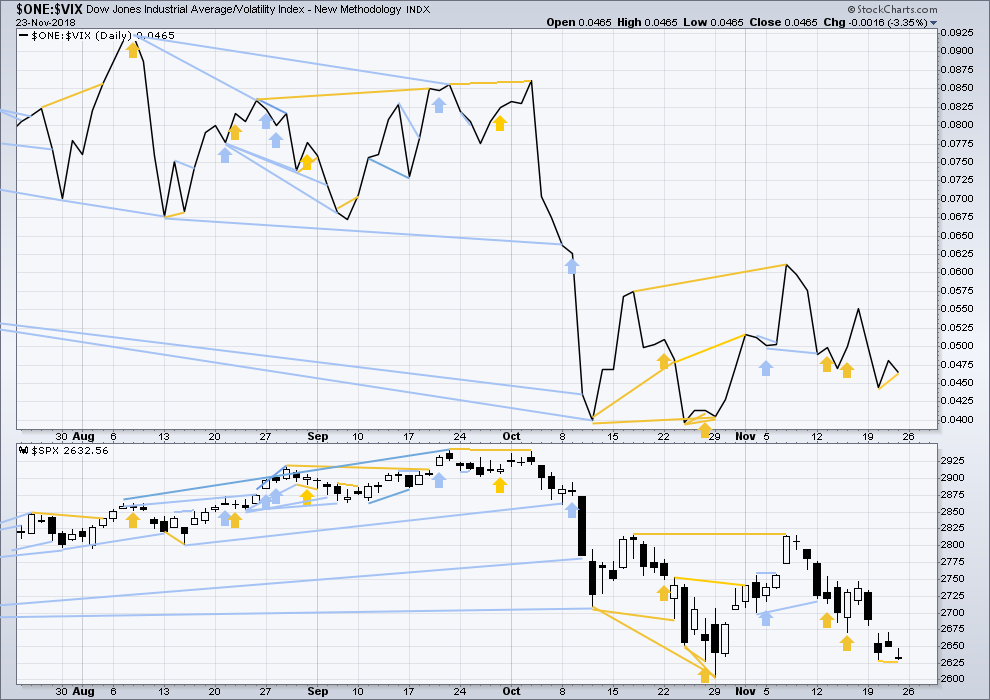
Click chart to enlarge. Chart courtesy of StockCharts.com. So that colour blind members are included, bearish signals
will be noted with blue and bullish signals with yellow.
Normally, volatility should decline as price moves higher and increase as price moves lower. This means that normally inverted VIX should move in the same direction as price.
Price on Friday has made a slight new low below the low two sessions prior, but inverted VIX has not. This short-term divergence is bullish.
DOW THEORY
The following lows need to be exceeded for Dow Theory to confirm the end of the bull market and a change to a bear market:
DJIA: 23,344.52.
DJT: 9,806.79.
S&P500: 2,532.69.
Nasdaq: 6,630.67.
Published @ 11:49 p.m. EST.
—
Careful risk management protects your trading account(s).
Follow my two Golden Rules:
1. Always trade with stops.
2. Risk only 1-5% of equity on any one trade.
I am considering discarding all but one daily chart which sees primary wave 4 continuing, and possibly even favouring the alternate which sees it as already over.
Lets see how this session closes. I’ll make that decision after I’ve gone through the process of looking at all the data.
Anyway, updated hourly chart for the zigzag count.
Minor 4 remains below minor 1 price territory, this count remains valid.
However, on the daily chart there is now a very nice Morning Doji Star. Price is again bouncing up off the teal trend channel.
This is very bullish folks. Assume that support will continue at that teal trend line, until it doesn’t. That is a safe and logical approach to this analysis.
If support continues there, then primary wave 4 would likely be over now.
This count has a good probability.
Thanks Lara. I hope you are having a good day.
For those interested, here is a good link to a presentation about Morning Doji Stars. good reading I think.
http://www.thepatternsite.com/MorningDojiStar.html
Thanks Lara.
Seems like they are also smashing VIX today, depends on how it closes, then high probability of melt up with low VIX in wave 3 of the P5…
TLT again, at the hourly TF. The up sloping lines are symmetric projections of prior up (counter-trend) moves at the daily TF (I showed the daily chart last week). I’m long..but also short with a much longer option expiry. Price got close to the first significant fibo (38.2%) at 115.9. Now I’ve put in the symmetric projections of the down (counter trend at this tf) moves during this up move. I want this current down move to not become the largest…or else maybe the daily TF up move is over! What will seal that deal for me would be then a further break of the prior swing low (marked with a horizontal line). If on the other hand this multi-hour down move holds here, and then the 38.2% breaks, I might get even longer with shorter term options. The basic simple tools of how I extract $ while managing risk. Sometimes it even works…
Lara, if you can comment on the possibility that the P4 completed as a zig-zag with a very small (but legitimate re: new low establish) minute 5, I’d appreciate it. TIA!
Ummmm… I’m not quite sure what you’re asking here? Do you mean that P4 could have ended at the low for 23rd November?
That would see intermediate (C) truncated by 27.55 points. That truncation is too large for me to consider it seriously. When the S&P does do truncations they are unusual, and not by very much.
The alternate wave count though fits your description. P4 could have been over on 29th October.
Exactly the assessment I was looking for, thanks!
Sell trigger with VIX move above 20.08
The next decline will be the most violent. It should dispel much of the intransigent bullishness remaining in the market, issue in a true VIX capitulation spike, and finally give us a tradeable bottom. Best of luck to traders!
Can you inform us which of the current still valid counts supports your thesis of a strong violent down move as “the next decline”? That could mean tomorrow, or it could mean in a week or two (ala the flat model). I appreciate the alarm in advance, but without more info, I have trouble re: modeling what you are talking about.
We’ve got polarity inversion now on the hourly. Next buy triggers I’m looking for are a shift to a strong up trend at the hourly, and a break of the downtrend line as Rodney suggests is critical. The zig zag model is either blown away…or maybe the tiny minute 5 completed it, and the entire P4 is complete? I don’t see any model that supports a thesis of a strong violent down move coming quickly here, so are you suggesting something like the flat model? Thanks for any clarification.
I think a big ZZ down is still unfolding.
Looks like a reversal underway with a shooting star on the indices and a hammer in VIX. We still need a break of VIX 20.08 for confirmation.
I counted five down off this morning’s high and a deep second wave ZZ up so far for DJIA and an expanded flat for SPX…
Like Verne, I am suspicious of this move up today. I suspect we may still go below 2600. I would not be surprised if the high for today completed Minor 4 on Lara’s daily Zig-Zig wave pattern. Minor 3 would need to be moved. But I do not see that as an issue. I will not be convinced the bottom is in until we have a clear break of the upper channel line on the hourly Zig-Zag chart. That line is about 2680 as of today.
&Out of remaining calls.
Volatility flashing red.
We wouldn’t want to over- stay our welcome now, would we? 😉
I really miss you Olga!! 🙂
Selling another 1/4 263 calls.
Looks like possible bull flag but need to see new high to confirm.
The two bottom’s we’ve seen in this P4 just “happen” to be off the long term trend line formed by the two deepest (A and C wave) bottoms of the intermediate 4. (This is a daily bar chart).
My confidence that SPX price is headed back to the upper purple volatility range band (I use a combination of BB’s and Keltner’s for that) is high here.
How are you trading it?
Every which way but loose!!!
I have long calls with long expiries (Jan and Mar), in IWM/QQQ/SPY. I hate the skew right now on bull put spreads, it seems like highway robbery. Only $38 credit on a $100 wide bull put spread in SPY. But I still bought one, just to have such a play in my mix. Do you find such a credit “price” acceptable, and if not, what do you look to as an alternative? I tend to buy ITM money calls with fairly long expiry to reduce my premium decay, and “trade” those with the major hourly TF swings rather than hold for long, to escape premium decay cost. I also really like to sell puts under the recent lows when the instrument is still in a monthly up trend, and it’s turned off a good fibo level. Big caps only: I’ve got UNH, GS, MA, LYB, and JPM right now, all with mid Dec expiries. I love premium decay when I’m a seller!!!
ps: on the SPX hourly there is 1/2 of a polarity inversion in place, a higher high. Waiting for the higher low to form, and then some up movement. Additionally I’m looking for the hourly tf trend line to be busted. And my trend indicator at this TF to go green. All of those together will largely confirm (to me) my outlook, and as they occur I will be getting substantially longer. I’d like a little more short term proof that my daily level outlook is reasonably on target!
The higher swing low should be coming very soon here. 5 minute chart…
Lousy spreads generally means they don’t want you making the trade, OR low liquidity which is not the case for those ETFs. With the trend being what it is they should be happy to sell you put credit spreads… 🙂
Last week, Tuesday through Friday, gave us another McClellan Oscillator buy signal. If today closes strongly in the green, we will also get the confirmation of the buy signal.
The question for me is, “Which of the five EW counts is the final one?” All counts still remain valid, from on-going triangle to completed zig-zag. Lara will guide us.
One note from Lara’s video: The Zig-Zag is by far the most common correction pattern.
These are counter-trend rallies.
The big final move down is still ahead.
Resumption of the bull trend imho requires significantly more fear than we have so far seen…
Selling half 263 strike calls…thank you! 🙂
ps. Now two gaps are important.
A fill of this morning’s gap, and a gap higher off VIX lows….
I’m going to possibly switch to my alternate wave count as the new main, which would be counter to your view here.
Primary 4 could have been over as a relatively quick zigzag. We could see new all time highs early next year.
Of course anything is possible. It would however be a most atypicacl conclusion to a primary degree market correction. Perhaps Mr. Market will fool everyone by doing the unexpected. We should have our answer soon enough.
Verne was absolutely spot on with the today’s overnight ramp…
Now is it for real ie gonna last for next few days / weeks?? Seems to me that way.
I got the cheaper 263 strikes.
If anyone made the trade merry early Xmas! 🙂
We should tag the 2700 pivot.
As counter-intuitive as it may appear, stocks are up more days than down, even in a bear market. This is possible in a down-trend of course becsuse stocks tend to fall much faster than rise, even if less often. A few months back I posted on the spectacular gains that can be made trading bear-market (or deep corrections) counter-trend rallies, typically “C” waves. We have already see quite a few, and catching them has paid almost as well as short trades have, and in some cases more, as they offered better set-ups.
Here is a trading tid-bit.
You can get a good idea of what traders are expecting regarding counter-trend rallies by looking at open interest on near term call options.
Right now, looking at SPY Nov. 30 260 strike calls, it does appear that quite a few of them expect price to be higher next Friday. At around a 5.00 ask, I expect them to get a bit cheaper, and of course would want to see clear signs of a reversal, but they may be onto something! 😉
Have a wonderful week-end and great trading week. You too Joseph! 🙂
2nd…..
grrrr!