
A little more downwards movement was expected for Tuesday’s session although the target at 2,667 was inadequate.
Summary: For the short term, a low may be in place today if the teal trend line offers support. A target for the next wave up is either 2,843 or 2,975.
Five daily charts today look at five different structures for primary wave 4, in order of probability (roughly): triangle, combination, zigzag, double zigzag, and flat.
Primary wave 4 could be over. The alternate wave count outlines this possibility.
New updates to this analysis are in bold.
The biggest picture, Grand Super Cycle analysis, is here.
Last published monthly chart is here, video is here.
ELLIOTT WAVE COUNT
WEEKLY CHART
Click chart to enlarge.
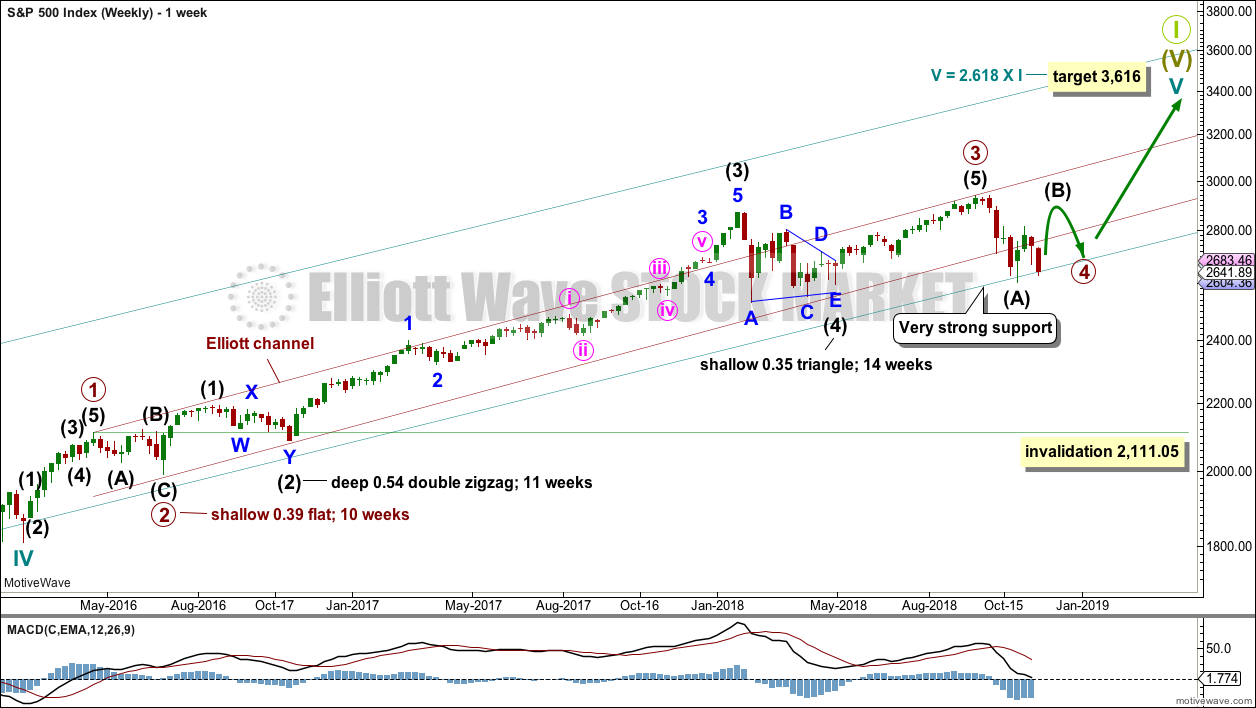
Cycle wave V must complete as a five structure, which should look clear at the weekly chart level and also now at the monthly chart level. It may only be an impulse or ending diagonal. It is clear it is an impulse.
Cycle wave V has passed equality in length with cycle wave I, and 1.618 the length of cycle wave I. The next Fibonacci ratio is used to calculate a target. When primary wave 4 is complete and the starting point for primary wave 5 is known, then the final target may also be calculated at primary degree. At that stage, there may be two targets, or the final target may widen to a small zone.
Within cycle wave V, the third waves at all degrees may only subdivide as impulses.
Within primary wave 3, there is perfect alternation and excellent proportion between intermediate waves (2) and (4).
The maroon channel is drawn about primary degree waves. The first trend line is drawn from the ends of primary waves 1 to 3, then a parallel copy is placed upon the low of primary wave 2. The overshoot of the upper edge of this channel by the end of intermediate wave (3) looks typical. For the S&P, its tghird waves are usually the strongest portion of an impulse; they often exhibit enough strength to overshoot channels.
Primary wave 4 now has an overshoot on the lower edge of the channel. This is acceptable; fourth waves are not always neatly contained within channels drawn using this technique.
Primary wave 4 may find very strong support about the lower edge of the teal channel, and it looks like this is from where price bounced on the 29th of October. This channel is copied over from the monthly chart and contains the entire bull market since its beginning in March 2009. While Super Cycle wave (V) is incomplete, this channel should not be breached at the weekly chart level.
Primary wave 4 may not move into primary wave 1 price territory below 2,111.05.
At this stage, the expectation is for the final target to be met in October 2019. If price gets up to this target and either the structure is incomplete or price keeps rising through it, then a new higher target would be calculated.
At this stage, the various possible structures for primary wave 4 will be published as separate daily charts, presented in order of probability.
DAILY CHART – TRIANGLE
Click chart to enlarge.
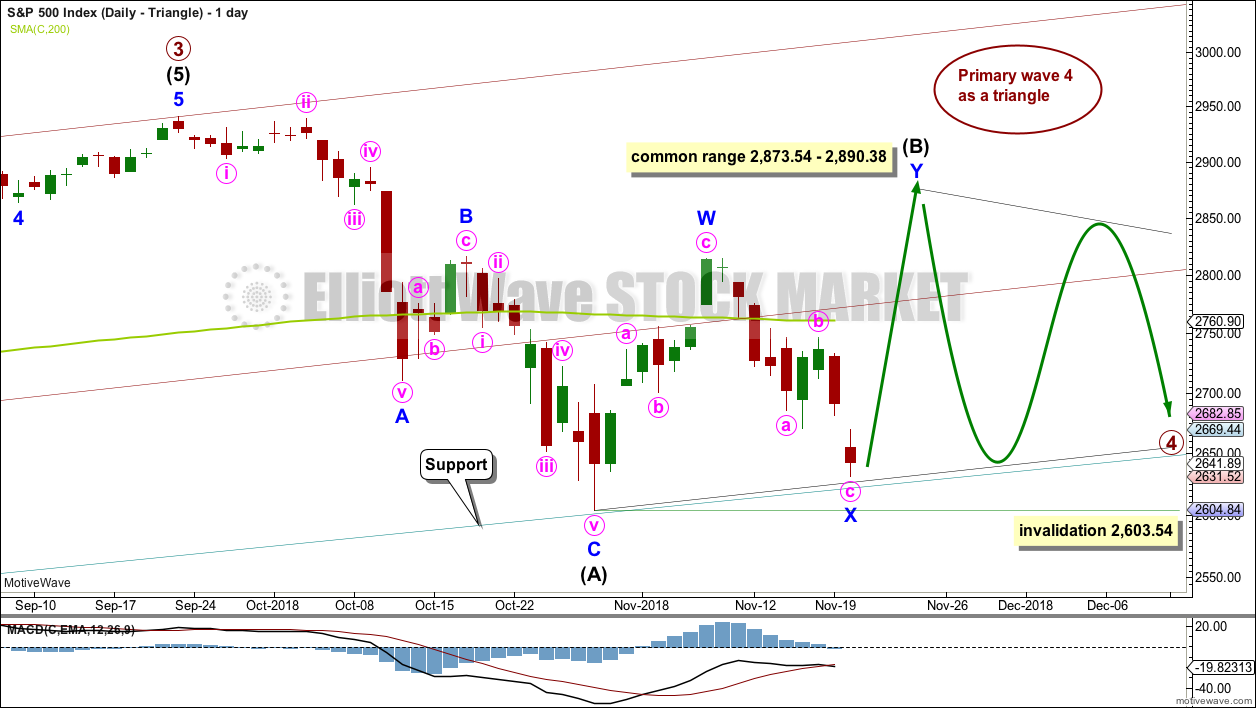
If primary wave 4 unfolds as a triangle, it would have perfect alternation with the regular flat correction of primary wave 2. It would also continue to find support about the lower edge of the teal trend channel. Triangles are fairly common structures for fourth waves. For these reasons this wave count may have a slightly higher probability than the other daily charts.
Today price is almost right at the lower edge of the teal trend channel. This may provide enough support to halt the fall in price here.
If primary wave 4 is unfolding as a triangle, then within it intermediate wave (B) would most likely be incomplete. To label intermediate wave (B) over at the last swing high is possible, but it would look too shallow for a normal looking Elliott wave triangle.
Triangle sub-waves are often about 0.8 to 0.85 the length of the prior wave. This gives a target range for intermediate wave (B).
One triangle sub-wave may subdivide as a multiple; this is most often wave C, but it may also be wave B. Intermediate wave (B) may be unfolding higher as a double zigzag.
There is no upper invalidation point for this wave count. Intermediate wave (B) may make a new high above the start of intermediate wave (A) as in a running triangle. Intermediate wave (B) should exhibit clear weakness. If price does make a new high, then for this wave count it should come with weak volume and bearish divergence between price and one or both of RSI or Stochastics.
Within the triangle, intermediate wave (C) may not move beyond the end of intermediate wave (A) below 2,603.54.
HOURLY CHART – TRIANGLE
Click chart to enlarge.
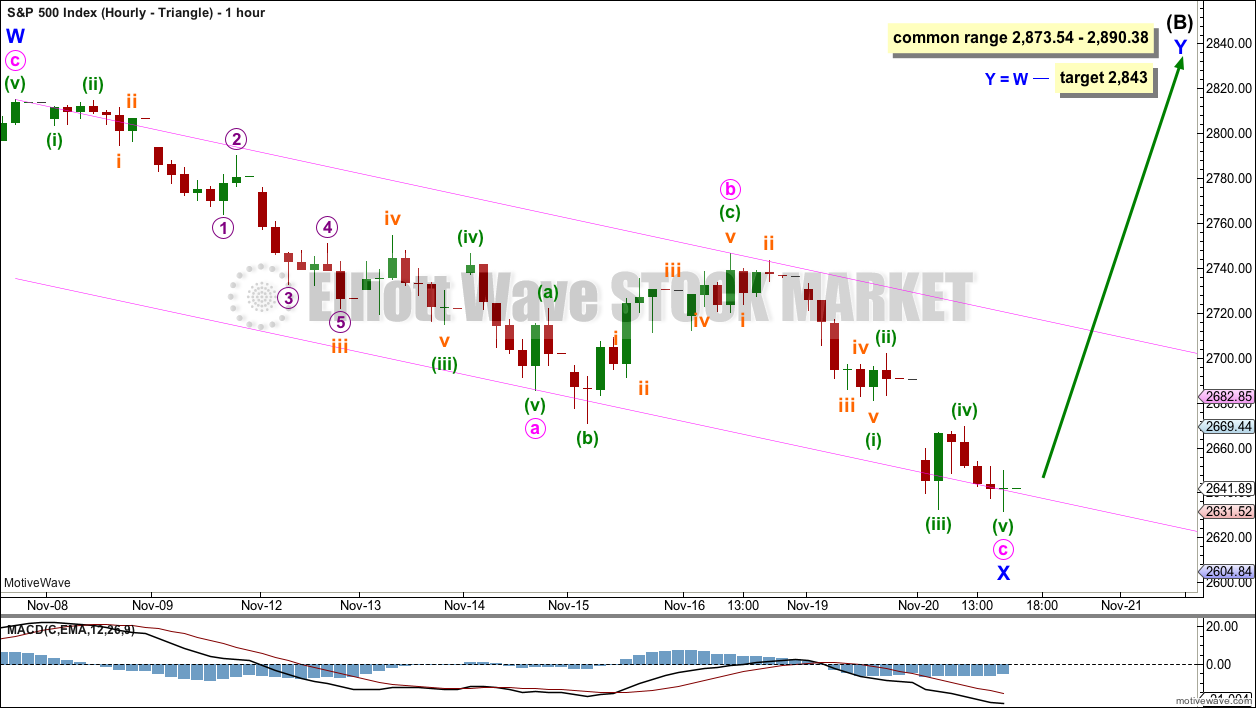
Minor wave X may again be seen as a complete zigzag. Minute wave c may now be a complete five wave impulse.
Confidence that a low is most likely in place would come if price breaks above the upper edge of the pink Elliott channel drawn about minor wave X.
The target at 2,843 would see intermediate wave (B) just a little shorter than the most common length for a triangle sub-wave. This would be acceptable.
DAILY CHART – COMBINATION
Click chart to enlarge.
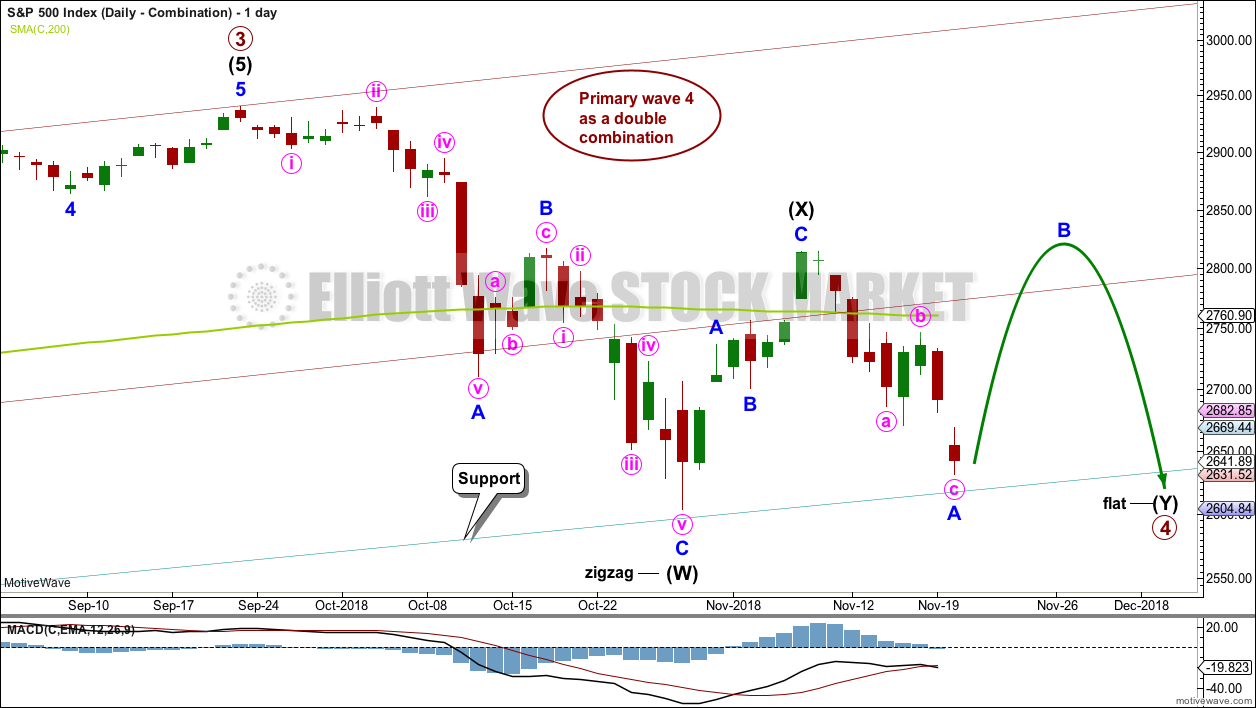
This wave count is judged to have only a very slightly lower probability than the triangle.
Primary wave 4 may be unfolding as a double combination. The first structure in the double may be a complete zigzag labelled intermediate wave (W). The double may be joined by a three in the opposite direction labelled intermediate wave (X). Intermediate wave (X) may be complete as a single zigzag; it is deep at 0.63 the length of intermediate wave (W), which looks reasonable.
Intermediate wave (Y) would most likely be a flat correction, which should subdivide 3-3-5. At its end, it may still find strong support about the lower edge of the teal trend channel.
At the hourly chart level, minor wave A may be a complete zigzag, in exactly the same way as minor wave X on the hourly chart published above.
Within the flat correction of intermediate wave (Y), minor wave B must retrace a minimum 0.9 length of minor wave A at 2,797.08. The common range for minor wave B is from 1 to 1.38 times the length of minor wave A giving a range from 2,815.15 to 2,884.93. Minor wave B may make a new high above the start of minor wave A at 2,815.15 as in an expanded flat.
DAILY CHART – ZIGZAG
Click chart to enlarge.
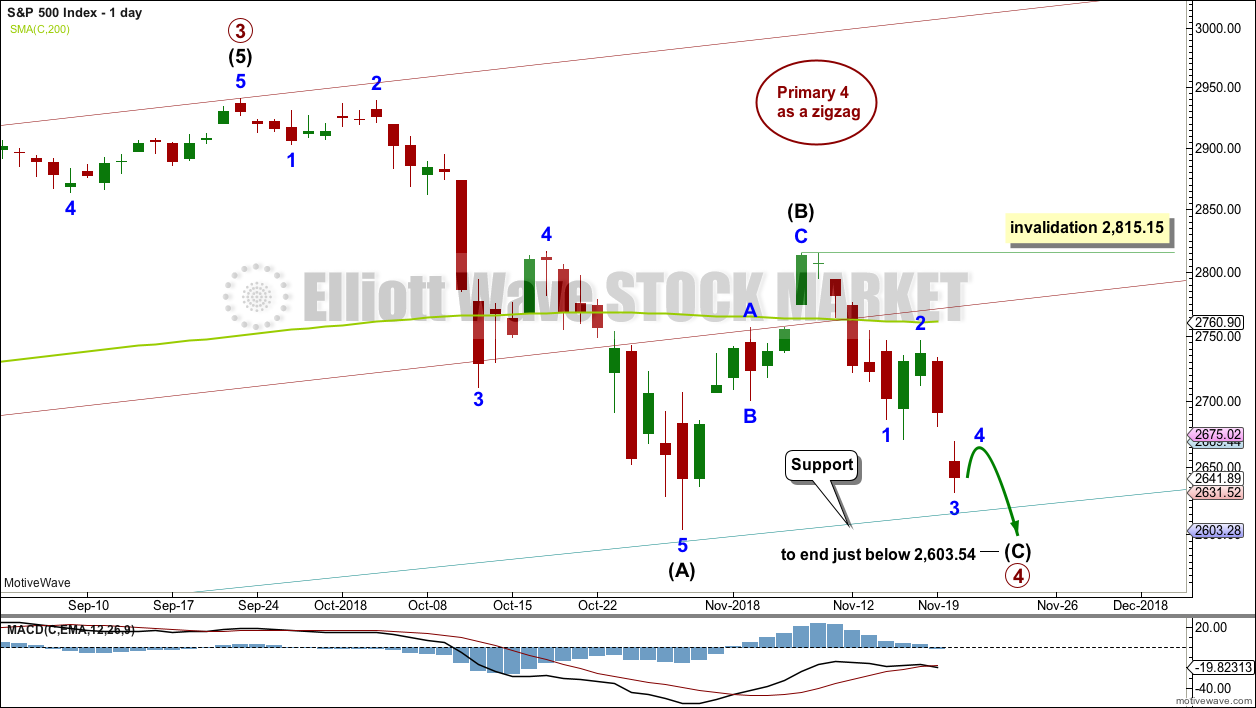
Primary wave 4 may be unfolding as a single zigzag, which is the most common type of corrective structure.
Within the zigzag, intermediate wave (B) may now be a complete structure, ending close to the 0.618 Fibonacci ratio of intermediate wave (A).
Intermediate wave (C) may now unfold lower as a five wave structure. Intermediate wave (C) would be very likely to end at least slightly below the end of intermediate wave (A) at 2,603.54 to avoid a truncation. It may end about support at 2,600.
Within intermediate wave (C), minor waves 1, 2 and now 3 may be complete. If this labelling is correct, then minor wave 4 may not move into minor wave 1 price territory above 2,685.75. Minor wave 5 may be relatively short and brief; this structure could be complete as quickly as just one more session.
This wave count could expect a reasonably small overshoot of the teal trend channel if the labelling within intermediate wave (C) today is correct.
Within intermediate wave (C), minor wave 2 may not move beyond the start of minor wave 1 above 2,815.15.
DAILY CHART – FLAT
Click chart to enlarge.
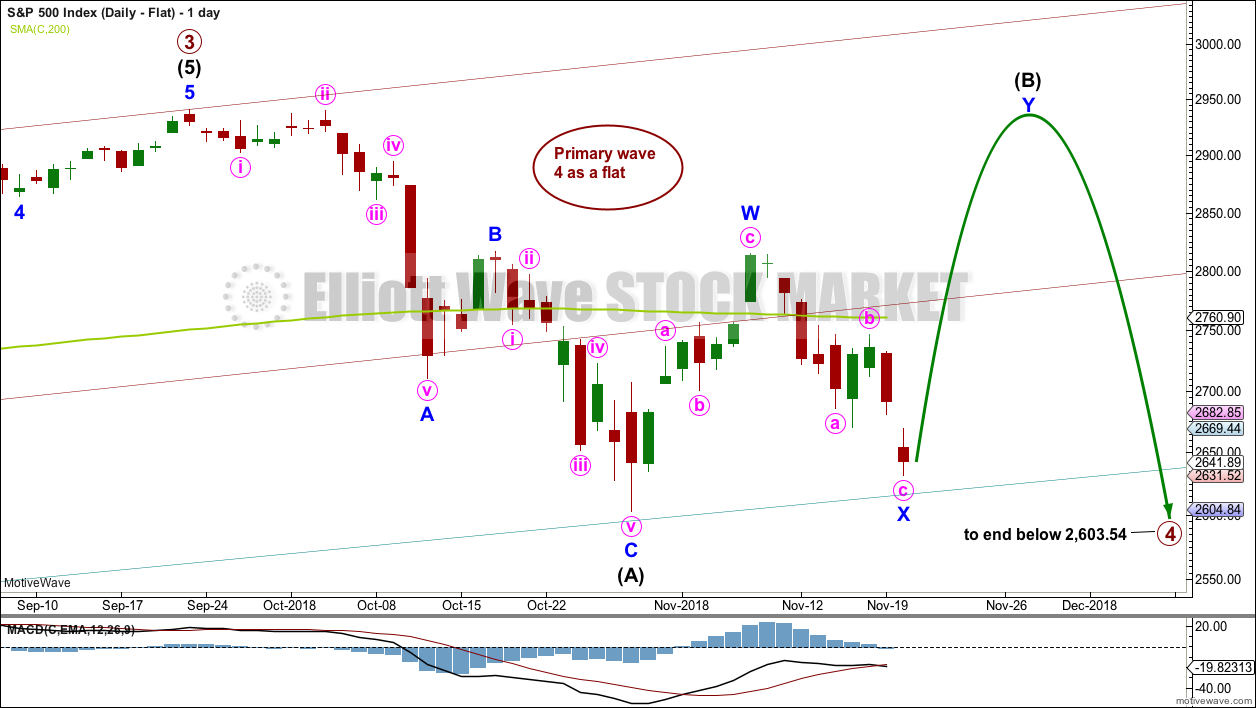
Primary wave 2 was a regular flat correction. If primary wave 4 unfolds as a flat correction, then there would be no alternation in structure between the two corrections; for this reason, this wave count is judged to have a low probability.
However, alternation is a guideline, not a rule, and it is not always seen. This wave count is possible.
If primary wave 4 is a flat correction, then within it intermediate wave (B) must move higher to retrace a minimum 0.9 length of intermediate wave (A).
When intermediate wave (B) is complete, then intermediate wave (C) should move below the end of intermediate wave (A) at 2,603.54 to avoid a truncation. This would expect a large overshoot of the teal trend line, which further reduces the probability of this wave count.
DAILY CHART – DOUBLE ZIGZAG
Click chart to enlarge.
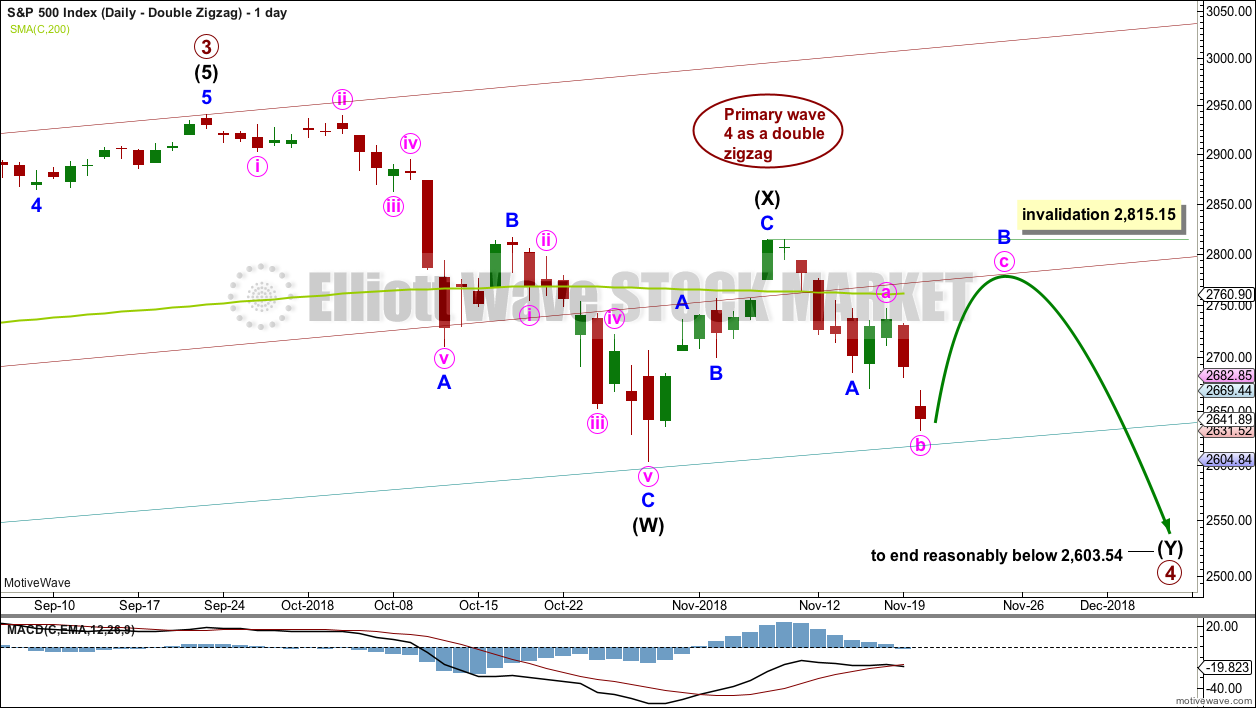
Primary wave 4 may also be unfolding as a double zigzag.
The first zigzag in the double may be complete, labelled intermediate wave (W). The double may joined by a complete three in the opposite direction, a zigzag labelled intermediate wave (X).
The second zigzag in the double may have begun. It is labelled intermediate wave (Y). Within intermediate wave (Y), minor wave B may not move beyond the start of minor wave A above 2,815.15.
The purpose of a second zigzag in a double is to deepen the correction when the first zigzag does not move price deep enough. To achieve this purpose intermediate wave (Y) should be expected to end reasonably below the end of intermediate wave (W) at 2,603.54. This would expect a very large overshoot of the teal trend channel; for this reason, this wave count is judged to have the lowest probability.
BULLISH ALTERNATE ELLIOTT WAVE COUNT
WEEKLY CHART
Click chart to enlarge.
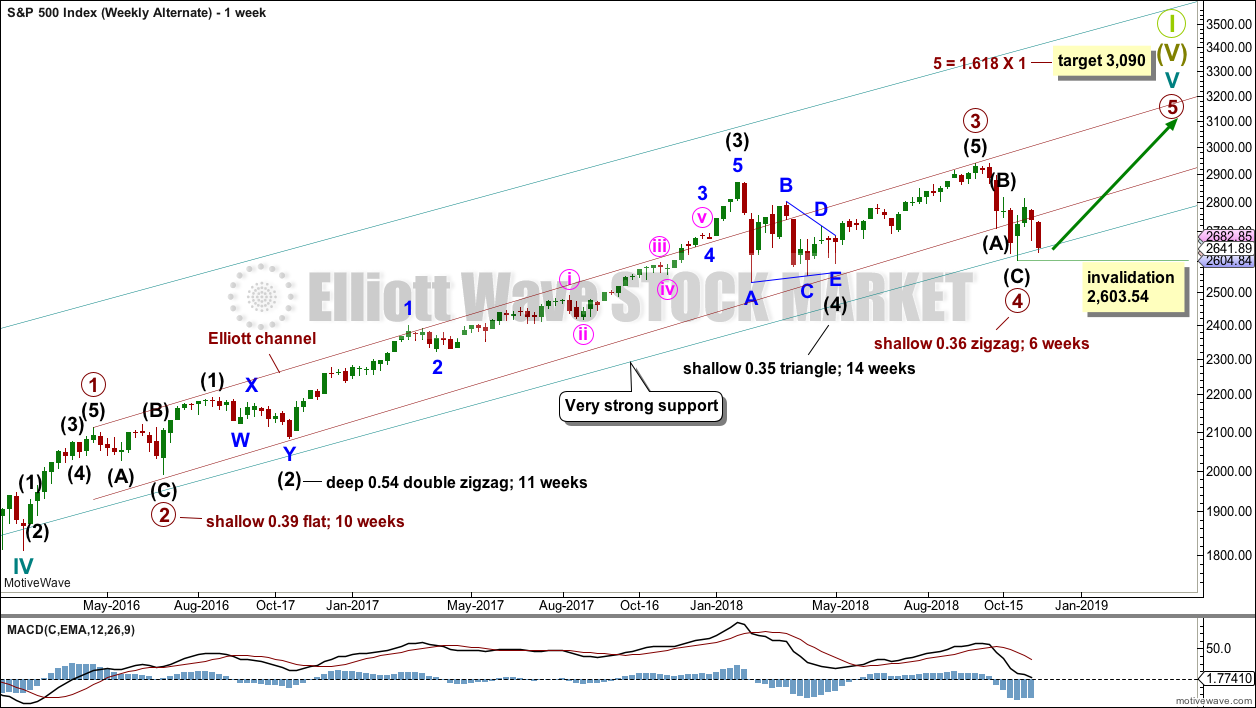
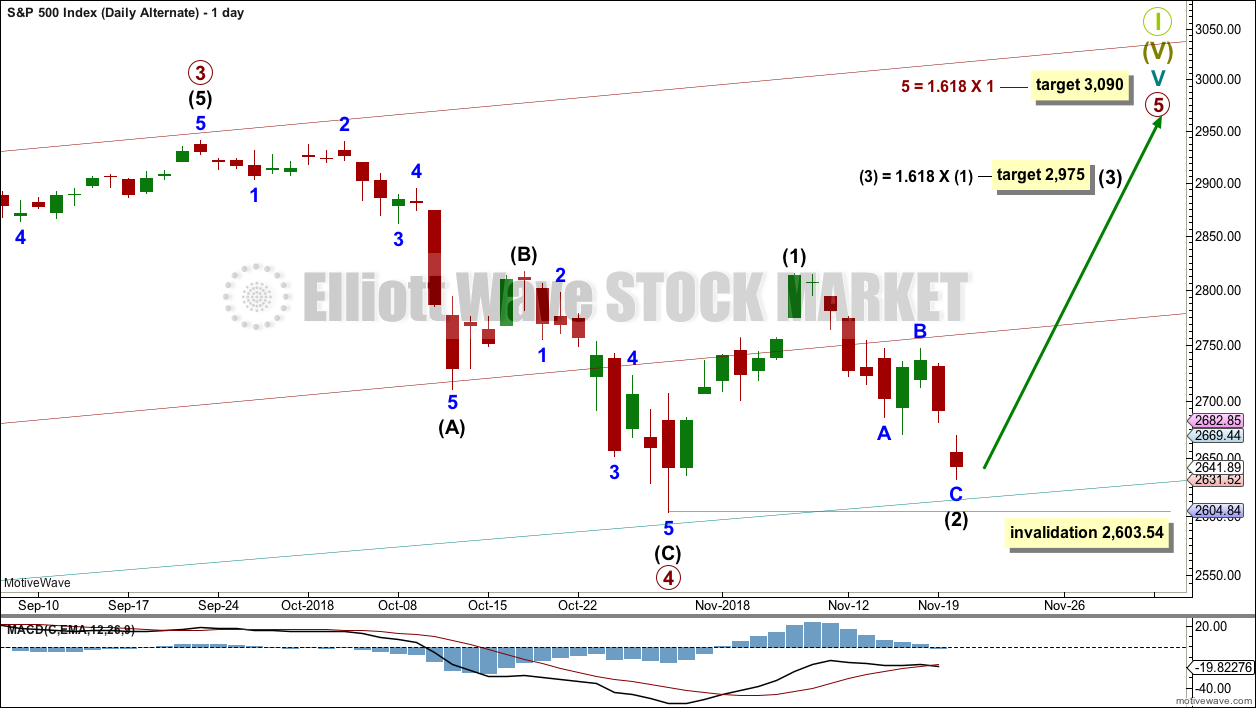
It is possible that primary wave 4 could be over as a relatively quick zigzag, ending about support at the lower edge of the teal channel.
The proportion between primary waves 2 and 4 is reasonable. Flat corrections tend to be longer lasting structures than zigzags. There would be perfect alternation in structure and inadequate alternation in depth. This is acceptable.
This wave count has the right look at the monthly chart level.
If primary wave 5 ends at or after the end of December 2018 and the AD line fails to make new all time highs, there would then be the minimum required four months of bearish divergence between price and the AD line. If this happens, then the conditions for the end of this bull market would be in place.
A new target is calculated for primary wave 5 to end. If primary wave 5 were to be only equal in length with primary wave 1, then it would be truncated. A truncated primary wave 5 would be unlikely as then there could be no bearish divergence with the AD line. The next Fibonacci ratio in the sequence is used to calculate a target for primary wave 5.
Within primary wave 5, no second wave correction may move beyond the start of its first wave below 2,603.54.
DAILY CHART
Click chart to enlarge.
The subdivisions of primary wave 4 are seen in exactly the same way as most of the charts above except the degree of labelling is just moved up one degree.
Within primary wave 5, intermediate wave (1) may be over. Intermediate wave (2) may not move beyond the start of intermediate wave (1) below 2,603.54.
Primary wave 5 may subdivide either as an impulse (more likely) or an ending diagonal (less likely). Intermediate wave (1) may be seen as either a five wave impulse or a three wave zigzag at lower time frames, and so at this stage primary wave 5 could be either an impulse or a diagonal.
Primary wave 5 at its end may be expected to exhibit reasonable weakness. At its end, it should exhibit a minimum of 4 months bearish divergence with the AD line, it may exhibit bearish divergence between price and RSI and Stochastics, and it may lack support from volume; it may not be possible to distinguish a weak fifth wave from a B wave.
TECHNICAL ANALYSIS
WEEKLY CHART
Click chart to enlarge. Chart courtesy of et=”_blank”>StockCharts.com.
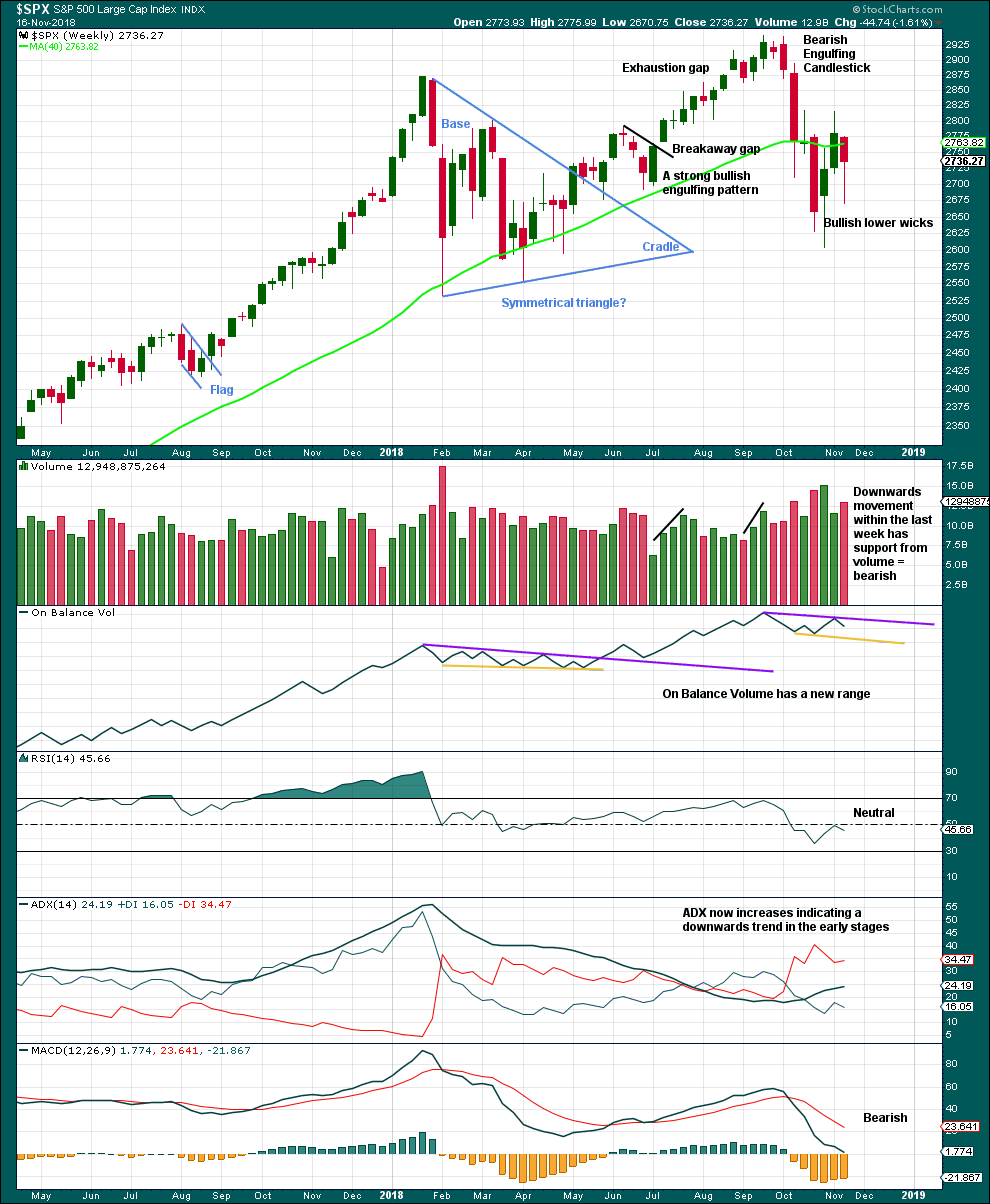
Another long lower wick last week is fairly bullish. An upwards week this week looks most likely.
DAILY CHART
Click chart to enlarge. Chart courtesy of StockCharts.com.
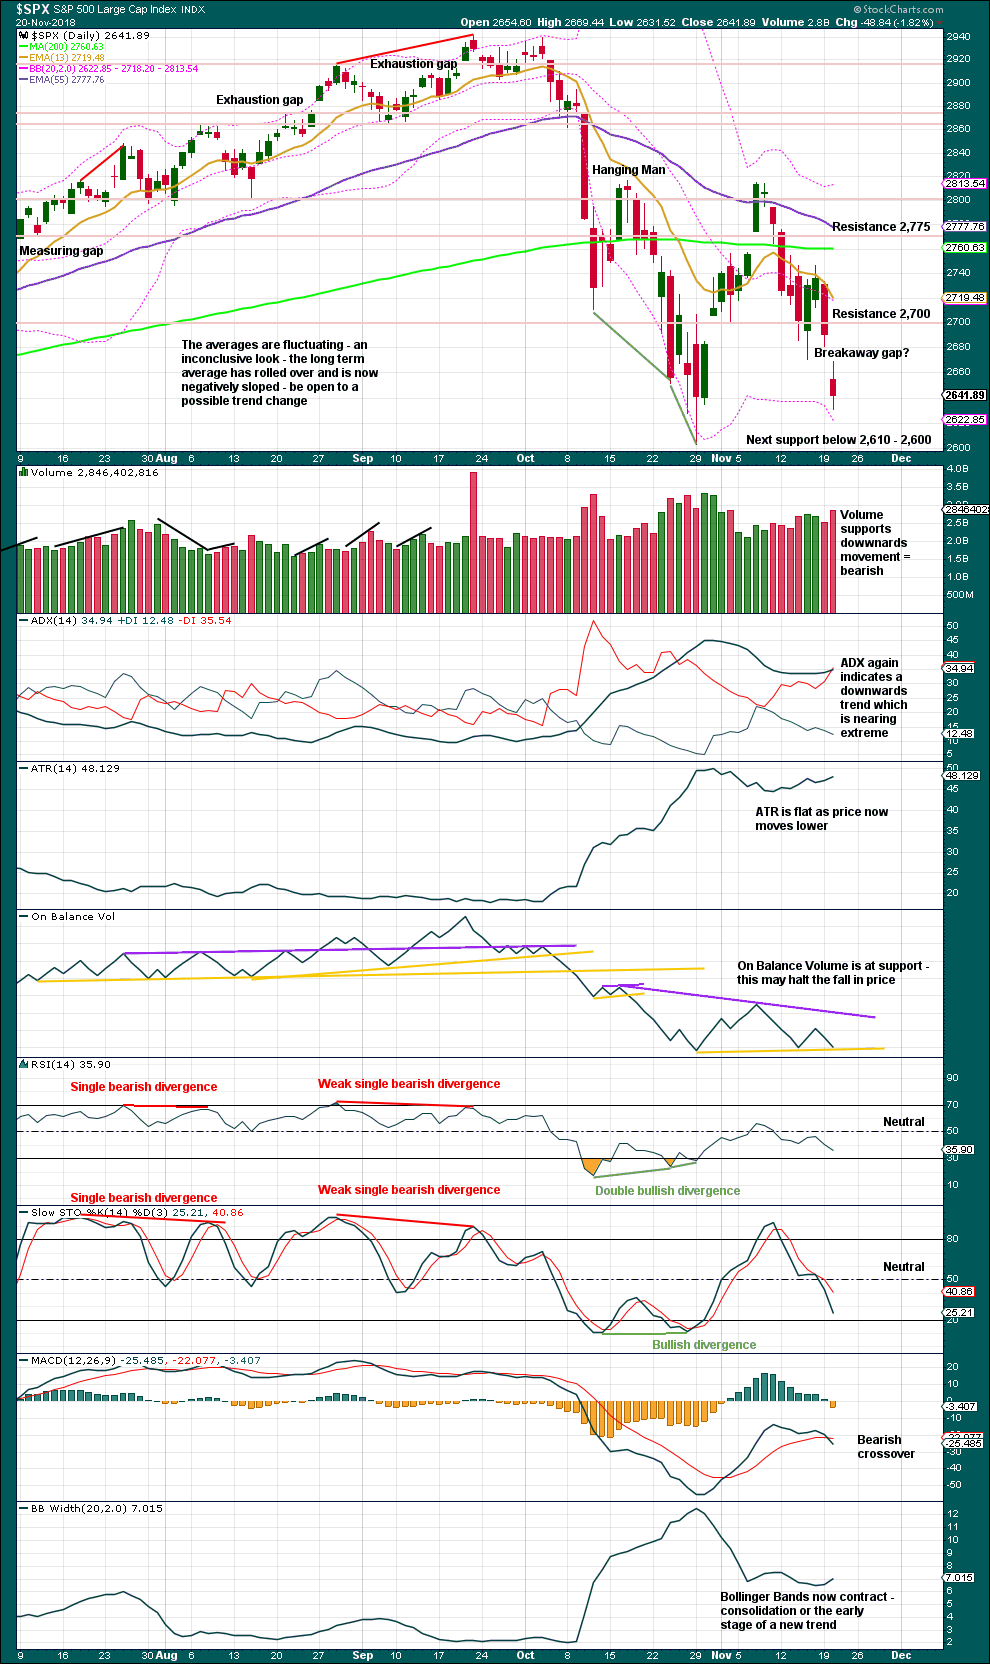
Price is nearing support. The gap today may be a breakaway gap, but with price essentially range bound it may also be a pattern gap. Pattern gaps are usually closed; breakaway gaps are not.
On Balance Volume may halt the fall in price here. If price does move lower, then look for support about 2,610 – 2,600.
BREADTH – AD LINE
WEEKLY CHART
Click chart to enlarge. Chart courtesy of StockCharts.com. So that colour blind members are included, bearish signals
will be noted with blue and bullish signals with yellow.
Last week both price and the AD line have moved lower. There is no new divergence.
DAILY CHART
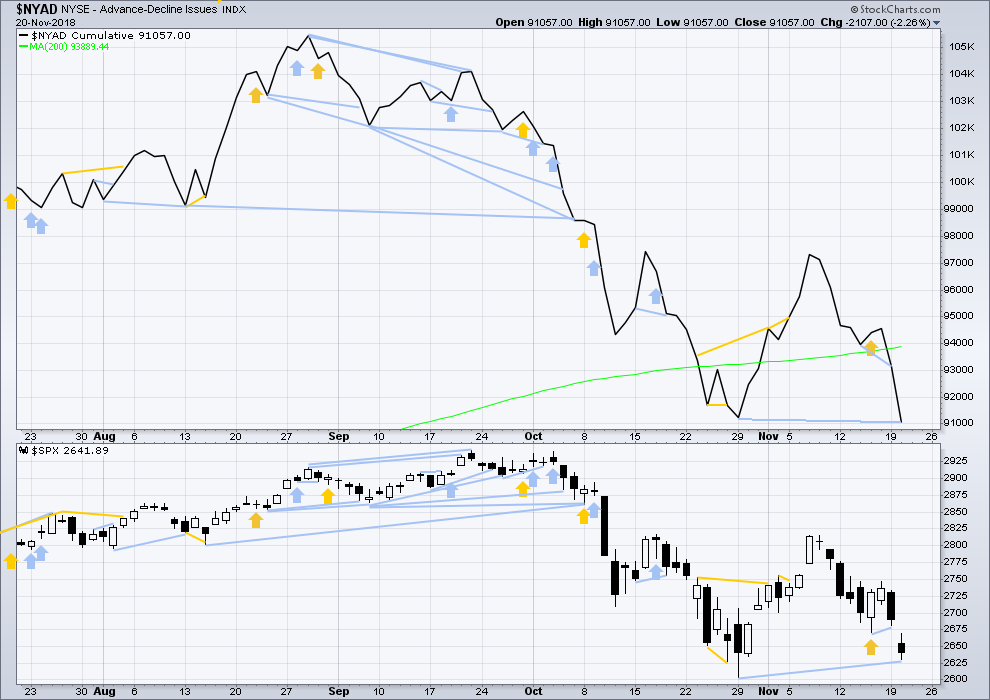
Click chart to enlarge. Chart courtesy of StockCharts.com. So that colour blind members are included, bearish signals
will be noted with blue and bullish signals with yellow.
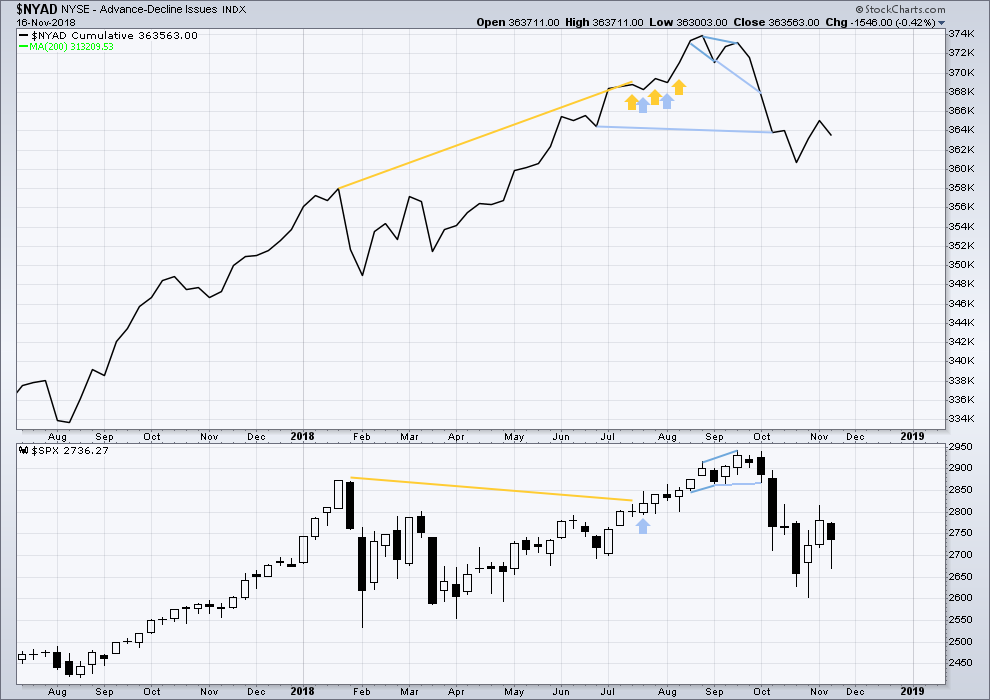
There is normally 4-6 months divergence between price and market breadth prior to a full fledged bear market. This has been so for all major bear markets within the last 90 odd years. With no longer term divergence yet at this point, any decline in price should be expected to be a pullback within an ongoing bull market and not necessarily the start of a bear market. New all time highs from the AD line on the 29th of August means that the beginning of any bear market may be at the end of December 2018, but it may of course be a lot longer than that. My next expectation for the end of this bull market may now be October 2019.
Breadth should be read as a leading indicator.
Today the AD line has made a new swing low below the swing low of the 29th of October, but price has not. Market breadth is falling faster than price. This divergence is bearish for the short term, but it is rather weak. This supports the zigzag Elliott wave count.
VOLATILITY – INVERTED VIX CHART
WEEKLY CHART
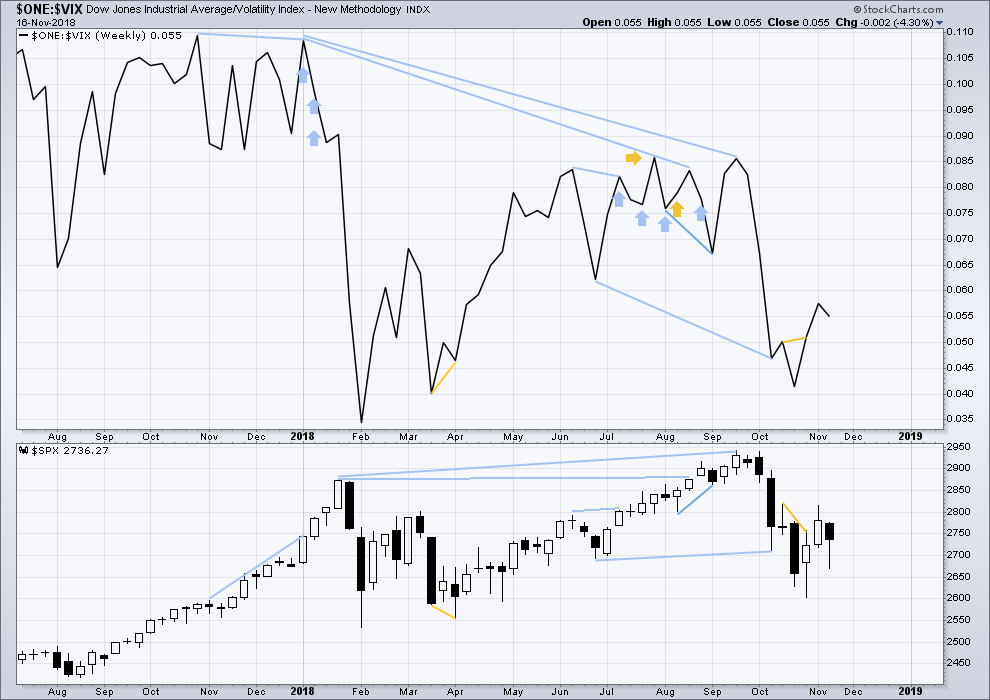
Click chart to enlarge. Chart courtesy of StockCharts.com. So that colour blind members are included, bearish signals
will be noted with blue and bullish signals with yellow.
Last week both price and inverted VIX have moved lower. There is no new divergence.
DAILY CHART
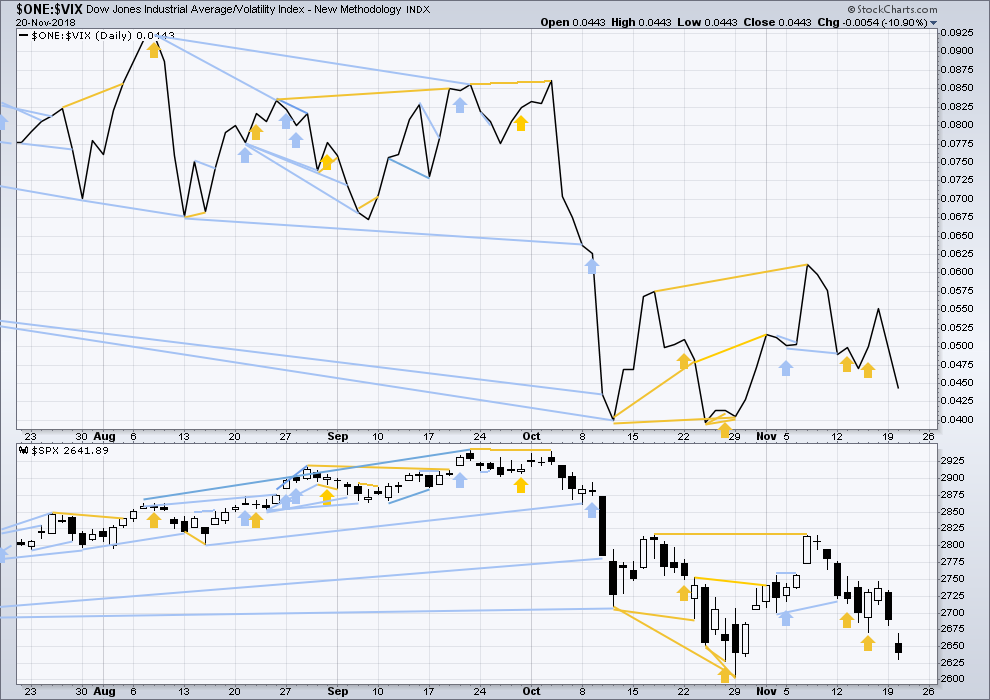
Click chart to enlarge. Chart courtesy of StockCharts.com. So that colour blind members are included, bearish signals
will be noted with blue and bullish signals with yellow.
Normally, volatility should decline as price moves higher and increase as price moves lower. This means that normally inverted VIX should move in the same direction as price.
Both price and inverted VIX are moving lower. Inverted VIX is not falling faster than price. There is no short nor mid-term divergence.
DOW THEORY
The following lows need to be exceeded for Dow Theory to confirm the end of the bull market and a change to a bear market:
DJIA: 23,344.52.
DJT: 9,806.79.
S&P500: 2,532.69.
Nasdaq: 6,630.67.
Published @ 05:48 p.m. EST.
—
Careful risk management protects your trading account(s).
Follow my two Golden Rules:
1. Always trade with stops.
2. Risk only 1-5% of equity on any one trade.
I’ve taken note of bearish comments below, and have just finished the process that I go through to do the analysis.
And I must say that I can’t see what you guys are seeing.
I’m seeing an inconclusive day today.
The open gap above from yesterday could be bearish, but it could also just be a pattern gap. It is after all within a fairly clear trading range; resistance above 2,815 – 2,775, and support below 2,603.
I see price at a trend line which has held for over 10 years. And I see On Balance Volume at support.
I also see VIX printing a red daily candlestick which moved lower; as price has moved higher, that’s normal and there’s no divergence.
So, my question is, in all of this, am I missing something?
Genuine question guys. I don’t want to be missing something.
No, you’re not missing anything Lara. The market spoke today. I read the comments to gauge the sentiment-it has been pretty bearish. So, I bullish short-term, but I’m a trader. Just think-if you’re a hedge fund and you were short going into this week…You probably going to cover since Fed might be a little more dovish with oil crashing and just in case Trump makes a trade deal with China. My 2 cents. Happy trading.
Hourly chart updated:
No change. Price is so far behaving as expected.
For confidence that a low is in place wait for a breach of the pink channel.
Of all the pieces of technical analysis I’m relying on right now, it’s the teal trend line that I am judging to be the strongest. This is mostly why I’m expecting a good bounce here.
Now, that doesn’t mean it has to happen. I could be wrong. But the balance of probability says that line which has held for over 10 years and held again this October, is likely to hold today.
FYI a Motive Wave issue: the teal trend channel is on the monthly and daily charts, I can’t copy it over to the hourly chart with Motive Wave because the anchor points are too far in the past for it to see them.
If MW can’t see the anchor points of a line or channel, then it won’t put the lines in the right place.
What I do see today so far is not the action I’d expect at a bottom/turn point. Today’s action so far to me say “this is not over”. Further action over the next few may evolve that to “yes it is”, but so far the action is more indicative another pause before more selling. The failure to fill the gap, and the daily chart is anemic, and still in “strongly down” trend per my own trend indicator.
Also, I’ve learned that when Verne is shouting “down”, it’s not a certainty… …but it is to be taken very seriously. My “Verne indicator”…
Move up is indeed corrective. 🙂
I’ve just checked on the one minute chart. I can see it subdividing either as a three wave zigzag, or a five wave impulse.
Both actually look okay.
And so I can’t say with confidence it’s corrective, or impulsive.
I find EWO helpful in cases of ambiguity.
VIX FINALLY starting to gap higher.
They have been smashing the attempted break-out for all they are worth.
If it prints green before the close…well, you know what to do… 🙂
That is one HUGE VIX snake!
I had to chuckle at some talking head analyst wondering about which way it will break!
Are you kidding me??!! 🙂
3,3,5 with yet another ED C wave!
Remarkable!
Bulls need to close the gap above around 2680.
We have a bullish crossover on SPX MACD on the hourly chart.
I like me a bear put debit spread on TSLA right here and now. The weekly chart screams “relative high!” at me. Bought a Jan 350/340, “in the money” right out of the chute (TSLA at 338 today). $10 wide but cost less than $5. I think that’s an excellent price for an ITM debit spread.
I also really like UNH here to the long side, via put sale.
IT’S RAINING IN SF!!!! Oh Praise the Gods of Weather!!!!!!
Goodbye smoke…goodbye mega-fire!!!!!!! Blessed rain…..FINALLY!!!!! Thanks to all who danced….
Yeah. But we have your SF fog today.
You’ll have to give that back at some point Rodney.
RUT is in one of its patented moves. I love RUT/IWM for the simple reason that it’s 2000 issues strong, making it’s moves VERY smooth and consistent (often). You don’t need no ticket, just get on board once the 5 minute trend asserts itself!
interesting how even the charts have a similar shape, the SPX and RUT have different counts……. the RUT is still the canary in the coal mine
Does anyone has a count for RUT?
Would appreciate if you can please post?
Thanks
GS is on sale today at 193, after a peak in early 2018 at 275. It’s tagged and turned (but no hourly triggers yet, only 5 minute triggers) the 61.8% retrace level at 190.6. With option prices sky high right now…I’m selling Dec puts at 190. A move below 190 and I’ll take my little loss and wait to try again. Good reward/risk ratio here IMO.
Tomorrow is “Thanksgiving” here in the US. I will share one of the many things I give thanks for. I give thanks…for Lara’s immaculate, objective, thorough, world-class analysis, and her commitment to providing it day in and day out! Thank you Lara. You help me make $$, and to say it’s “important” to me would be a vast understatement!
I agree whole heartedly. I am also thankful for your contributions and those of all others here. Have a great Thanksgiving Day.
Also root for my Chicago Bears! That is The only bear I am rooting for.
Thanks guys! A nice way to start my day.
Holdin’ the Flag!
White flag? Blue flag? Red flag? Green flag?
I’m holding a flag with a big brown turkey on it!
Today I prefer a flag with a BULL on it!
🙂
Careful!!