
A breach of the channel on the hourly chart indicated a low may be in place.
Price has moved higher after the channel breach, which was expected.
Summary: A low looks to be in place at least for the short to mid term. A target for the next wave up is now 2,882 or 3,013 (alternate wave count).
Five daily charts today look at five different structures for primary wave 4, in order of probability (roughly): triangle, combination, zigzag, double zigzag, and flat.
Primary wave 4 could be over. The alternate wave count outlines this possibility.
New updates to this analysis are in bold.
The biggest picture, Grand Super Cycle analysis, is here.
Last published monthly chart is here, video is here.
ELLIOTT WAVE COUNT
WEEKLY CHART
Click chart to enlarge.
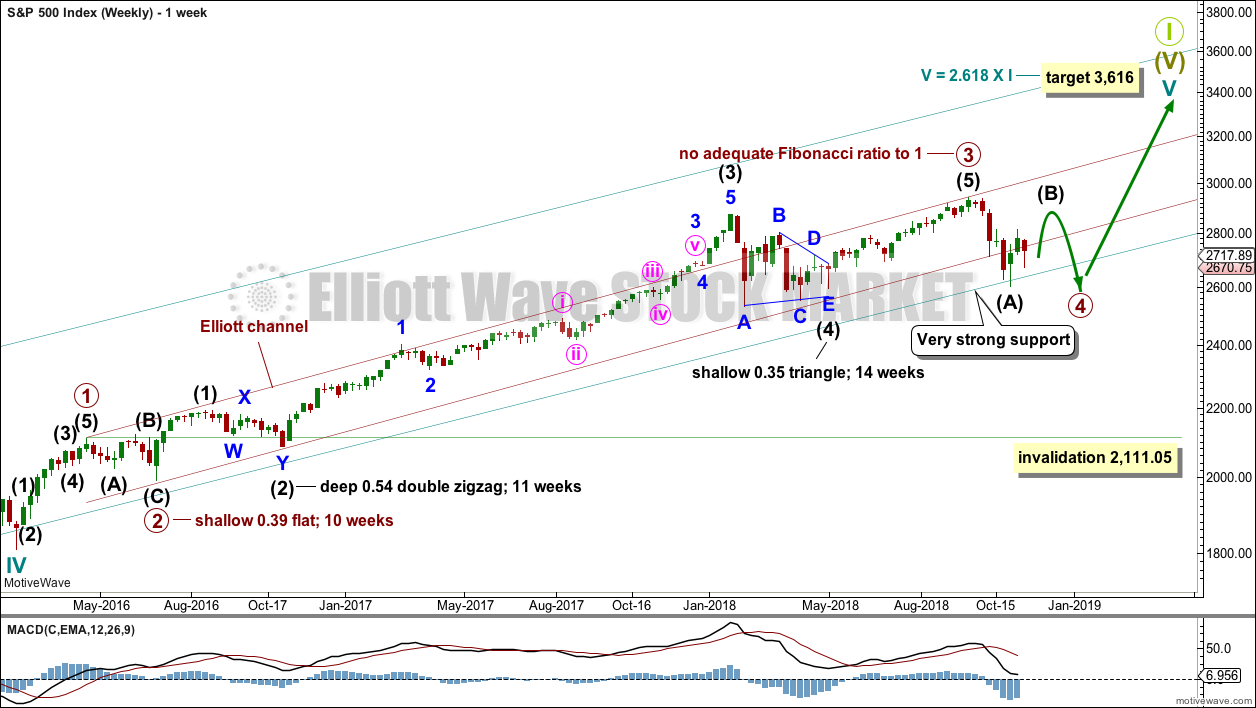
Cycle wave V must complete as a five structure, which should look clear at the weekly chart level and also now at the monthly chart level. It may only be an impulse or ending diagonal. It is clear it is an impulse.
Cycle wave V has passed equality in length with cycle wave I, and 1.618 the length of cycle wave I. The next Fibonacci ratio is used to calculate a target. When primary wave 4 is complete and the starting point for primary wave 5 is known, then the final target may also be calculated at primary degree. At that stage, there may be two targets, or the final target may widen to a small zone.
Within cycle wave V, the third waves at all degrees may only subdivide as impulses.
Within primary wave 3, there is perfect alternation and excellent proportion between intermediate waves (2) and (4).
The maroon channel is drawn about primary degree waves. The first trend line is drawn from the ends of primary waves 1 to 3, then a parallel copy is placed upon the low of primary wave 2. The overshoot of the upper edge of this channel by the end of intermediate wave (3) looks typical. For the S&P, its tghird waves are usually the strongest portion of an impulse; they often exhibit enough strength to overshoot channels.
Primary wave 4 now has an overshoot on the lower edge of the channel. This is acceptable; fourth waves are not always neatly contained within channels drawn using this technique.
Primary wave 4 may find very strong support about the lower edge of the teal channel, and it looks like this is from where price bounced on the 29th of October. This channel is copied over from the monthly chart and contains the entire bull market since its beginning in March 2009. While Super Cycle wave (V) is incomplete, this channel should not be breached at the weekly chart level.
Primary wave 4 may not move into primary wave 1 price territory below 2,111.05.
At this stage, the expectation is for the final target to be met in October 2019. If price gets up to this target and either the structure is incomplete or price keeps rising through it, then a new higher target would be calculated.
At this stage, the various possible structures for primary wave 4 will be published as separate daily charts, presented in order of probability.
DAILY CHART – TRIANGLE
Click chart to enlarge.
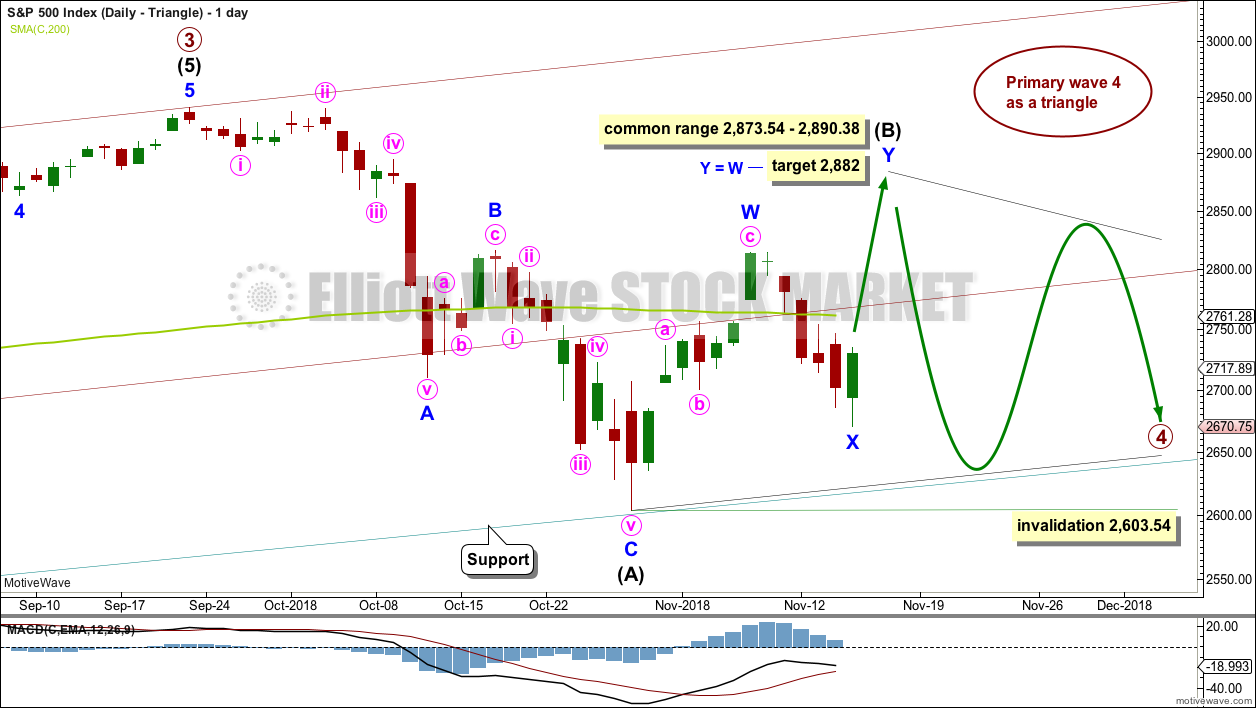
If primary wave 4 unfolds as a triangle, it would have perfect alternation with the regular flat correction of primary wave 2. It would also continue to find support about the lower edge of the teal trend channel. Triangles are fairly common structures for fourth waves. For these reasons this wave count may have a slightly higher probability than the other daily charts.
If primary wave 4 is unfolding as a triangle, then within it intermediate wave (B) would most likely be incomplete. To label intermediate wave (B) over at the last swing high is possible, but it would look too shallow for a normal looking Elliott wave triangle.
Triangle sub-waves are often about 0.8 to 0.85 the length of the prior wave. This gives a target range for intermediate wave (B).
One triangle sub-wave may subdivide as a multiple; this is most often wave C, but it may also be wave B. Intermediate wave (B) may be unfolding higher as a double zigzag. A target is today calculated for intermediate wave (B) to end.
There is no upper invalidation point for this wave count. Intermediate wave (B) may make a new high above the start of intermediate wave (A) as in a running triangle. Intermediate wave (B) should exhibit clear weakness. If price does make a new high, then for this wave count it should come with weak volume and bearish divergence between price and one or both of RSI or Stochastics.
Within the triangle, intermediate wave (C) may not move beyond the end of intermediate wave (A) below 2,603.54.
HOURLY CHART – TRIANGLE
Click chart to enlarge.
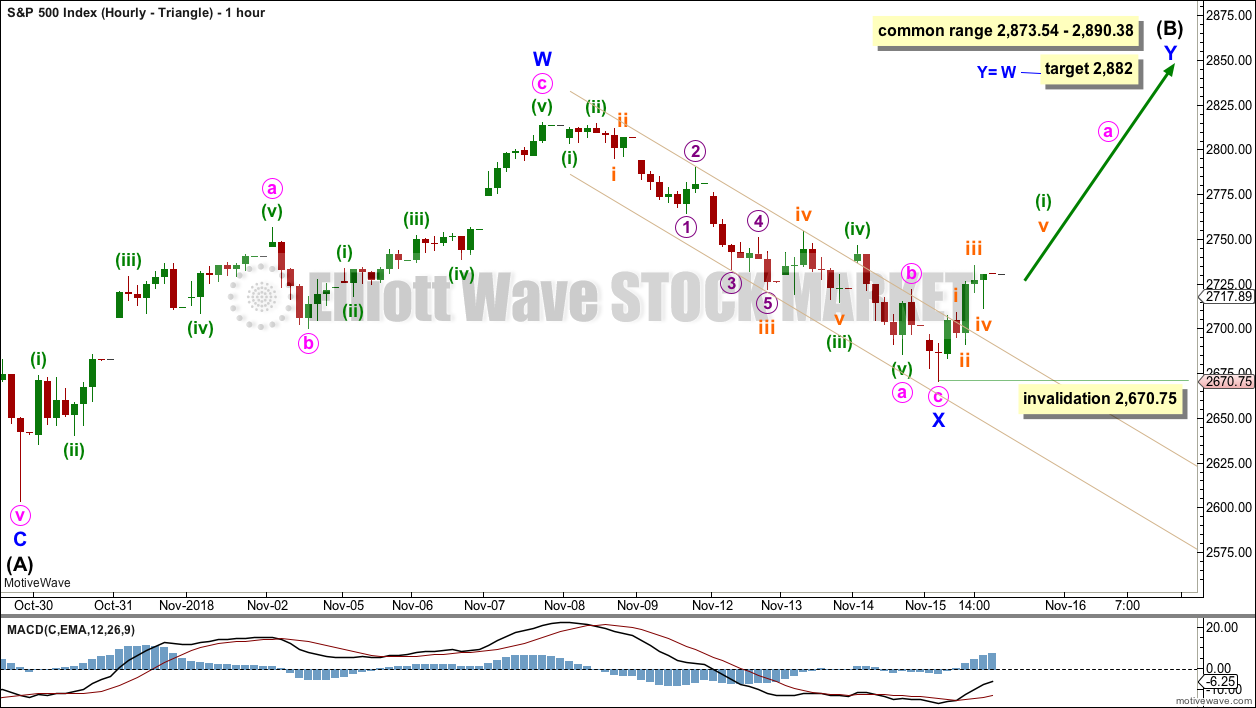
Now that the narrow best fit channel about minor wave X is breached by clearly upwards movement, it looks like minor wave X should be over and minor wave Y should be underway.
Minor wave Y should subdivide as a zigzag. Within minor wave Y, minute wave a would be incomplete. Minute wave a must subdivide as a five wave structure. Within minute wave a, minuette wave (ii) may not move beyond the start of minuette wave (i) below 2,670.75.
DAILY CHART – COMBINATION
Click chart to enlarge.
This wave count is judged to have only a very slightly lower probability than the triangle.
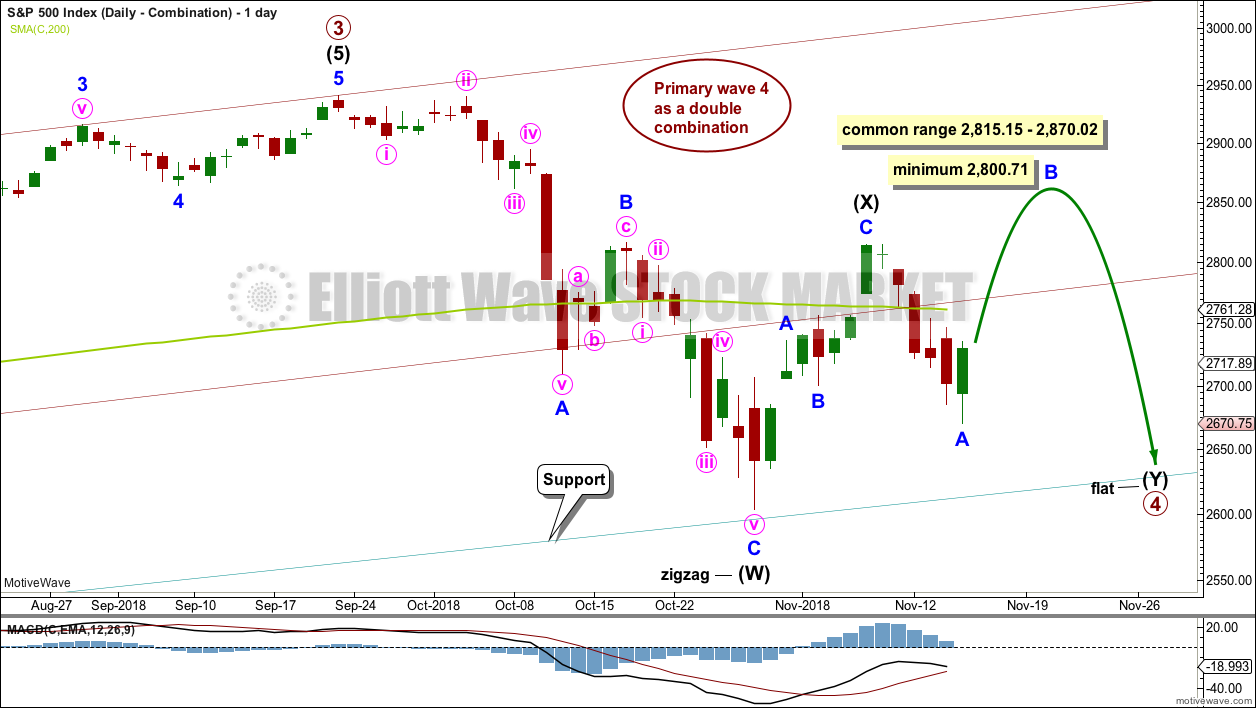
Primary wave 4 may be unfolding as a double combination. The first structure in the double may be a complete zigzag labelled intermediate wave (W). The double may be joined by a three in the opposite direction labelled intermediate wave (X). Intermediate wave (X) may be complete as a single zigzag; it is deep at 0.63 the length of intermediate wave (W), which looks reasonable.
Intermediate wave (Y) would most likely be a flat correction, which should subdivide 3-3-5. At its end, it may still find strong support about the lower edge of the teal trend channel.
At the hourly chart level, minor wave A may be a complete zigzag, in exactly the same way as minor wave X on the hourly chart published above.
Within the flat correction of intermediate wave (Y), minor wave B must retrace a minimum 0.9 length of minor wave A. The common range for minor wave B is from 1 to 1.38 times the length of minor wave A. Minor wave B may make a new high above the start of minor wave A at 2,815.15 as in an expanded flat.
DAILY CHART – ZIGZAG
Click chart to enlarge.
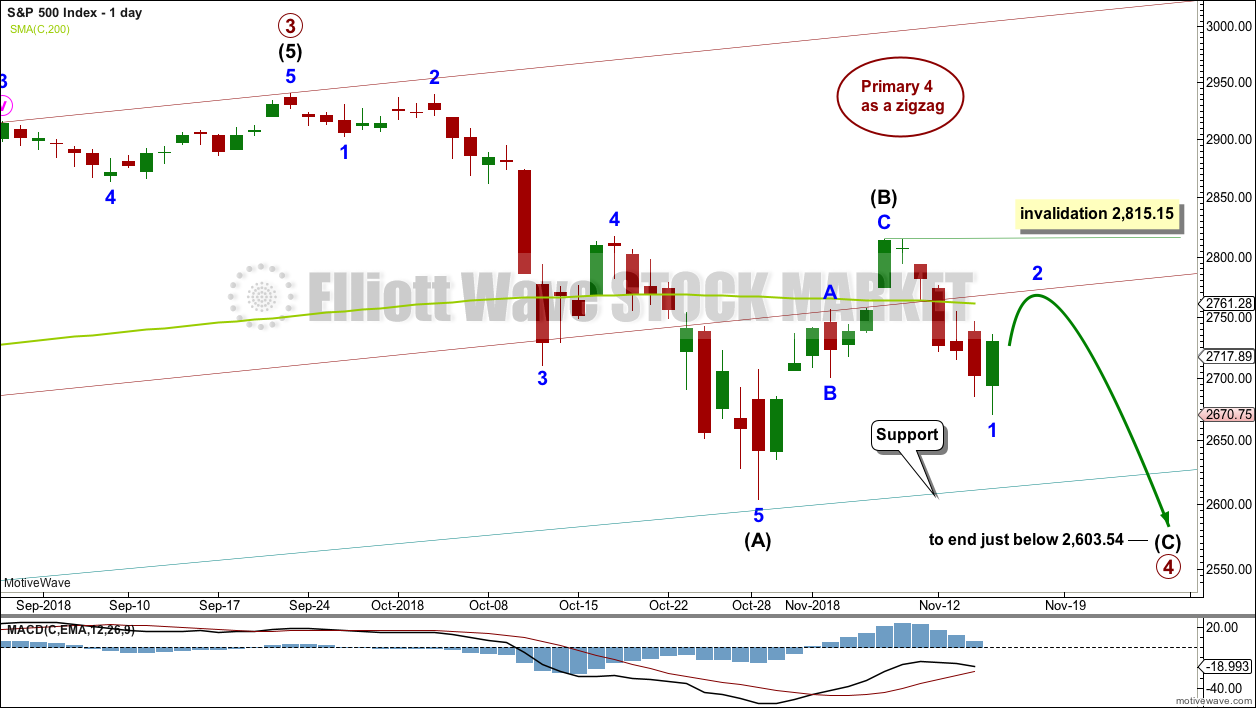
Primary wave 4 may be unfolding as a single zigzag, which is the most common type of corrective structure.
Within the zigzag, intermediate wave (B) may now be a complete structure, ending close to the 0.618 Fibonacci ratio of intermediate wave (A).
Intermediate wave (C) may now unfold lower as a five wave structure. Intermediate wave (C) would be very likely to end at least slightly below the end of intermediate wave (A) at 2,603.54 to avoid a truncation. It may end about support at 2,600.
This wave count would expect a fairly large overshoot of the teal trend channel. This reduces the probability of this wave count.
Within intermediate wave (C), minor wave 2 may not move beyond the start of minor wave 1 above 2,815.15.
DAILY CHART – DOUBLE ZIGZAG
Click chart to enlarge.
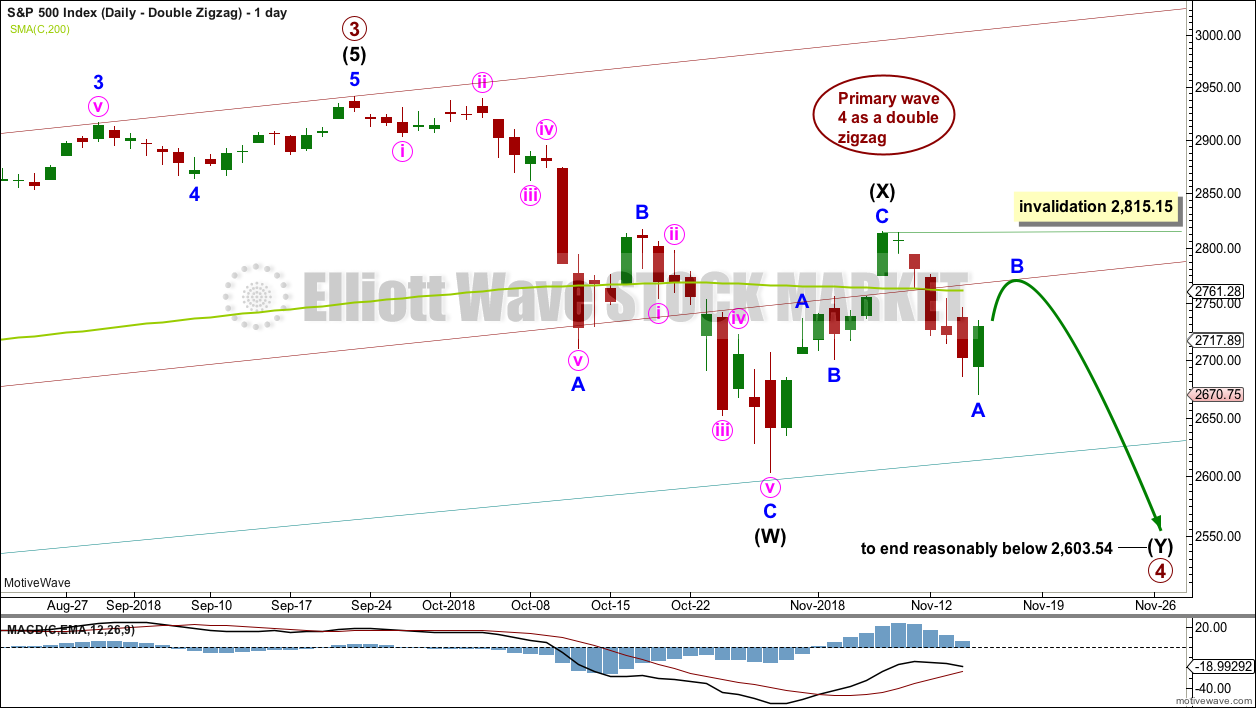
Primary wave 4 may also be unfolding as a double zigzag.
The first zigzag in the double may be complete, labelled intermediate wave (W). The double may joined by a complete three in the opposite direction, a zigzag labelled intermediate wave (X).
The second zigzag in the double may have begun. It is labelled intermediate wave (Y). Within intermediate wave (Y), minor wave B may not move beyond the start of minor wave A above 2,815.15.
The purpose of a second zigzag in a double is to deepen the correction when the first zigzag does not move price deep enough. To achieve this purpose intermediate wave (Y) should be expected to end reasonably below the end of intermediate wave (W) at 2,603.54. This would expect a very large overshoot of the teal trend channel; for this reason, this wave count is judged to have the lowest probability.
DAILY CHART – FLAT
Click chart to enlarge.
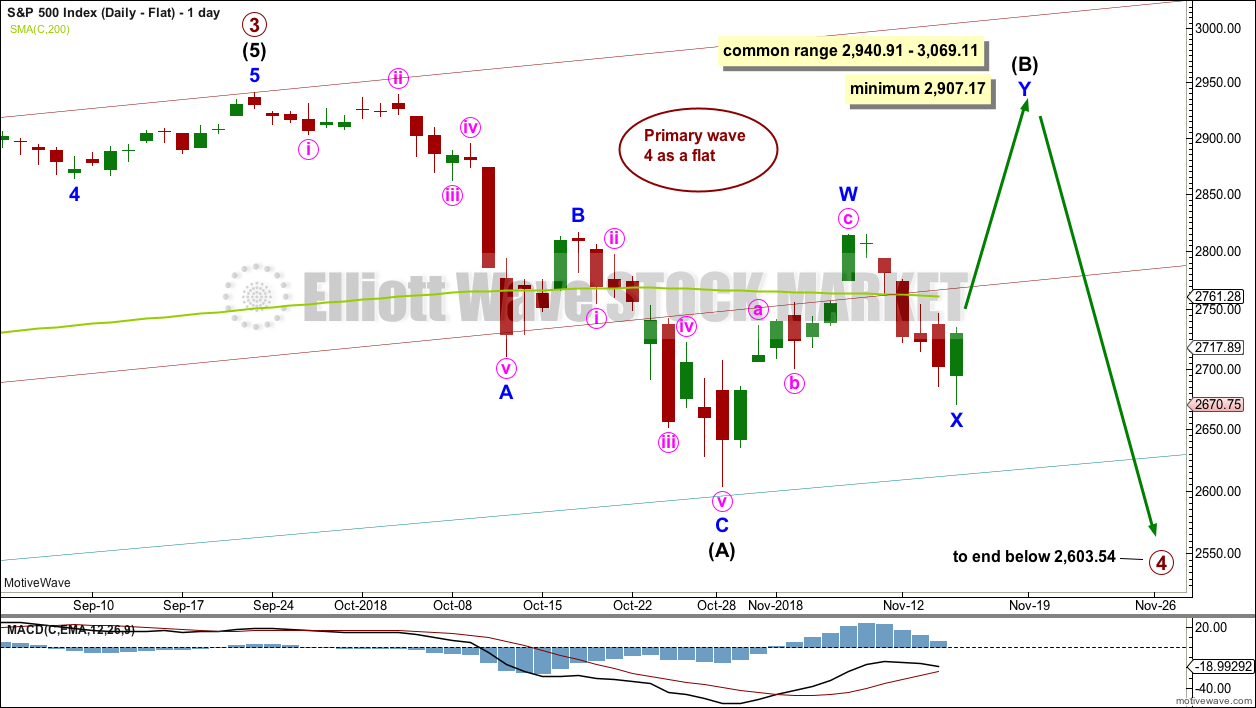
Primary wave 2 was a regular flat correction. If primary wave 4 unfolds as a flat correction, then there would be no alternation in structure between the two corrections; for this reason, this wave count is judged to have a low probability.
However, alternation is a guideline, not a rule, and it is not always seen. This wave count is possible.
If primary wave 4 is a flat correction, then within it intermediate wave (B) must move higher to retrace a minimum 0.9 length of intermediate wave (A).
When intermediate wave (B) is complete, then intermediate wave (C) should move below the end of intermediate wave (A) at 2,603.54 to avoid a truncation. This would expect a reasonable overshoot of the teal trend line, which further reduces the probability of this wave count.
BULLISH ALTERNATE ELLIOTT WAVE COUNT
WEEKLY CHART
Click chart to enlarge.
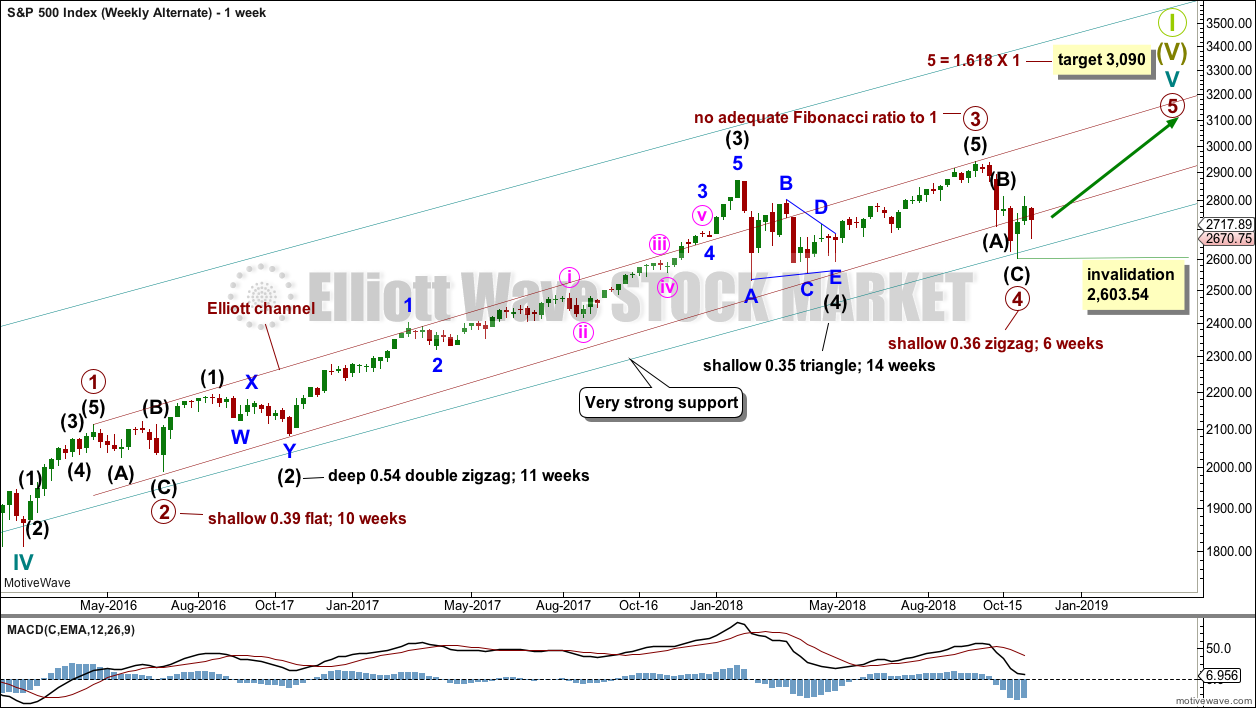
It is possible that primary wave 4 could be over as a relatively quick zigzag, ending about support at the lower edge of the teal channel.
The proportion between primary waves 2 and 4 is reasonable. Flat corrections tend to be longer lasting structures than zigzags. There would be perfect alternation in structure and inadequate alternation in depth. This is acceptable.
This wave count has the right look at the monthly chart level.
If primary wave 5 ends at or after the end of December 2018 and the AD line fails to make new all time highs, there would then be the minimum required four months of bearish divergence between price and the AD line. If this happens, then the conditions for the end of this bull market would be in place.
A new target is calculated for primary wave 5 to end. If primary wave 5 were to be only equal in length with primary wave 1, then it would be truncated. A truncated primary wave 5 would be unlikely as then there could be no bearish divergence with the AD line. The next Fibonacci ratio in the sequence is used to calculate a target for primary wave 5.
Within primary wave 5, no second wave correction may move beyond the start of its first wave below 2,603.54.
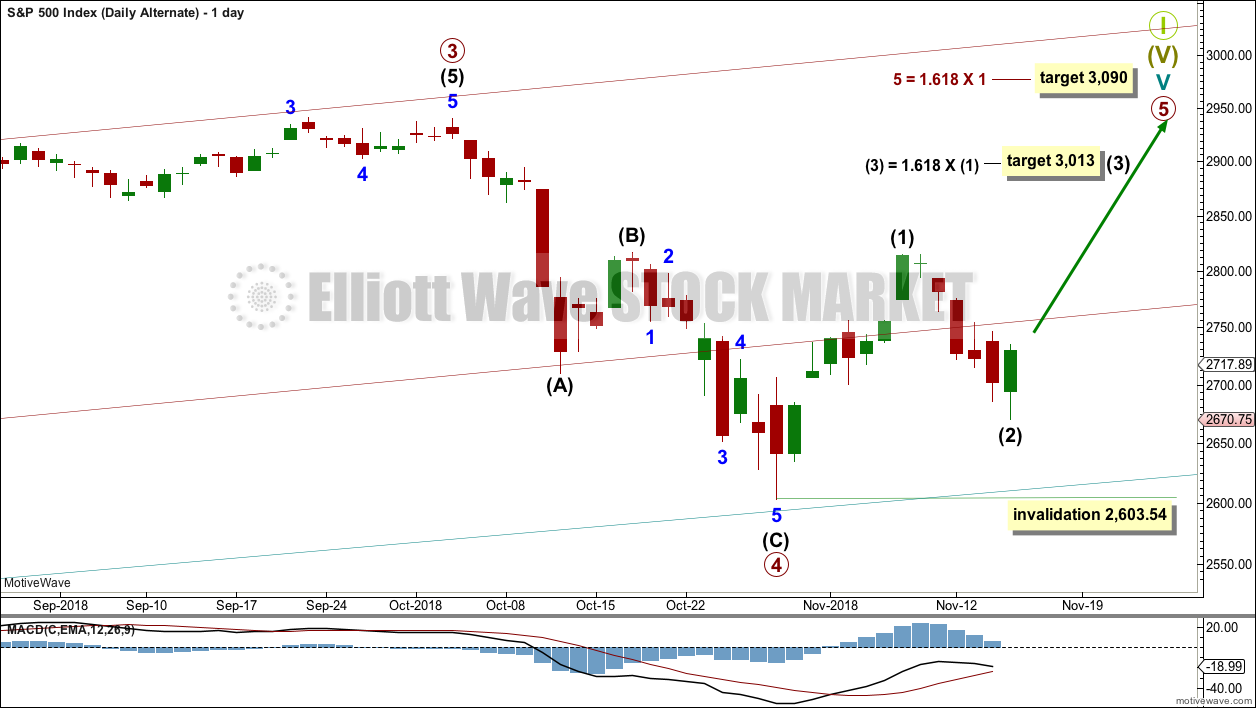
DAILY CHART
Click chart to enlarge.
The subdivisions of primary wave 4 are seen in exactly the same way as most of the charts above except the degree of labelling is just moved up one degree.
Within primary wave 5, intermediate wave (1) may be over. Intermediate wave (2) may not move beyond the start of intermediate wave (1) below 2,603.54.
Primary wave 5 may subdivide either as an impulse (more likely) or an ending diagonal (less likely). Intermediate wave (1) may be seen as either a five wave impulse or a three wave zigzag at lower time frames, and so at this stage primary wave 5 could be either an impulse or a diagonal.
Primary wave 5 at its end may be expected to exhibit reasonable weakness. At its end, it should exhibit a minimum of 4 months bearish divergence with the AD line (it may exhibit bearish divergence between price and RSI and Stochastics), and it may lack support from volume; it may not be possible to distinguish a weak fifth wave from a B wave.
TECHNICAL ANALYSIS
WEEKLY CHART
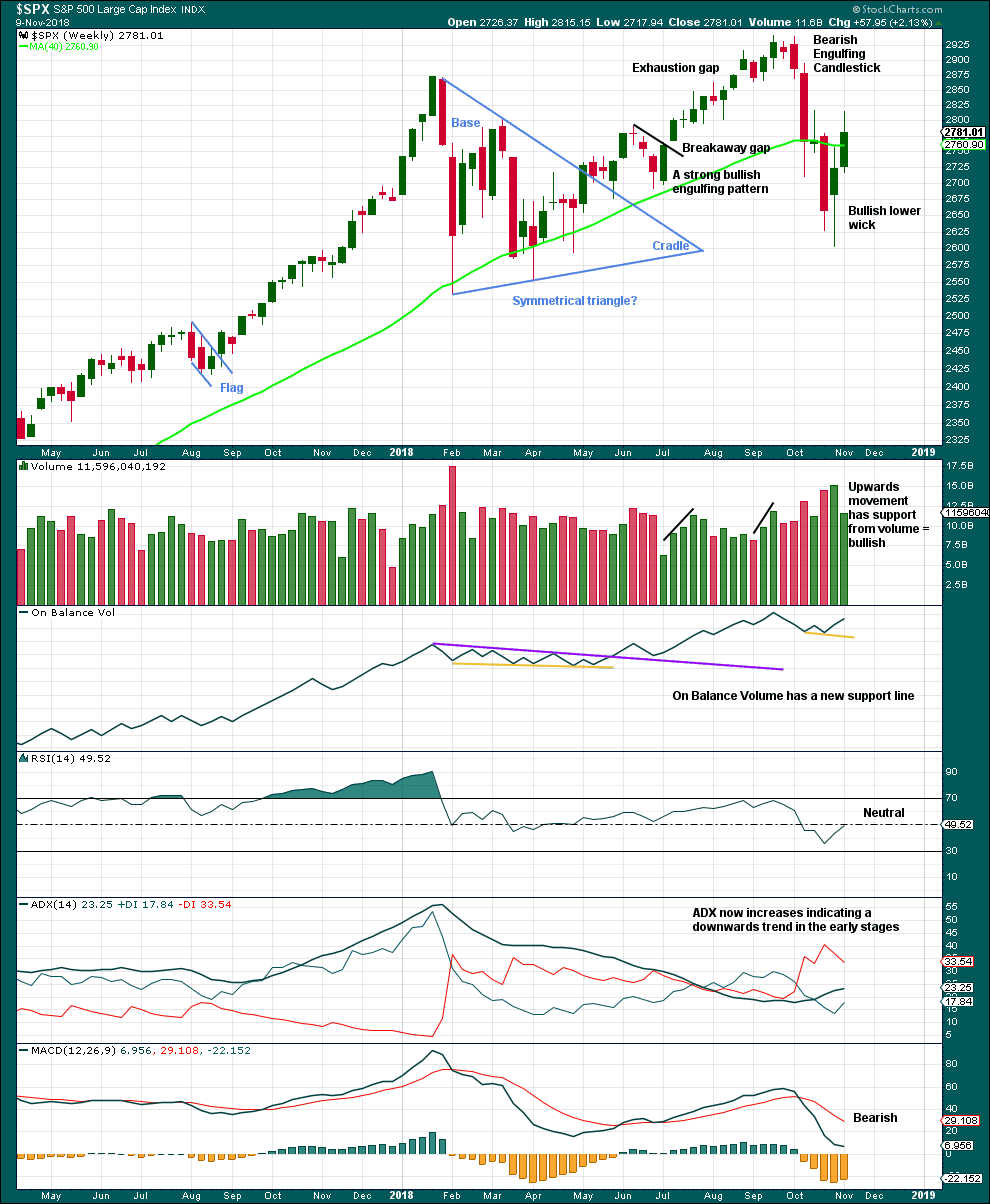
Click chart to enlarge. Chart courtesy of et=”_blank”>StockCharts.com.
Weakness in volume and a long upper wick suggest this upwards week may be a counter trend bounce. Overall, this supports the Elliott wave count.
DAILY CHART
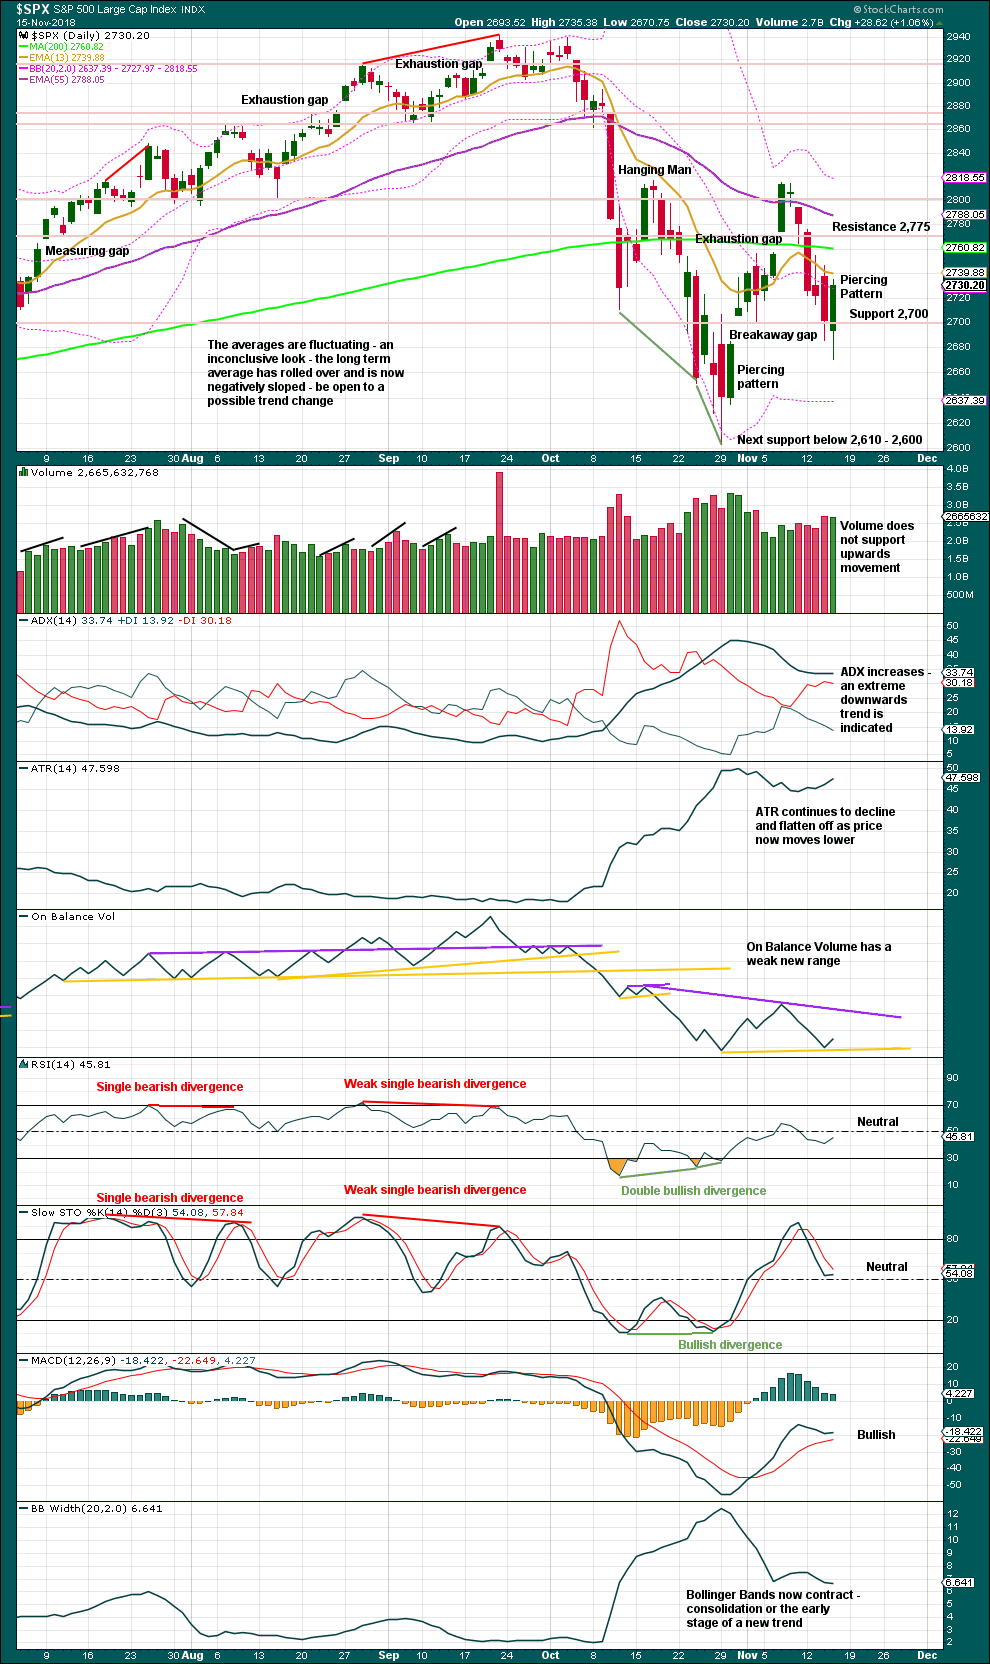
Click chart to enlarge. Chart courtesy of StockCharts.com.
Support about 2,700 has held. There is a Piercing pattern today that is a bullish candlestick reversal pattern. The long lower wick is also bullish. It looks like a low may now be in place at least for the short to mid term. Look for resistance above about 2,775 and above that about 2,800.
BREADTH – AD LINE
WEEKLY CHART
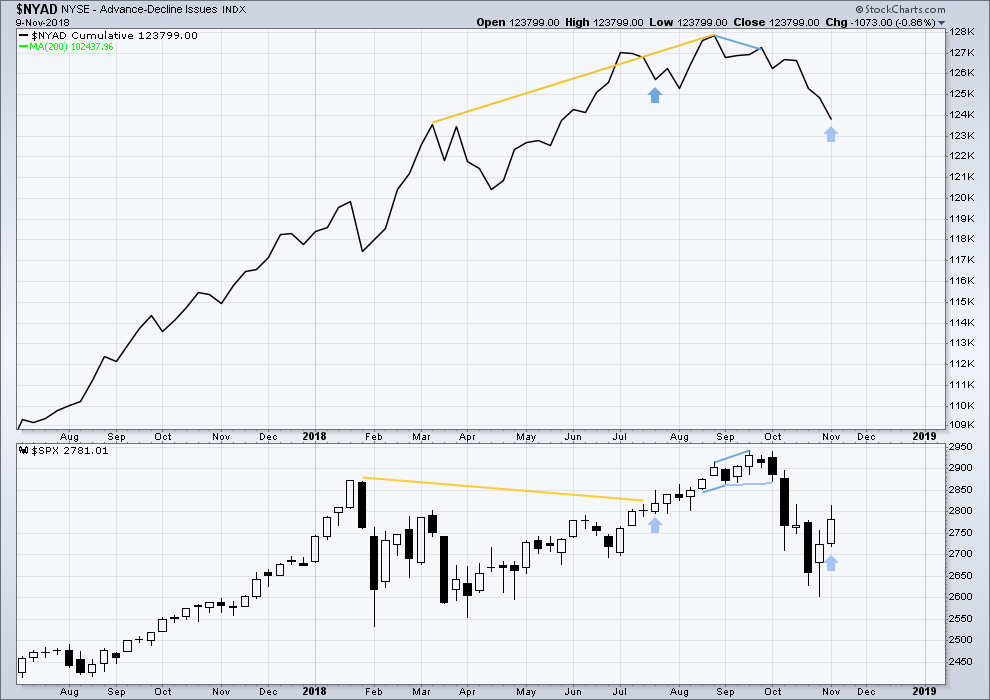
Click chart to enlarge. Chart courtesy of StockCharts.com. So that colour blind members are included, bearish signals
will be noted with blue and bullish signals with yellow.
Last week price moved higher, but the AD line moved lower. This divergence is bearish and supports the second alternate Elliott wave count.
However, noted on this chart, there is one other instance of the same single week bearish divergence that was not followed by a downwards week.
DAILY CHART
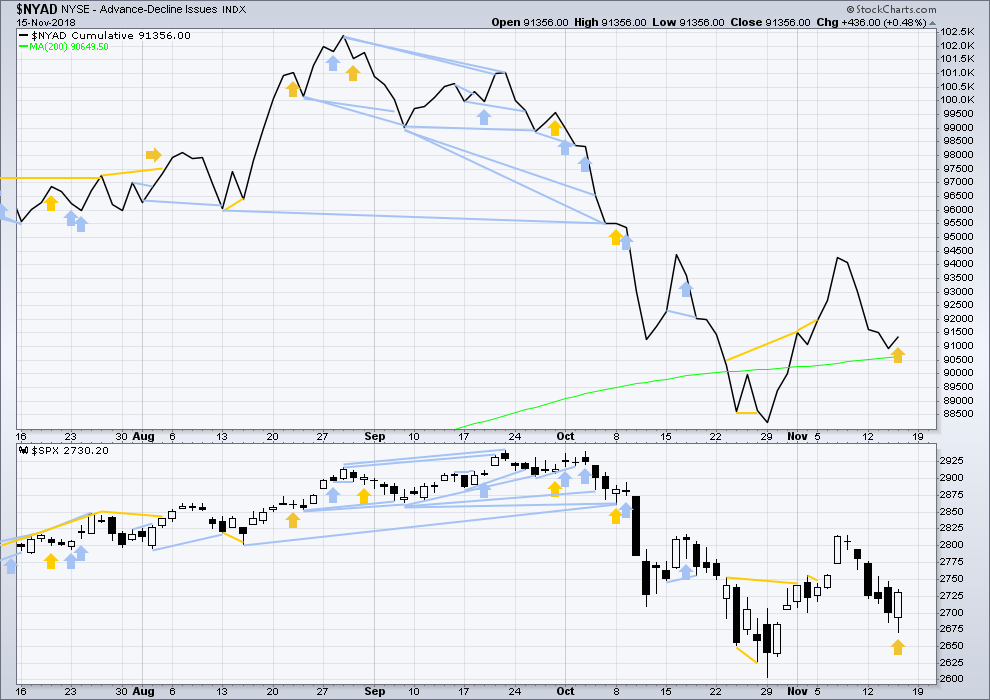
Click chart to enlarge. Chart courtesy of StockCharts.com. So that colour blind members are included, bearish signals
will be noted with blue and bullish signals with yellow.
There is normally 4-6 months divergence between price and market breadth prior to a full fledged bear market. This has been so for all major bear markets within the last 90 odd years. With no longer term divergence yet at this point, any decline in price should be expected to be a pullback within an ongoing bull market and not necessarily the start of a bear market. New all time highs from the AD line on the 29th of August means that the beginning of any bear market may be at the end of December 2018, but it may of course be a lot longer than that. My next expectation for the end of this bull market may now be October 2019.
Breadth should be read as a leading indicator.
Today price moved lower, but the AD line has moved higher. This divergence is bullish. Upwards movement within this session has support from rising market breadth.
VOLATILITY – INVERTED VIX CHART
WEEKLY CHART
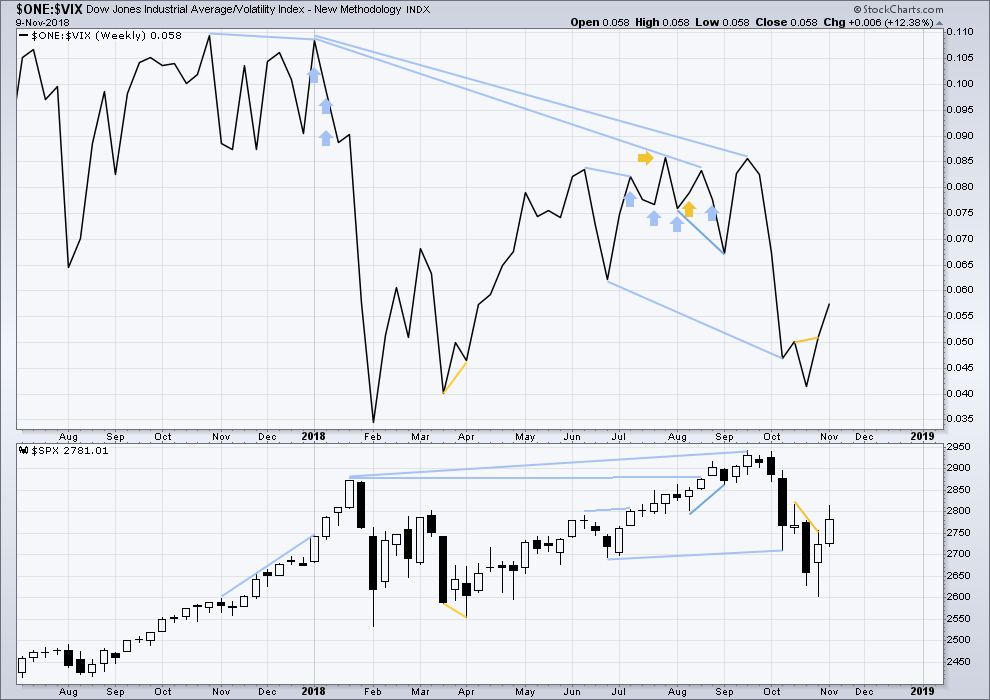
Click chart to enlarge. Chart courtesy of StockCharts.com. So that colour blind members are included, bearish signals
will be noted with blue and bullish signals with yellow.
Last week price moved higher with inverted VIX. The rise in price last week comes with a normal corresponding decline in VIX.
DAILY CHART
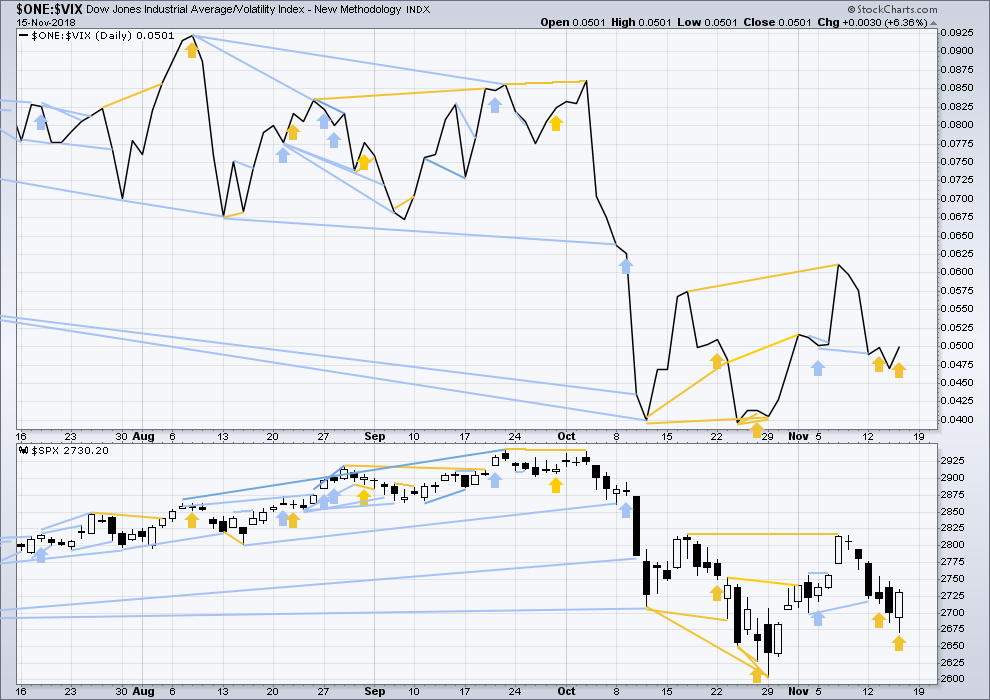
Click chart to enlarge. Chart courtesy of StockCharts.com. So that colour blind members are included, bearish signals
will be noted with blue and bullish signals with yellow.
Normally, volatility should decline as price moves higher and increase as price moves lower. This means that normally inverted VIX should move in the same direction as price.
Today price has moved lower, but inverted VIX has moved higher. This divergence is bullish. Upwards movement within this session has support from a normal corresponding decline in VIX.
DOW THEORY
The following lows need to be exceeded for Dow Theory to confirm the end of the bull market and a change to a bear market:
DJIA: 23,344.52.
DJT: 9,806.79.
S&P500: 2,532.69.
Nasdaq: 6,630.67.
Published @ 09:00 p.m. EST.
—
Careful risk management protects your trading account(s).
Follow my two Golden Rules:
1. Always trade with stops.
2. Risk only 1-5% of equity on any one trade.
Up and through those overlapped fibo’s…like to see new highs for the day before it’s over too! All markets pressing up. Sometimes 3:30 brings reversals….
Is it possible that the triangle from March was the beginning of a giant expanded flat and that we will retest the March low?
Like an enormous 3-3-5 starting in the beginning of the year. Would that conform to eliotwave guidelines? I know the triangle would need to be labeled as a three.
Of hand I think one issue with that as a model is that such a large in time correction doesn’t have a real matching I2 or P2 or whatever. It’s out of proportion I believe. Another point of view it is “yes it is possible”, but even if that happens re the price action you describe, that’s probably not the proper way to model the overall structure.
But I’m not an EW expert, which is why I’m here.
I know very little about ew but trying to learn. I can just imagine today being an ending diagonal going down to 2545ish and the whole structure from February looking like a 335 expanded flat. However, that from a novice so I ‘m sure it won’t happen;)
NDX at the 5 minute level showing a long (6+ hours) triangle type of structure (a “coil”). Entered from below. Still squeezing at the hourly tf.
Good morning everybody.
I’m going to tentatively label minuette (i) over, but it most certainly could continue lower. I’m labelling it over though because that’s a common pattern for the S&P; relatively brief and shallow second waves.
Everything remains the same. Next week looks like it may produce a green candlestick.
Did you mean to say, “minuette (ii) is over”?
Oh yes, I did. Thanks Rodney 🙂
Ah, so iii of iii action next week most likely!!!
Sweet.
Nope! 🙁
NDX continuing in a loooooong multi hour squeeze. And now SPX has joined it for the last 3 hours.
The markets are gonna blow…eventually. Up or down, that’s not so certain. More backing and filling after the recent lows is a definite possibility. But I think up is more likely here. This B/X needs to get moving.
IMHO, we just topped and C wave starts now or Sunday night.
SPX having trouble getting through two overlapped fibo levels at 2742-3. One is the 50% of the 6 day down move, the other is the 61.8% of the A wave down of the intermediate 4 from back in early Feb.
Good morning to all.
The first pattern listed in this day’s analysis is a triangle for Primary 4. It causes some concern for me. It is the hourly count that does not have a good look in my mind. Minute a is an extended 5 wave move taking about 40 hours to complete. Then Minute b takes an hour and Minute c about 3 hours. This completes Minor X. It just looks so out of proportion to me. So, Lara, if you could give some insight, I’d be appreciative. I wrested with how to label Minor X when we hit a lower low yesterday. That is why I thought we would be going to the lower target around 2640.
On the other hand, I am warming up to the Bullish Alternate Wave Count that shows Primary 4 as complete. I do take Verne’s statement very seriously that VIX looks completely different when Primary waves complete. But this bullish alternate is gaining credence in my mind the more I look at it especially in light of the monthly MACD having made a bearish crossover.
Well, just some musing for the morning.
I don’t have a problem with that count of the A/W down. Things aren’t always super clean at the lowest time frames, is my view.
I have virtually zero expectation that P4 is over, myself. Maybe I’ll consider and appropriately “worry” about that later in time when it appears a C/Y down is initiating and I’m launching positional shorts. A P4 “is very likely to be” beefy, in price AND time, and until there’s a real reason to doubt it will be, I don’t. Though I accept it is a possibility, and it’s nice to have it as an alternative roadmap.
Just my $0.02 on a slow Friday. I grabbed my daily profit close to the top this morning. Get a little long part way down…waiting for a clear bottom to triple up. Though since price is in a B/X…I expect a lot of churn and odd moves. This thing won’t go up cleanly IMO.
I rather like AMGN here for a multi-day to few week trade to the long side. Solid and perfect hit and turn off the 61.8% of the Apr-Oct up move. Polarity inversion in place on the daily chart. 5 minute trend is UP, one hour trend just this hour has moved from neutral to UP. Daily trend is still mild down. The hourly trend line is busted to the upside. The daily trend line is slightly overhead.
I sold puts at 185 for mid Dec. Not a recommendation, just something to consider.
In bull markets pivot battles are generally won by the bulls. The opposite might be true in bear markets. Be careful out there….l
Pole position!
It seems to me there are two pole positions possible.
First is the auto racing pole position producing first out of the gate.
The other is the type of pole position ‘Stormy’ Daniels uses to entertain.
Which are you claiming? I’ll remain Omega.
It is late. Give me a break on this raunchy mind. I am too tired to comment or ask my questions about the US equity markets. See you all tomorrow after some rest. Sleep well my friends.
Rodney Rodney. I’m afraid I have no pole dancing skills.
My engines are runnin’ friend.
BTW, I was walking through North Beach SF on Sat. night two weeks ago to catch my favorite bluesman Daniel Castro, and walked by what used to be the ChiChi Club (with regular live music acts) and before that in the dim times was apparently a brothel or so I’m told (1940’s-50’s). Now it’s some kind of modern strip club. Anyway, largely advertised was “Stormy Daniels!”. I looked at the bouncer outside and said incredulously “really???”. Yea!! I kept on walking and caught a fantastic set by Daniel Castro on guitar…