A little more downwards movement towards the target has unfolded as expected.
Price remains within the narrow channel on the hourly chart.
Summary: Downwards movement may now be over, or it could continue for just another one or two days. If it does continue lower, a possible target would be about 2,646. Use the channel on the hourly chart. If the channel is breached by upwards movement, then have some confidence a low is in place.
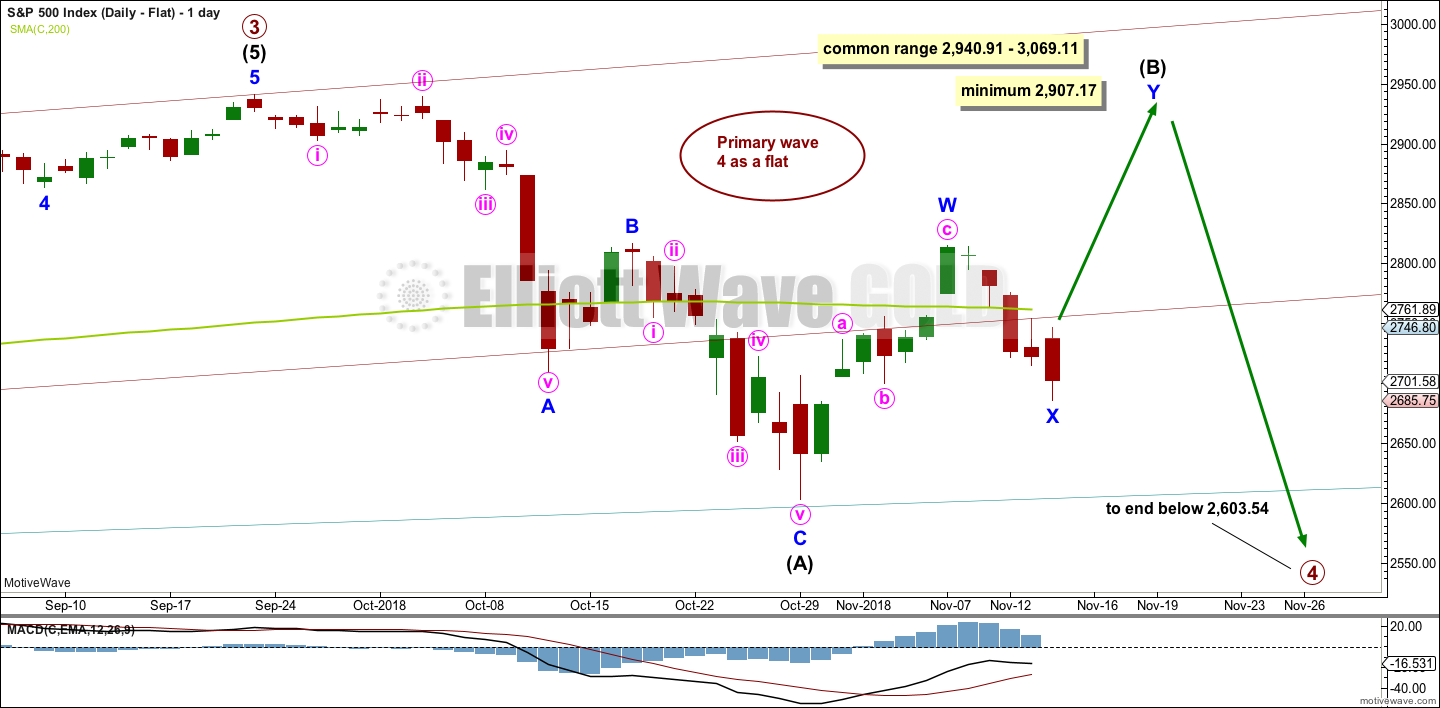
Five daily charts today look at five different structures for primary wave 4, in order of probability (roughly): triangle, combination, zigzag, double zigzag, and flat.
A new bullish weekly chart is added to today’s analysis.
New updates to this analysis are in bold.
The biggest picture, Grand Super Cycle analysis, is here.
Last published monthly chart is here, video is here.
ELLIOTT WAVE COUNT
WEEKLY CHART
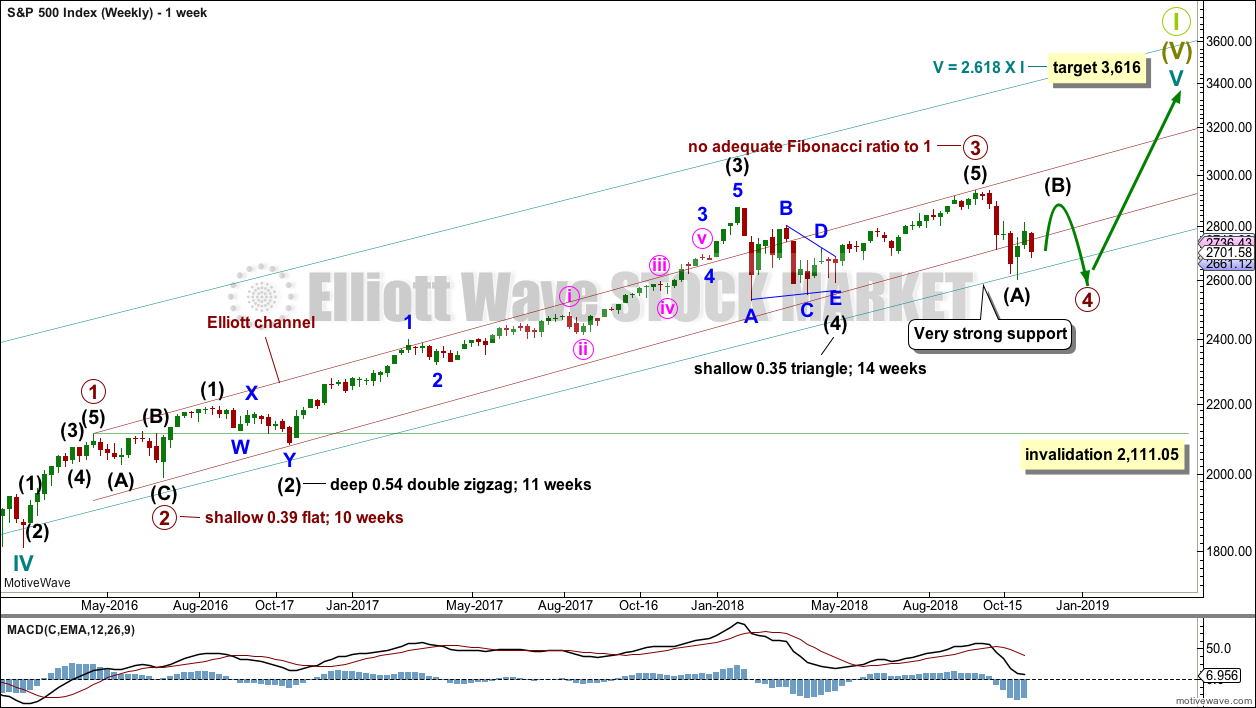
Cycle wave V must complete as a five structure, which should look clear at the weekly chart level and also now at the monthly chart level. It may only be an impulse or ending diagonal. It is clear it is an impulse.
Cycle wave V has passed equality in length with cycle wave I, and 1.618 the length of cycle wave I. The next Fibonacci ratio is used to calculate a target. When primary wave 4 is complete and the starting point for primary wave 5 is known, then the final target may also be calculated at primary degree. At that stage, there may be two targets, or the final target may widen to a small zone.
Within cycle wave V, the third waves at all degrees may only subdivide as impulses.
Within primary wave 3, there is perfect alternation and excellent proportion between intermediate waves (2) and (4).
The maroon channel is drawn about primary degree waves. The first trend line is drawn from the ends of primary waves 1 to 3, then a parallel copy is placed upon the low of primary wave 2. The overshoot of the upper edge of this channel by the end of intermediate wave (3) looks typical. For the S&P, its third waves are usually the strongest portion of an impulse; they often exhibit enough strength to overshoot channels.
Primary wave 4 now has an overshoot on the lower edge of the channel. This is acceptable; fourth waves are not always neatly contained within channels drawn using this technique.
Primary wave 4 may find very strong support about the lower edge of the teal channel, and it looks like this is from where price may be bouncing. This channel is copied over from the monthly chart and contains the entire bull market since its beginning in March 2009. While Super Cycle wave (V) is incomplete, this channel should not be breached at the weekly chart level.
Primary wave 4 may not move into primary wave 1 price territory below 2,111.05.
At this stage, the expectation is for the final target to be met in October 2019. If price gets up to this target and either the structure is incomplete or price keeps rising through it, then a new higher target would be calculated.
At this stage, the various possible structures for primary wave 4 will be published as separate daily charts, presented in order of probability.
DAILY CHART – TRIANGLE
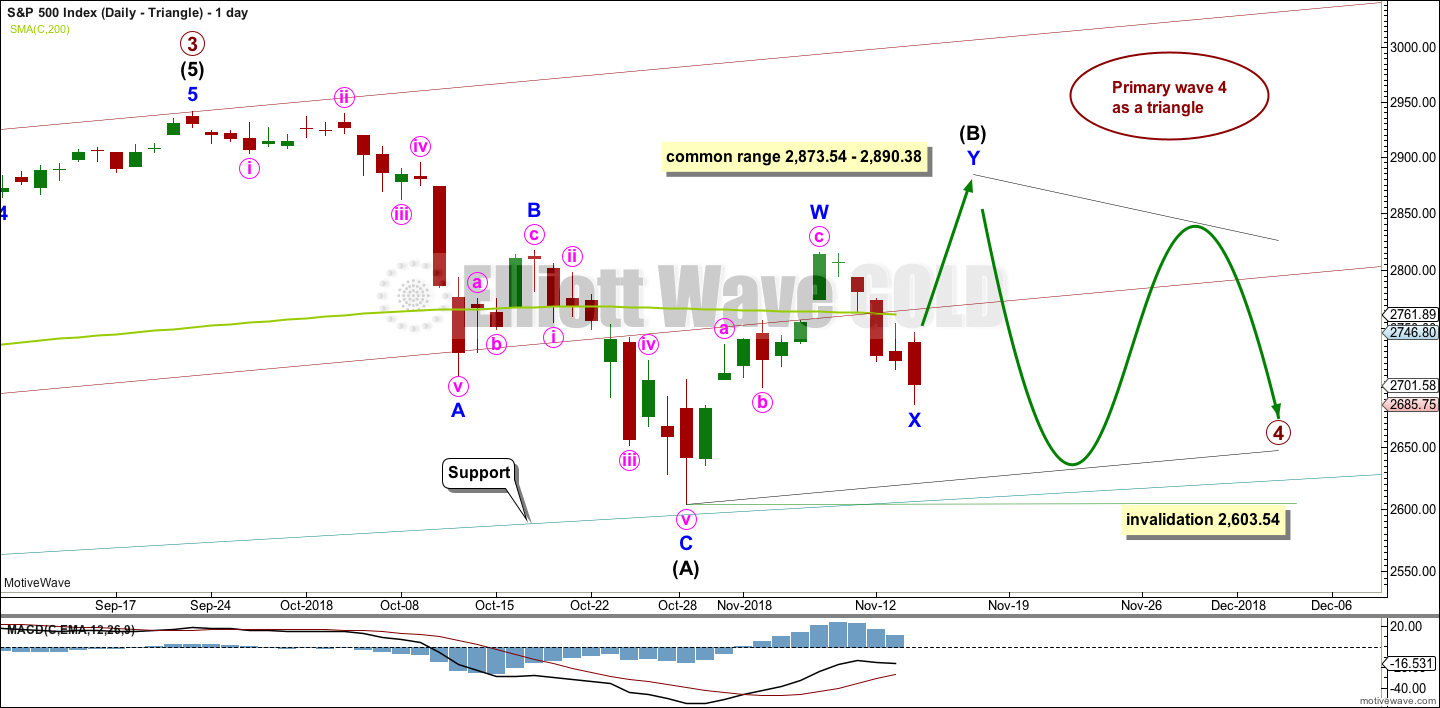
If primary wave 4 unfolds as a triangle, it would have perfect alternation with the regular flat correction of primary wave 2. It would also continue to find support about the lower edge of the teal trend channel. Triangles are fairly common structures for fourth waves. For these reasons this wave count may have a slightly higher probability than the other daily charts.
If primary wave 4 is unfolding as a triangle, then within it intermediate wave (B) would most likely be incomplete. To label intermediate wave (B) over at the last swing high is possible, but it would look too shallow for a normal looking Elliott wave triangle.
Triangle sub-waves are often about 0.8 to 0.85 the length of the prior wave. This gives a target range for intermediate wave (B).
One triangle sub-wave may subdivide as a multiple; this is most often wave C, but it may also be wave B. Intermediate wave (B) may be unfolding higher as a double zigzag.
There is no upper invalidation point for this wave count. Intermediate wave (B) may make a new high above the start of intermediate wave (A) as in a running triangle.
Within the triangle, intermediate wave (C) may not move beyond the end of intermediate wave (A) below 2,603.54.
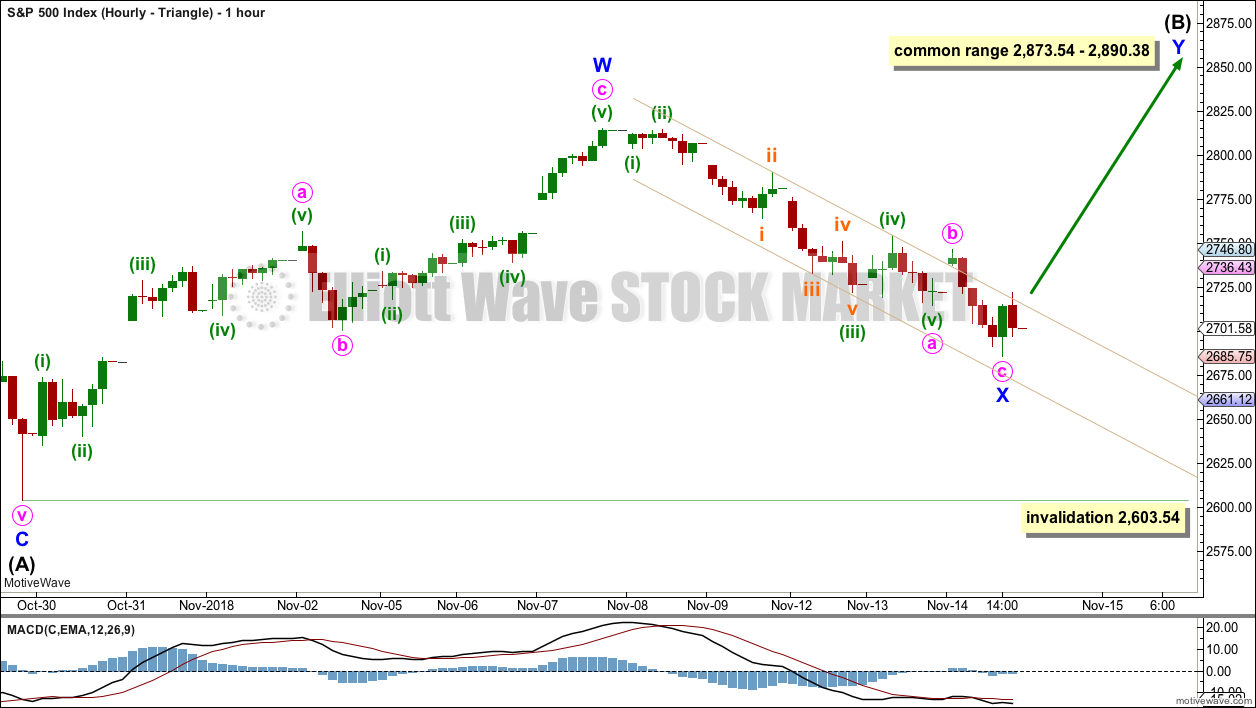
HOURLY CHART – TRIANGLE
Intermediate wave (C) may not move beyond the end of intermediate wave (A). Now that intermediate wave (A) is over, price may not make a new low below its end at 2,603.54.
Intermediate wave (B) may be an incomplete double zigzag. Within the double zigzag, minor wave X may today be a complete single zigzag. Within minor wave X, minute wave c is just 0.86 points short of 0.618 the length of minute wave a.
If minute wave c continues lower, then it would reach equality in length with minute wave a at 2,647. This would be a reasonable target for a low if price continues to fall tomorrow.
While price remains within the narrow best fit channel, allow for the possibility that tomorrow may continue with downwards movement. The bottom line for this hourly wave count is the channel needs to be breached for any confidence that a low is in place.
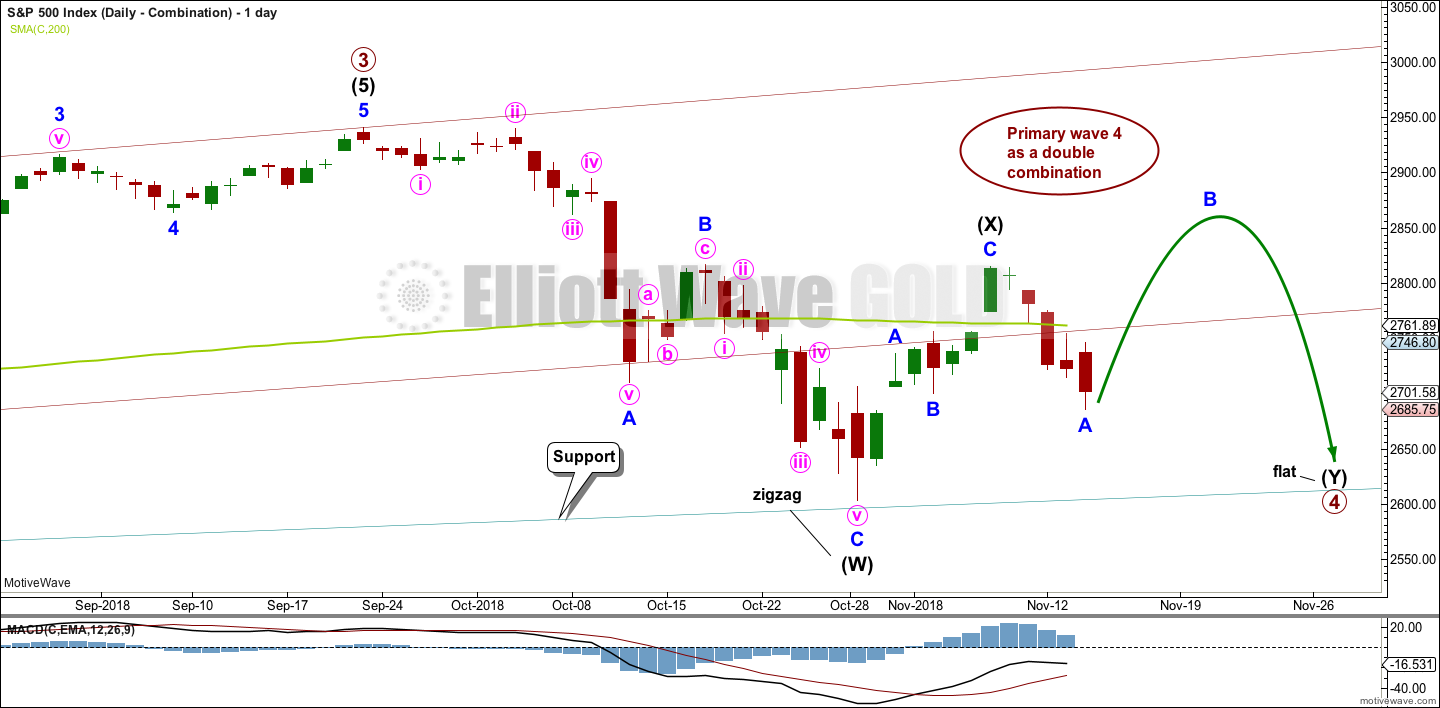
DAILY CHART – COMBINATION
This wave count is judged to have only a very slightly lower probability than the triangle.
Primary wave 4 may be unfolding as a double combination. The first structure in the double may be a complete zigzag labelled intermediate wave (W). The double may be joined by a three in the opposite direction labelled intermediate wave (X). Intermediate wave (X) may be complete as a single zigzag; it is deep at 0.63 the length of intermediate wave (W), which looks reasonable.
Intermediate wave (Y) would most likely be a flat correction, which should subdivide 3-3-5. At its end, it may still find strong support about the lower edge of the teal trend channel.
At the hourly chart level, minor wave A may be a complete zigzag, in exactly the same way as minor wave X on the hourly chart published above. The subdivisions, target and channel would all be the same.
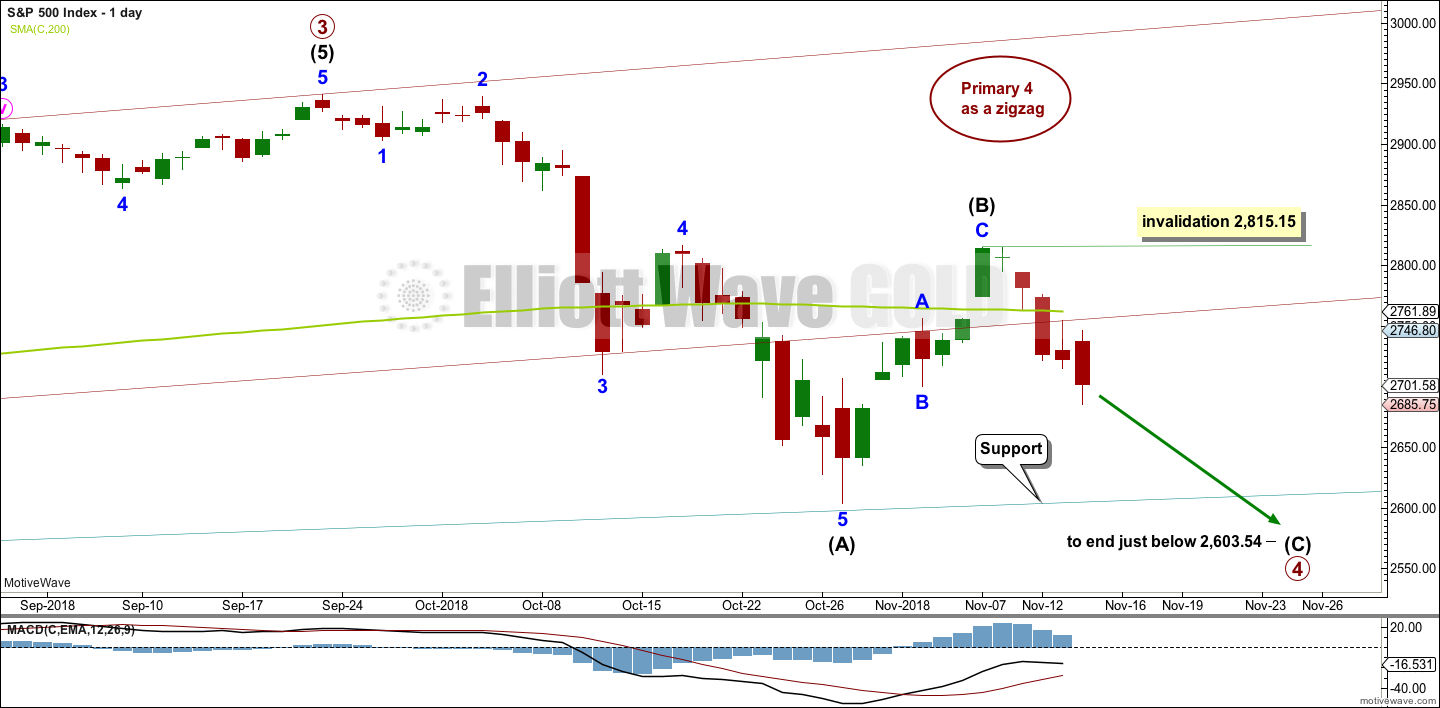
DAILY CHART – ZIGZAG
Primary wave 4 may be unfolding as a single zigzag, which is the most common type of corrective structure.
Within the zigzag, intermediate wave (B) may now be a complete structure, ending close to the 0.618 Fibonacci ratio of intermediate wave (A).
Intermediate wave (C) may now unfold lower as a five wave structure. Intermediate wave (C) would be very likely to end at least slightly below the end of intermediate wave (A) at 2,603.54 to avoid a truncation. It may end about support at 2,600.
This wave count would expect a fairly large overshoot of the teal trend channel. This reduces the probability of this wave count.
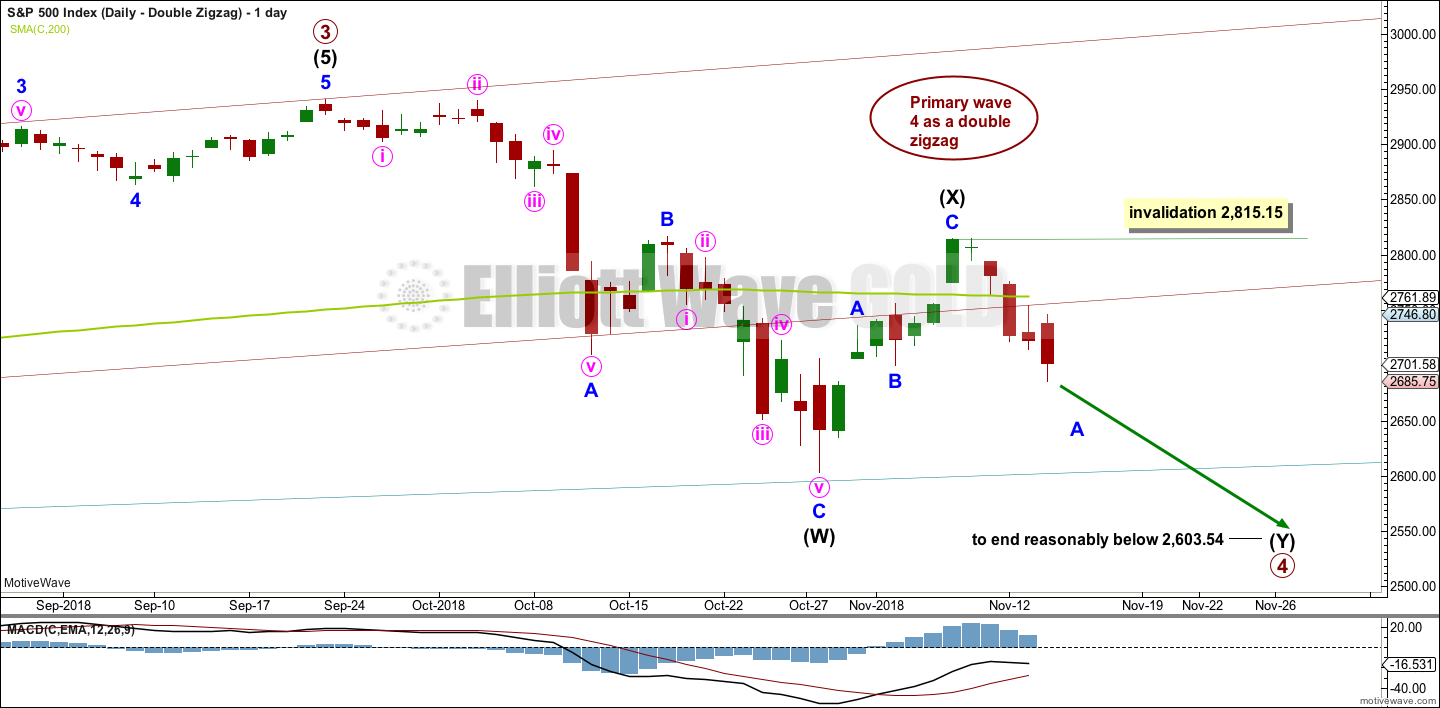
DAILY CHART – DOUBLE ZIGZAG
Primary wave 4 may also be unfolding as a double zigzag.
The first zigzag in the double may be complete, labelled intermediate wave (W). The double may joined by a complete three in the opposite direction, a zigzag labelled intermediate wave (X).
The second zigzag in the double may have begun. It is labelled intermediate wave (Y). Within intermediate wave (Y), minor wave B may not move beyond the start of minor wave A above 2,815.15.
The purpose of a second zigzag in a double is to deepen the correction when the first zigzag does not move price deep enough. To achieve this purpose intermediate wave (Y) should be expected to end reasonably below the end of intermediate wave (W) at 2,603.54. This would expect a very large overshoot of the teal trend channel; for this reason, this wave count is judged to have the lowest probability.
DAILY CHART – FLAT
Primary wave 2 was a regular flat correction. If primary wave 4 unfolds as a flat correction, then there would be no alternation in structure between the two corrections; for this reason, this wave count is judged to have a low probability.
However, alternation is a guideline, not a rule, and it is not always seen. This wave count is possible.
If primary wave 4 is a flat correction, then within it intermediate wave (B) must move higher to retrace a minimum 0.9 length of intermediate wave (A).
When intermediate wave (B) is complete, then intermediate wave (C) should move below the end of intermediate wave (A) at 2,603.54 to avoid a truncation. This would expect a reasonable overshoot of the teal trend line, which further reduces the probability of this wave count.
BULLISH ALTERNATE ELLIOTT WAVE COUNT
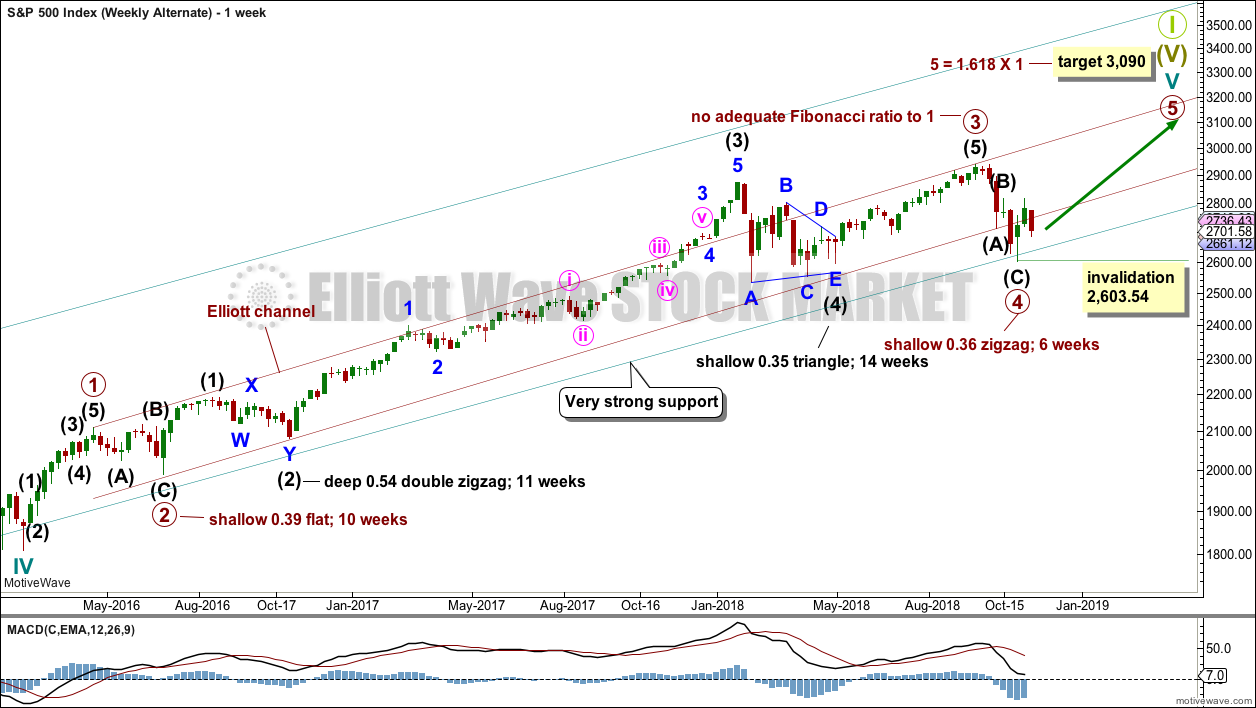
WEEKLY CHART
It is possible that primary wave 4 could be over as a relatively quick zigzag, ending about support at the lower edge of the teal channel.
The proportion between primary waves 2 and 4 is reasonable. Flat corrections tend to be longer lasting structures than zigzags. There would be perfect alternation in structure and inadequate alternation in depth. This is acceptable.
This wave count has the right look at the monthly chart level.
If primary wave 5 ends at or after the end of December 2018 and the AD line fails to make new all time highs, there would then be the minimum required four months of bearish divergence between price and the AD line. If this happens, then the conditions for the end of this bull market would be in place.
A new target is calculated for primary wave 5 to end. If primary wave 5 were to be only equal in length with primary wave 1, then it would be truncated. This target would be unlikely as then there could be no bearish divergence with the AD line. The next Fibonacci ratio in the sequence is used to calculate a target for primary wave 5.
Within primary wave 5, no second wave correction may move beyond the start of its first wave below 2,603.54.
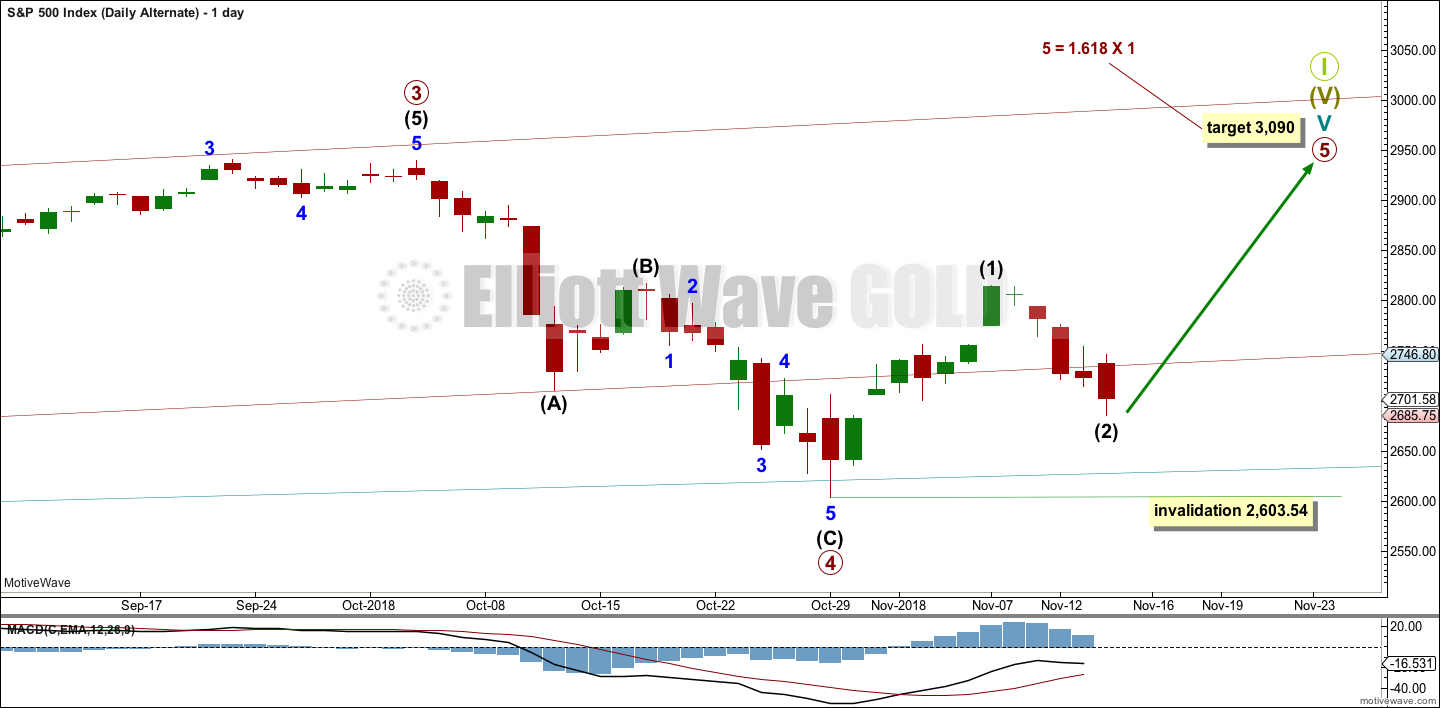
DAILY CHART
The subdivisions of primary wave 4 are seen in exactly the same way as most of the charts above except the degree of labelling is just moved up one degree.
Within primary wave 5, intermediate wave (1) may be over. Intermediate wave (2) may not move beyond the start of intermediate wave (1) below 2,603.54.
TECHNICAL ANALYSIS
WEEKLY CHART
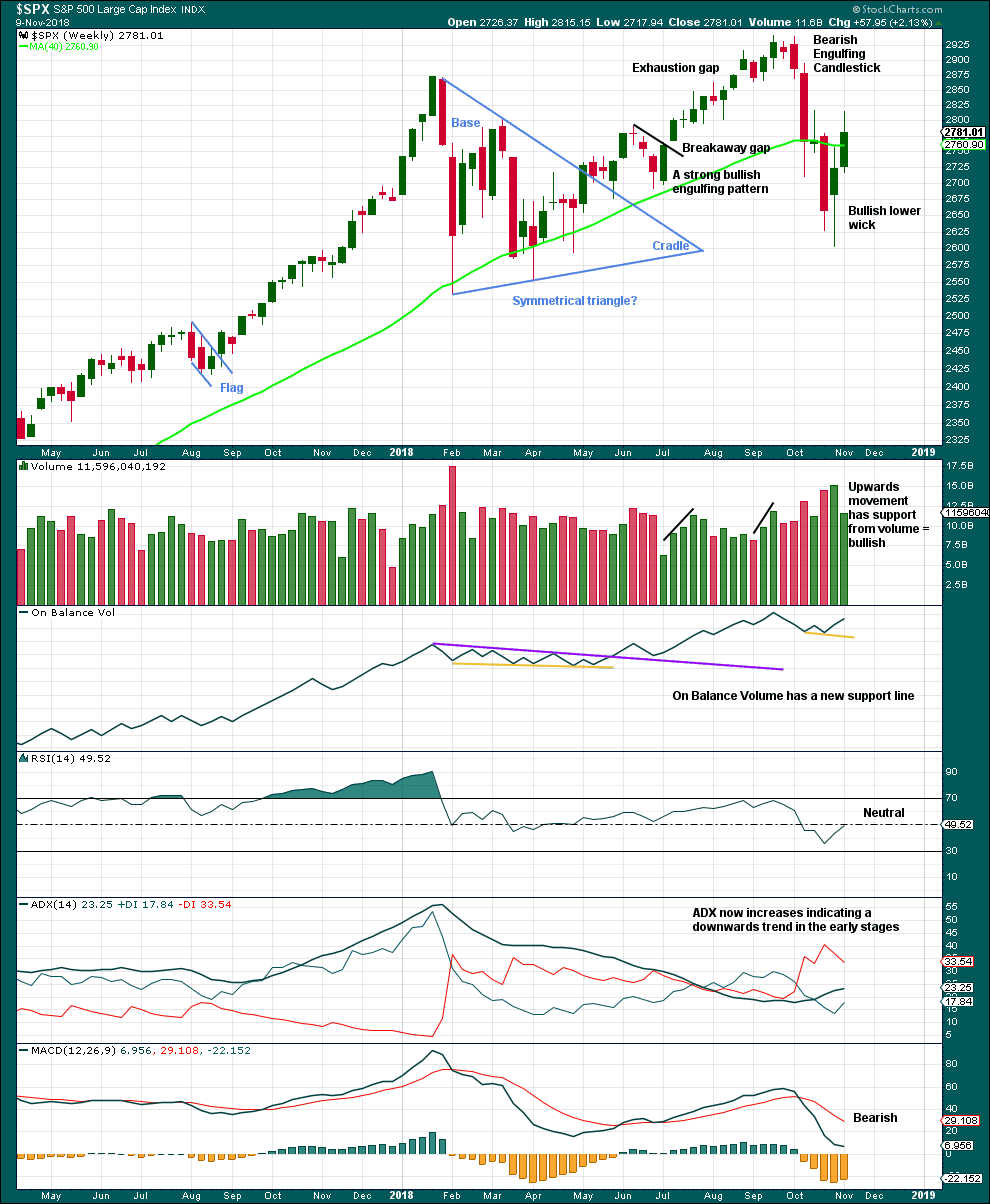
Click chart to enlarge. Chart courtesy of et=”_blank”>StockCharts.com.
Weakness in volume and a long upper wick suggest this upwards week may be a counter trend bounce. Overall, this supports the Elliott wave count.
DAILY CHART
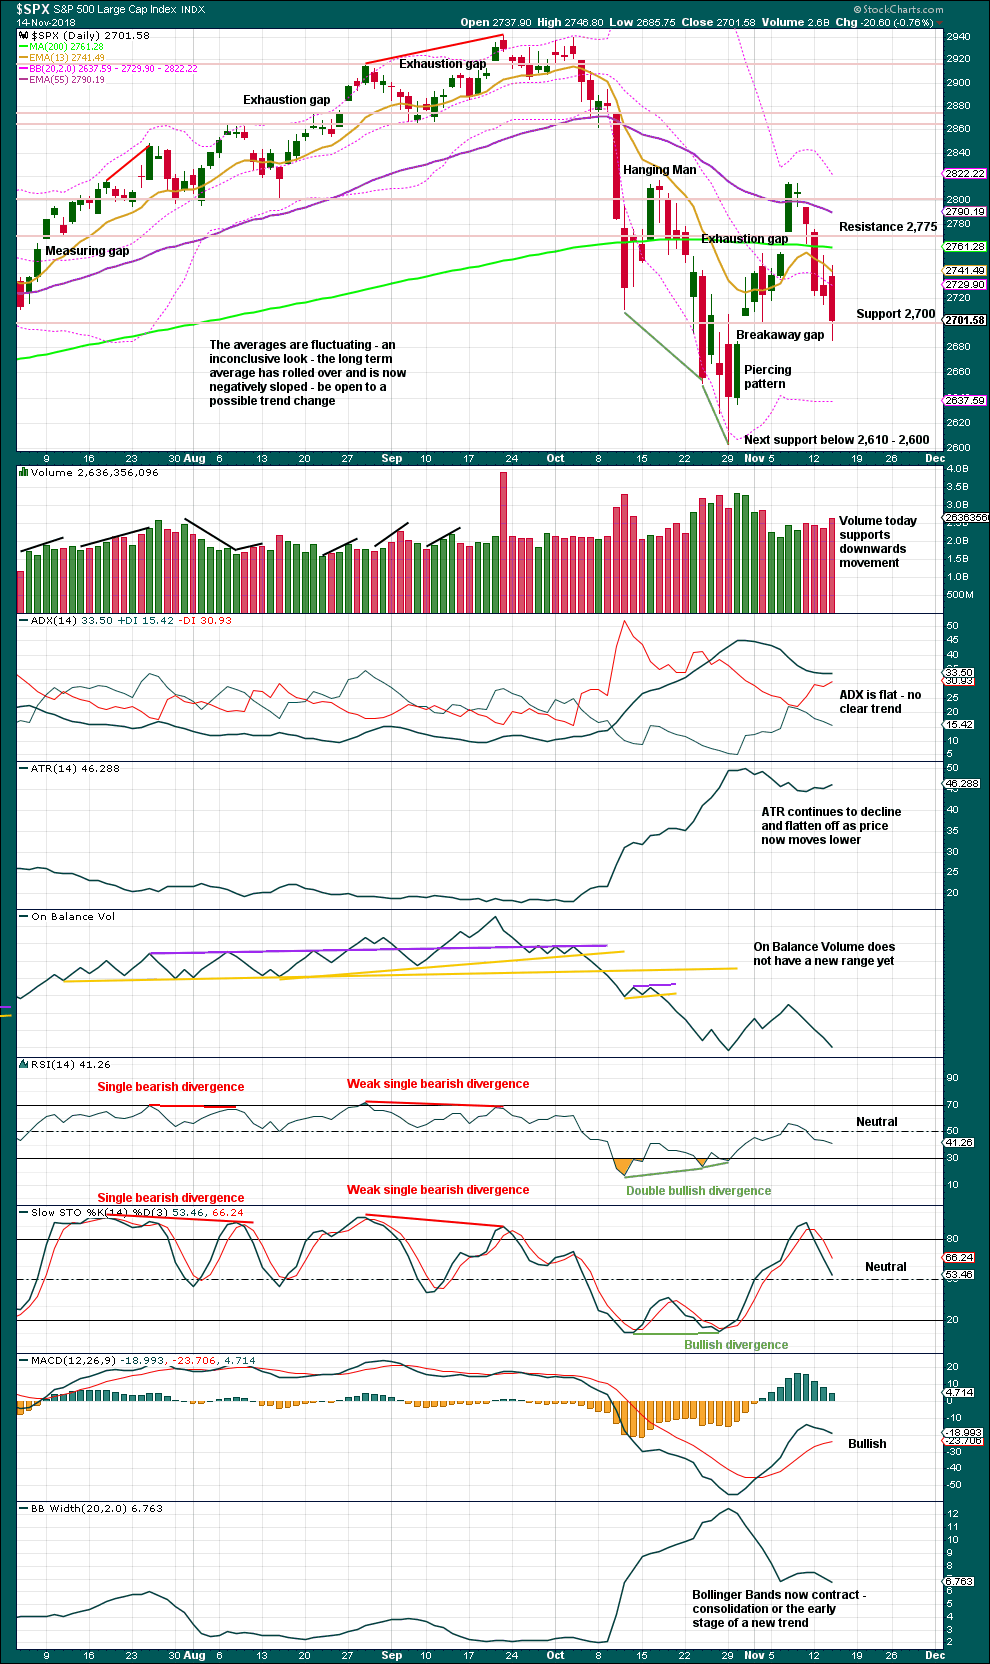
Click chart to enlarge. Chart courtesy of StockCharts.com.
The last gap is now closed, so it should correctly be now labelled an exhaustion gap.
The gap below is still open and may provide support. There is still strong support about 2,700.
If price can break below 2,700, then next support is about 2,600. Price failed to close below support today.
BREADTH – AD LINE
WEEKLY CHART
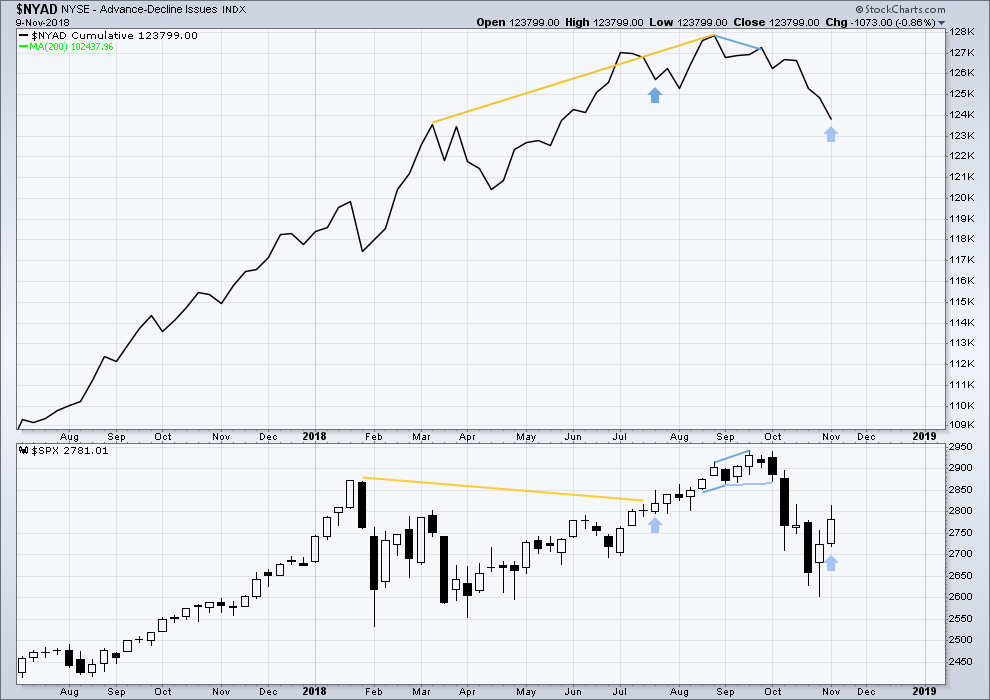
Click chart to enlarge. Chart courtesy of StockCharts.com. So that colour blind members are included, bearish signals
will be noted with blue and bullish signals with yellow.
Last week price moved higher, but the AD line moved lower. This divergence is bearish and supports the second alternate Elliott wave count.
However, noted on this chart, there is one other instance of the same single week bearish divergence that was not followed by a downwards week.
DAILY CHART
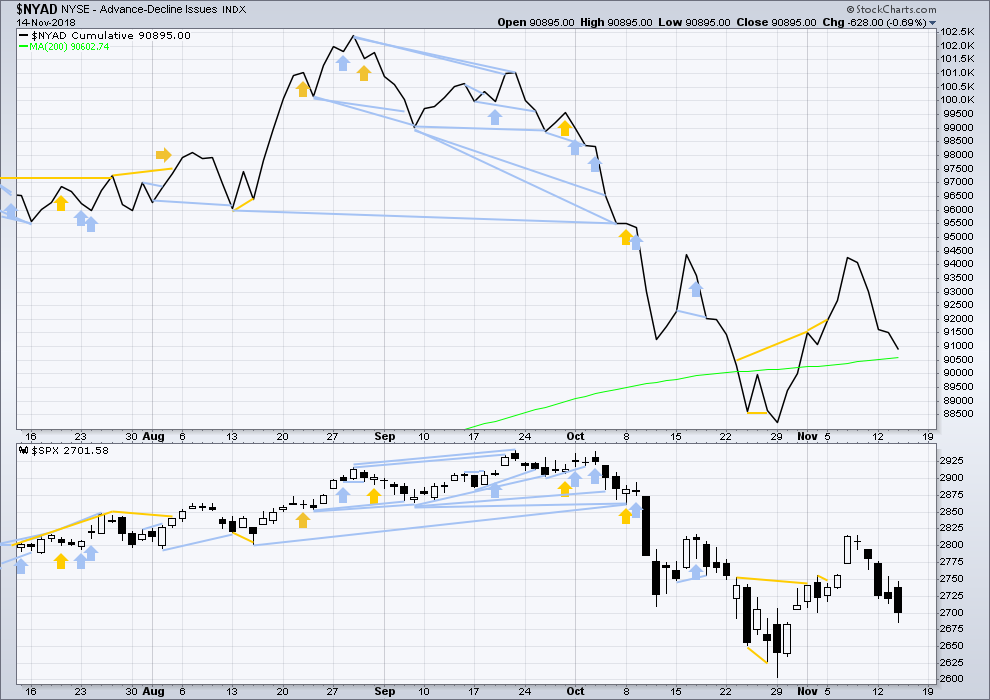
Click chart to enlarge. Chart courtesy of StockCharts.com. So that colour blind members are included, bearish signals
will be noted with blue and bullish signals with yellow.
There is normally 4-6 months divergence between price and market breadth prior to a full fledged bear market. This has been so for all major bear markets within the last 90 odd years. With no longer term divergence yet at this point, any decline in price should be expected to be a pullback within an ongoing bull market and not necessarily the start of a bear market. New all time highs from the AD line on the 29th of August means that the beginning of any bear market may be at the end of December 2018, but it may of course be a lot longer than that. My next expectation for the end of this bull market may now be October 2019.
Breadth should be read as a leading indicator.
Downwards movement today has support from falling market breadth. There is no short-term divergence. The AD line is not falling any faster than price.
VOLATILITY – INVERTED VIX CHART
WEEKLY CHART
Click chart to enlarge. Chart courtesy of StockCharts.com. So that colour blind members are included, bearish signals
will be noted with blue and bullish signals with yellow.
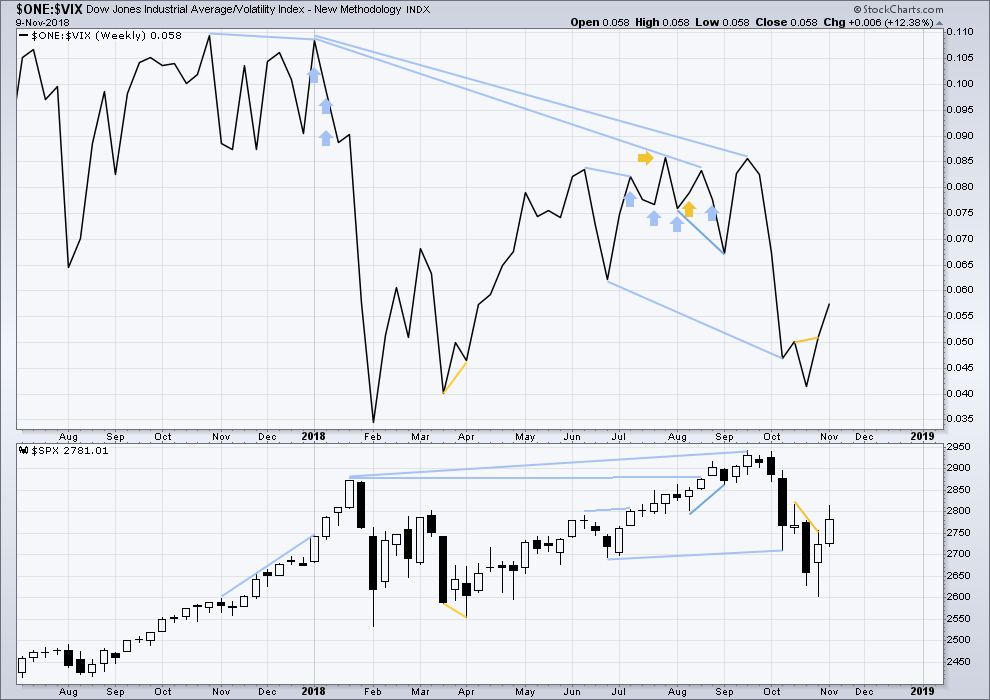
Last week price moved higher with inverted VIX. The rise in price last week comes with a normal corresponding decline in VIX.
DAILY CHART
Click chart to enlarge. Chart courtesy of StockCharts.com. So that colour blind members are included, bearish signals
will be noted with blue and bullish signals with yellow.
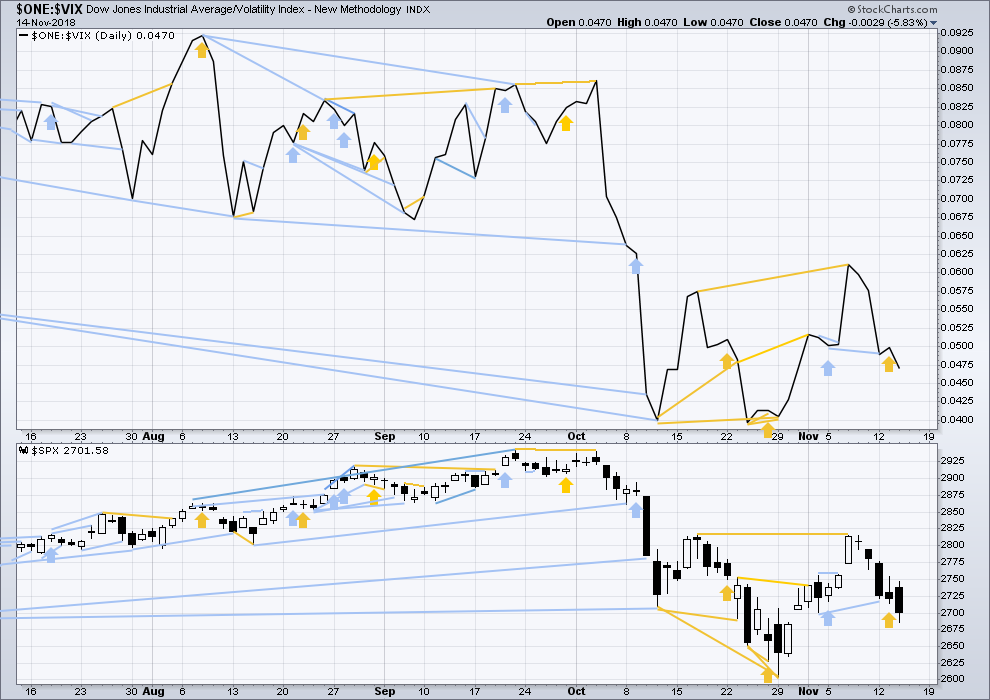
Normally, volatility should decline as price moves higher and increase as price moves lower. This means that normally inverted VIX should move in the same direction as price.
Both price and inverted VIX moved lower today. There is no new divergence.
DOW THEORY
The following lows need to be exceeded for Dow Theory to confirm the end of the bull market and a change to a bear market:
DJIA: 23,344.52.
DJT: 9,806.79.
S&P500: 2,532.69.
Nasdaq: 6,630.67.
Published @ 07:40 p.m. EST.
—
Careful risk management protects your trading account(s).
Follow my two Golden Rules:
1. Always trade with stops.
2. Risk only 1-5% of equity on any one trade.

This was the summary from yesterday:
Summary: A short-term target for downwards movement to end is about 2,672.
We tagged 2670.75 today and reversed hard. I actually bought more SPY commons when I got the 2672 alert. What a move!
anybody in NG?
its like playing with fire… pun
Just looking now at /NG. Wow!
Beware the exponential rise in price…
Similar on the monthly to Feb of ’14. Followed by a year of two of sell off…
Good morning everybody.
It looks like the downwards wave has ended, now on up to new highs above 2,815.15.
The channel breach, long lower wick and probably a bullish candlestick reversal pattern today supports this idea.
Such pleasant music to my ears you sing, not to mention to my accounts. Thanks.
I just made a mental note today that that monthly MACD for SPX has made a bearish crossover. Perhaps the run to new ATH’s, when it finally arrives, will not be confirmed.
It’s a good thing you can’t actually hear me singing then.
My singing is like my dancing. Rather…. cabbage like? Anyway, no rhythm nor tune.
How did you know I love cabbage? I have at least one per week and often more. Cabbage is like a wonder vegetable.
I’m now having memories of a Uni pub crawl many years ago. Some guy took his pet cabbage along. On a leash.
The cabbage did not fare well. But then, nor did it’s owner.
Probably not the best thing to do to a green leafy vegetable 🙂 🙂 🙂
May be a fair amount of backing/filling before the Y gets moving with high momentum. Even a retest tomorrow of the 61.8% at 2684 wouldn’t surprise me.
WOW, this is a strong bounce on the hourly level. Up 50 handles off the morning lows. Bid/ask spreads are getting pretty wide.
SPX channel busted to the upside, as is NDX.
I do believe the multi-day sell off is probably over for now.
Yep. Sure does look like it.
You do know, don’t you, that I made the comment earlier this morning about the 2647 target knowing full well that as soon as I did, the market would work to prove me wrong. As I am long, that was the goal!
Out of the channel gives some confidence. The next hurdle is the 200 day moving average somewhere above 2750. We need to break it, test it from above and then move to a higher high. That will give much more confidence to me. In the middle of corrective waves strange things seem to happen more often.
That’s POWER Rodney! You’ve got more juice than the banksters!
I am definitely NOT bullish here for the longer term. My view is that continued P4 “oscillations” are highly likely to continue for the next 4-8 weeks anyway. While a P4 could be very short in time, that’s not the nominal behavior. So…up…then down again. And maybe several times.
I am in full agreement that P4 is not over and whipsawing most likely will occur. I want to catch part of this upward move and then if there are any more waves I want to trade before we come to the end of P4. Trading corrective waves is not my primary style.
All that being said, I will use trailing stops on these long positions because a surprise could happen to the upside giving us a nice Santa Claus rally. Jesse Livermore said something like, the most common mistake of traders is exiting winning positions to early.
I gotta go. Much to do and I want to be outside to enjoy our sunshine and cool temps. Have a great day everyone.
Do enjoy it. The smoke in the air here in SF is at the “unhealthy” level, the eye sting outside, and even inside you can feel it in the lungs. Nasty.
After the 200 day ma, the next bigger obstacle is the 2820 region which is the breakout for the possible inverse head and shoulders pattern. Don’t put too much weight on this pattern, however. It is a big pattern, time wise, for such a smaller time frame down trend. It is somewhat out of proportion. No matter the pattern or not being correct, the 2820 region will likely produce resistance to upward price movement.
I like the set up in AMAT. At about 1/2 its value from seven months ago. Tagged and scribbled a bit on the 61.8. Inverse H/S structure close to complete, which also means polarity inversion about complete at this daily tf. Sharpest down trend line busted. Just a trade idea, not a recommendation…
…and either or both danger and opportunity: earnings due out after market today or perhaps pre-market tomorrow.
It seems to me we are headed for the Minor X target of 2647 Lara has given for the triangle.
All I know is until price breaks out of that channel…it’s in the channel, and the channel heads down. Tagged the lower line this morning, getting close to the upper…we’ll see!
if NDX can’t hold the 78.6% at 6712, it’s probably going to the 100% at 6575.
NDX now in several hours of squeeze, has bounced off the 78.6%, and is testing the underside of the 61.8%, close to the upper trend line. If that line breaks to the upside…I think it’s game on to the long side for awhile.
Okay so please end the hysteria…
Scientists Admit Errors in High-Profile Ocean Warming Study
https://gvwire.com/2018/11/14/scientists-admit-errors-in-high-profile-ocean-warming-study/
“What went wrong with the study?
The scientists apparently aren’t that good at math.”
You can’t make this {Blank} Up! uh… stuff up. Unbelievable!!! I think this is all intentional … The headlines created the hysteria… the corrections just don’t get noticed… It’s all part of the brainwashing effect!
This NOT the exception, and Keeling is being dishonest. They knew they were fudging. All you have to do is READ their stat work-up. NATURE is no longer the respected publication it used to be. Both they and the peer reviewers failed to do due diligence.
I believe the only hysterical people are the people who just lost everything in CA wildfires, largest in history. And the people in Florida who lost everything, in a “once every 500 year” super storm. And the people in the Carolinas who lost everything in massive flooding from a “once every 500 years” super storm. And the peanut farmers in Georgia who were destroyed for a 4th straight year by massive storms. And the families of those who perished in the last year in killing heats waves all around the world. Lots of hysterical people I am afraid.
I don’t know about how to end their hysteria. Avoiding yours and mine is strongly advised.
We are getting snow in NY/NJ/PA today… Yea… right warming!
Those CA fires are abnormal. When have you ever seen a normal house fire incinerate porcelain and melt steel?
The gullibility of the American public is truly scary.
Lay it on us. Faked, like the moon landings? Or, started and fed by left wing eco-nazi’s who used magnesium to help stoke it to higher temps? Pray tell! I want to know…
There are plant species in California which require fire to germinate.
Lots of them in Australia too.
– just a somewhat useless piece of info from a botanist (that’s me)
Okay guys, I think I asked all to please leave this topic alone? Just… about two days ago?
I’m going to delete any further comments in this sub thread.
Because it usually ends up with people saying things that don’t look like how you should speak to a beloved Grandmother.
Thank you all for your assistance here.
That is correct, and in well managed forests, fires are “allowed” and sometimes controlled burns are executed, for this and other “health of the forest” and “reducing risk of mega-fire” reasons.
Then late today this comes out… It’s a good thing I read this site all the time as I heard ZERO about this on the news.
November Snow In Texas? Experts Warn Decreased Solar Activity Will Shatter All Global Climate Models
https://www.zerohedge.com/news/2018-11-15/november-snow-texas-experts-warn-decreased-solar-activity-will-shatter-all-global
Alpha
and Omega
Wait…what? You can’t just use up everything in between like that!!
That’s like the worm Ouroboros, or a tesseract on paper. By the pricking of my thumb…
All I can say is TAKE THIS 8 and ROTATE IT 90 DEGREES!!! Hah.