
Downwards movement has invalidated the main hourly Elliott wave count. Now the short-term structure is slightly clearer.
Summary: Downwards movement may be limited here. Look for strong support about 2,700. If price keeps falling here, then look for very strong support again about the teal trend channel.
Five daily charts today look at five different structures for primary wave 4, in order of probability (roughly): triangle, combination, zigzag, double zigzag, and flat.
New updates to this analysis are in bold.
The biggest picture, Grand Super Cycle analysis, is here.
Last published monthly chart is here, video is here.
ELLIOTT WAVE COUNT
WEEKLY CHART
Click chart to enlarge.
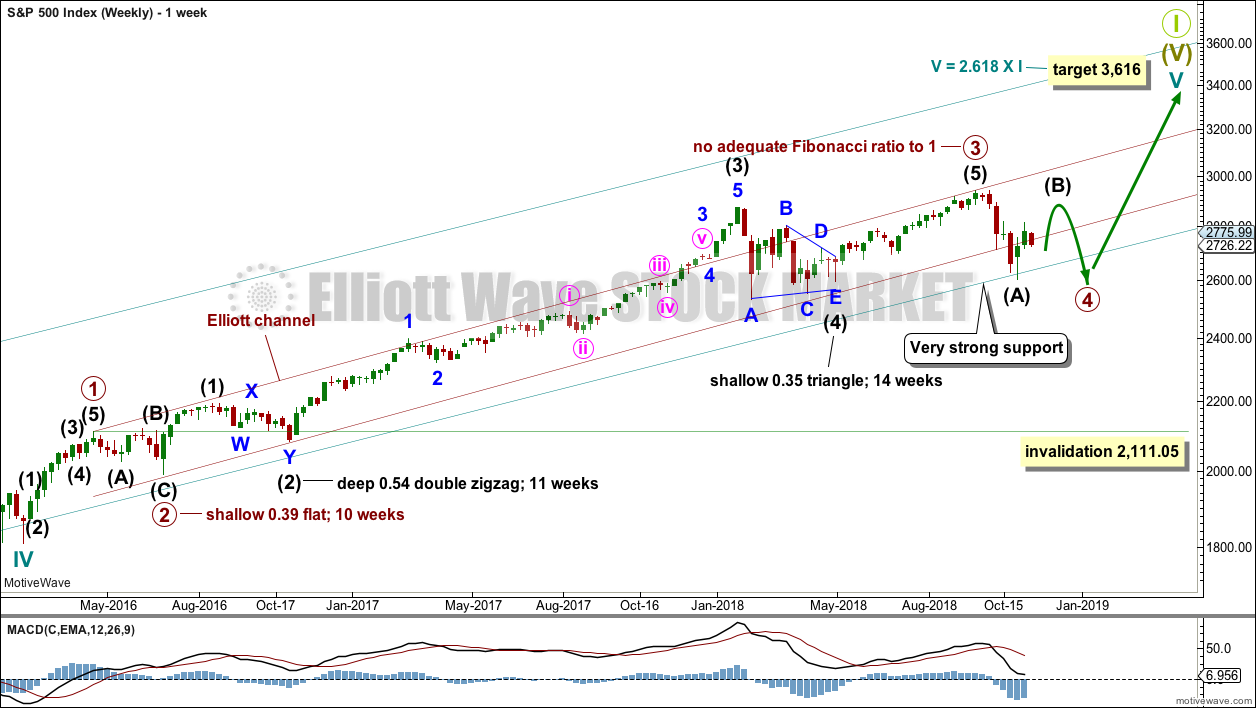
Cycle wave V must complete as a five structure, which should look clear at the weekly chart level and also now at the monthly chart level. It may only be an impulse or ending diagonal. It is clear it is an impulse.
Cycle wave V has passed equality in length with cycle wave I, and 1.618 the length of cycle wave I. The next Fibonacci ratio is used to calculate a target. When primary wave 4 is complete and the starting point for primary wave 5 is known, then the final target may also be calculated at primary degree. At that stage, there may be two targets, or the final target may widen to a small zone.
Within cycle wave V, the third waves at all degrees may only subdivide as impulses.
Within primary wave 3, there is perfect alternation and excellent proportion between intermediate waves (2) and (4).
The maroon channel is drawn about primary degree waves. The first trend line is drawn from the ends of primary waves 1 to 3, then a parallel copy is placed upon the low of primary wave 2. The overshoot of the upper edge of this channel by the end of intermediate wave (3) looks typical. For the S&P, its third waves are usually the strongest portion of an impulse; they often exhibit enough strength to overshoot channels.
Primary wave 4 now has an overshoot on the lower edge of the channel. This is acceptable; fourth waves are not always neatly contained within channels drawn using this technique.
Primary wave 4 may find very strong support about the lower edge of the teal channel, and it looks like this is from where price may be bouncing. This channel is copied over from the monthly chart and contains the entire bull market since its beginning in March 2009. While Super Cycle wave (V) is incomplete, this channel should not be breached at the weekly chart level.
Primary wave 4 may not move into primary wave 1 price territory below 2,111.05.
At this stage, the expectation is for the final target to be met in October 2019. If price gets up to this target and either the structure is incomplete or price keeps rising through it, then a new higher target would be calculated.
At this stage, the various possible structures for primary wave 4 will be published as separate daily charts, presented in order of probability.
DAILY CHART – TRIANGLE
Click chart to enlarge.
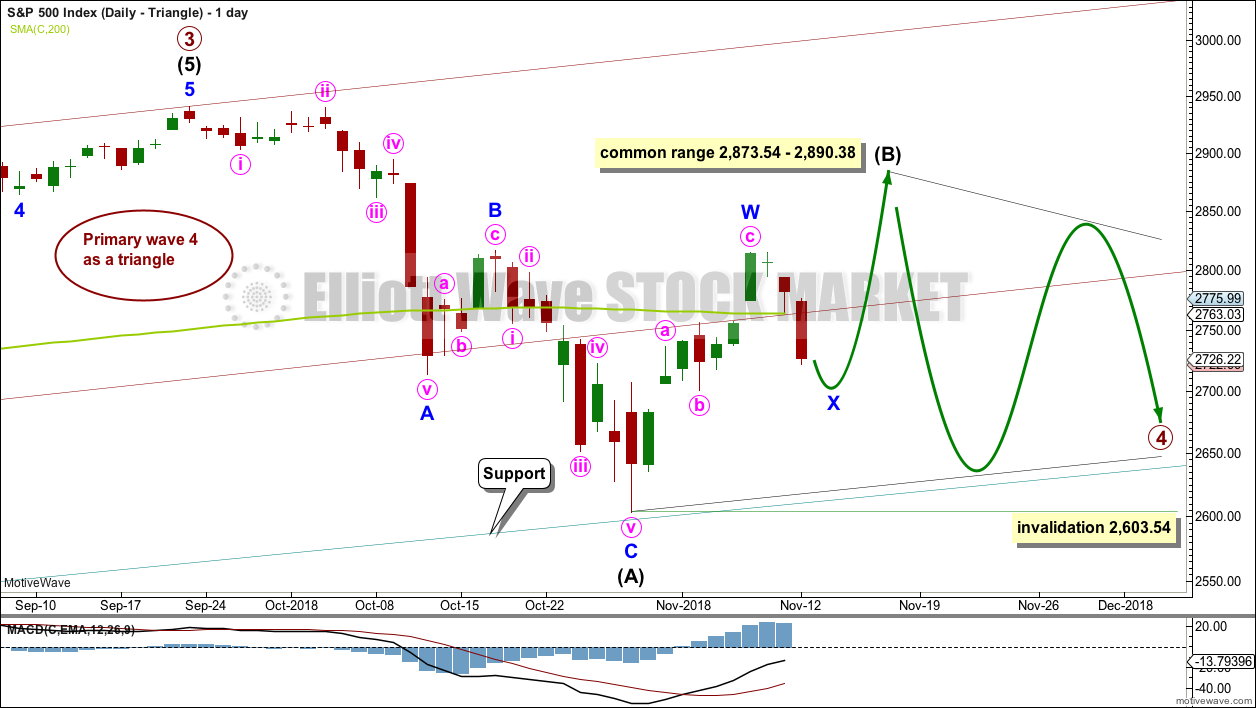
If primary wave 4 unfolds as a triangle, it would have perfect alternation with the regular flat correction of primary wave 2. It would also continue to find support about the lower edge of the teal trend channel. Triangles are fairly common structures for fourth waves. For these reasons this wave count may have a slightly higher probability than the other daily charts.
If primary wave 4 is unfolding as a triangle, then within it intermediate wave (B) would most likely be incomplete. To label intermediate wave (B) over at the last swing high is possible, but it would look too shallow for a normal looking Elliott wave triangle.
Triangle sub-waves are often about 0.8 to 0.85 the length of the prior wave. This gives a target range for intermediate wave (B).
One triangle sub-wave may subdivide as a multiple; this is most often wave C, but it may also be wave B. Intermediate wave (B) may be unfolding higher as a double zigzag.
There is no upper invalidation point for this wave count. Intermediate wave (B) may make a new high above the start of intermediate wave (A) as in a running triangle.
Within the triangle, intermediate wave (C) may not move beyond the end of intermediate wave (A) below 2,603.54.
HOURLY CHART – TRIANGLE
Click chart to enlarge.
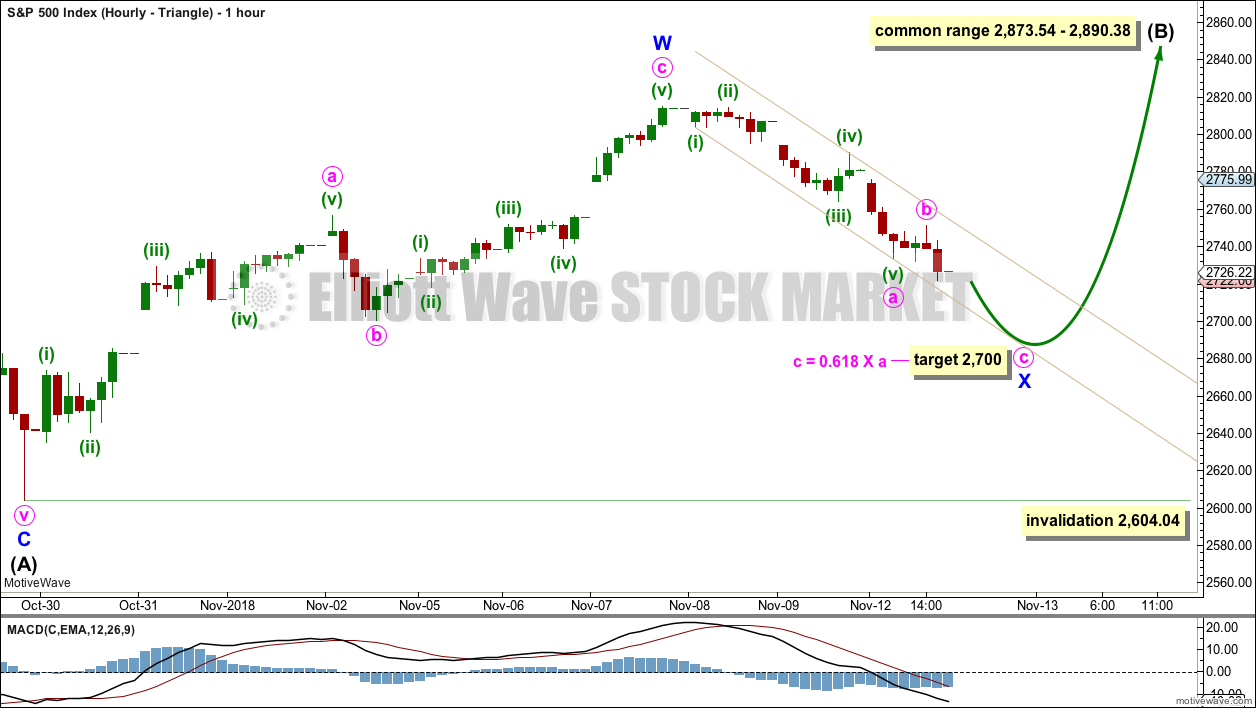
Intermediate wave (C) may not move beyond the end of intermediate wave (A). Now that intermediate wave (A) is over, price may not make a new low below its end at 2,604.04.
Intermediate wave (B) may be an incomplete double zigzag. Within the double zigzag, minor wave X may be an incomplete single zigzag. The target would expect to see a reasonably common Fibonacci ratio between minute waves a and c, and it would expect downwards movement to halt at strong support.
DAILY CHART – COMBINATION
Click chart to enlarge.
This wave count is judged to have only a very slightly lower probability than the triangle.
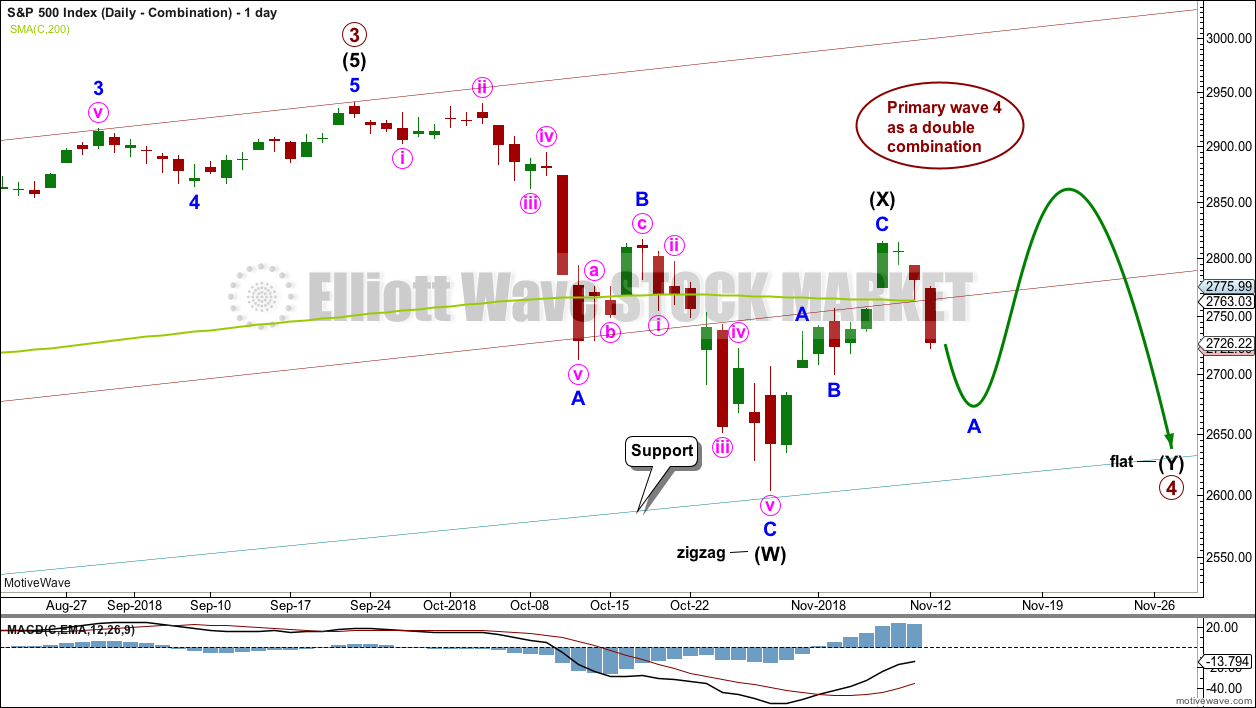
Primary wave 4 may be unfolding as a double combination. The first structure in the double may be a complete zigzag labelled intermediate wave (W). The double may be joined by a three in the opposite direction labelled intermediate wave (X). Intermediate wave (X) may be complete as a single zigzag; it is deep at 0.63 the length of intermediate wave (W), which looks reasonable.
Intermediate wave (Y) would most likely be a flat correction, which should subdivide 3-3-5. At its end, it may still find strong support about the lower edge of the teal trend channel.
DAILY CHART – ZIGZAG
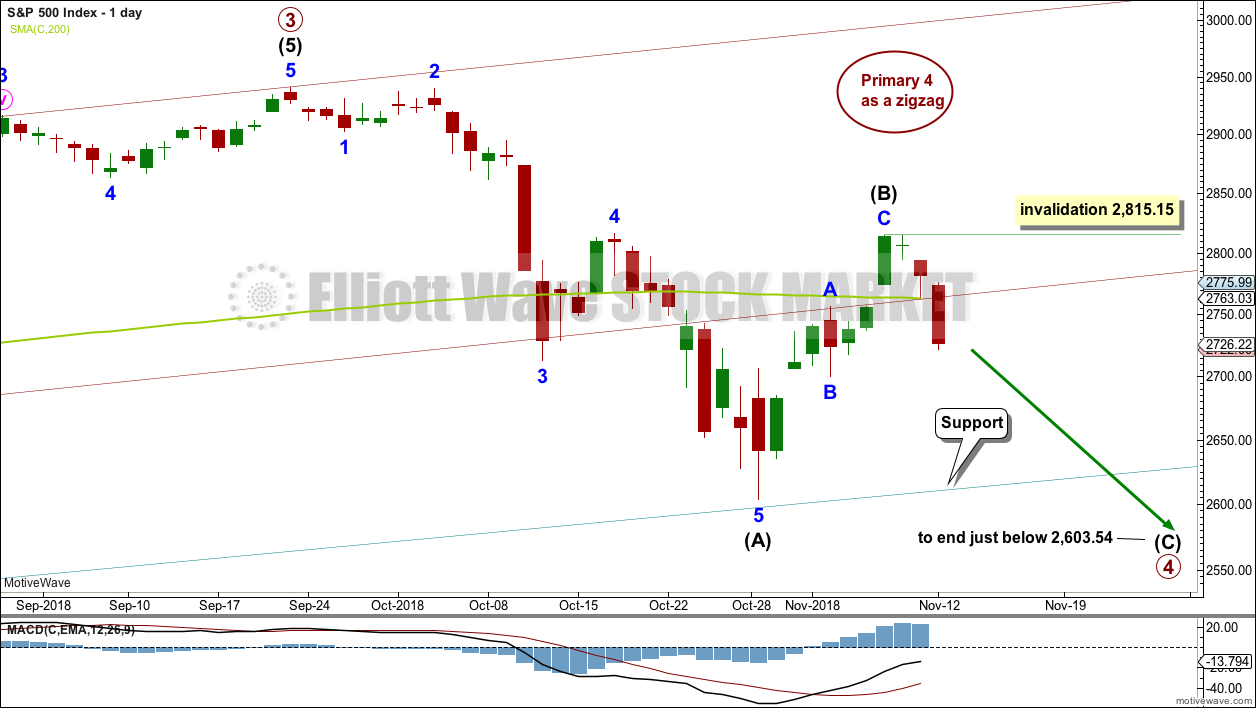
Click chart to enlarge.
Primary wave 4 may be unfolding as a single zigzag, which is the most common type of corrective structure.
Within the zigzag, intermediate wave (B) may now be a complete structure, ending close to the 0.618 Fibonacci ratio of intermediate wave (A).
Intermediate wave (C) may now unfold lower as a five wave structure. Intermediate wave (C) would be very likely to end at least slightly below the end of intermediate wave (A) at 2,603.54 to avoid a truncation. It may end about support at 2,600.
This wave count would expect a fairly large overshoot of the teal trend channel. This reduces the probability of this wave count.
DAILY CHART – DOUBLE ZIGZAG
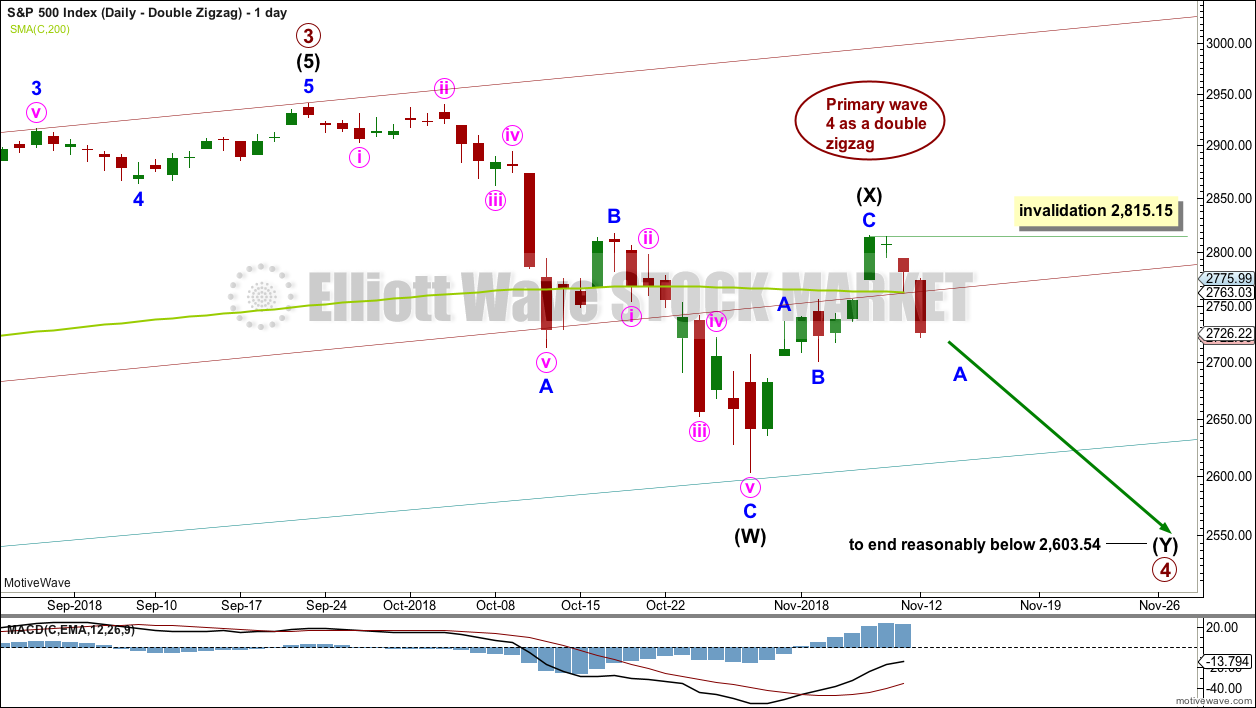
Click chart to enlarge.
Primary wave 4 may also be unfolding as a double zigzag.
The first zigzag in the double may be complete, labelled intermediate wave (W). The double may joined by a complete three in the opposite direction, a zigzag labelled intermediate wave (X).
The second zigzag in the double may have begun. It is labelled intermediate wave (Y). Within intermediate wave (Y), minor wave B may not move beyond the start of minor wave A above 2,815.15.
The purpose of a second zigzag in a double is to deepen the correction when the first zigzag does not move price deep enough. To achieve this purpose intermediate wave (Y) should be expected to end reasonably below the end of intermediate wave (W) at 2,603.54. This would expect a very large overshoot of the teal trend channel; for this reason, this wave count is judged to have the lowest probability.
DAILY CHART – FLAT
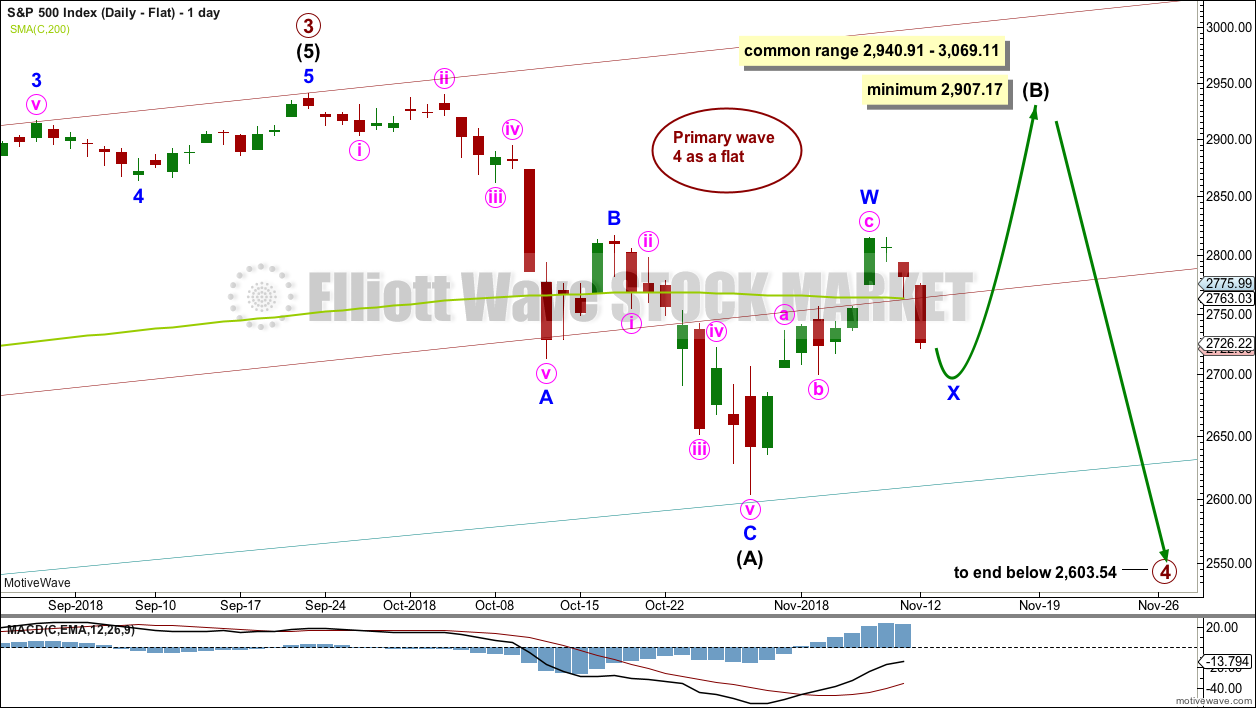
Click chart to enlarge.
Primary wave 2 was a regular flat correction. If primary wave 4 unfolds as a flat correction, then there would be no alternation in structure between the two corrections; for this reason, this wave count is judged to have a low probability.
However, alternation is a guideline, not a rule, and it is not always seen. This wave count is possible.
If primary wave 4 is a flat correction, then within it intermediate wave (B) must move higher to retrace a minimum 0.9 length of intermediate wave (A).
When intermediate wave (B) is complete, then intermediate wave (C) should move below the end of intermediate wave (A) at 2,603.54 to avoid a truncation. This would expect a reasonable overshoot of the teal trend line, which further reduces the probability of this wave count.
TECHNICAL ANALYSIS
WEEKLY CHART
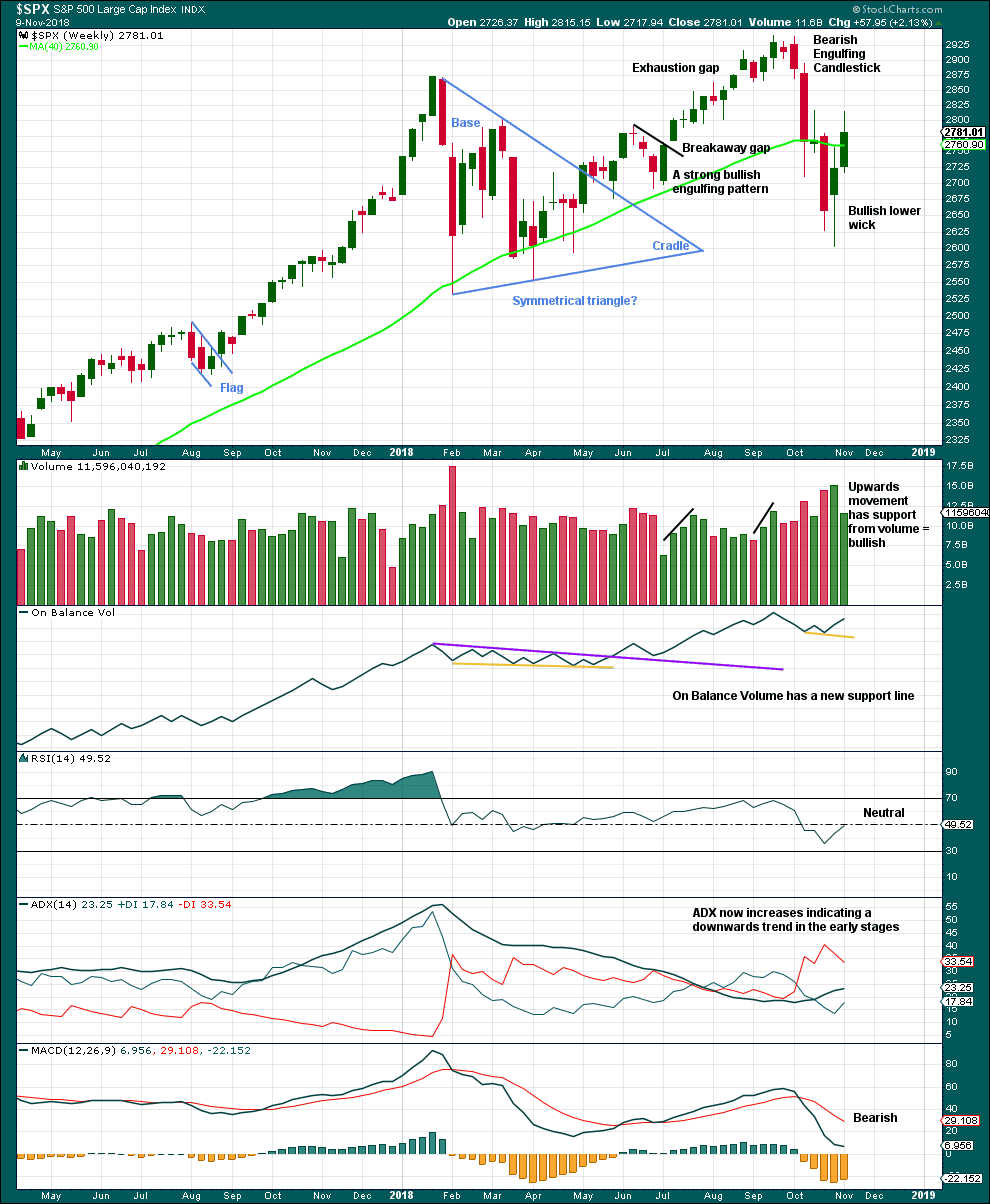
Click chart to enlarge. Chart courtesy of et=”_blank”>StockCharts.com.
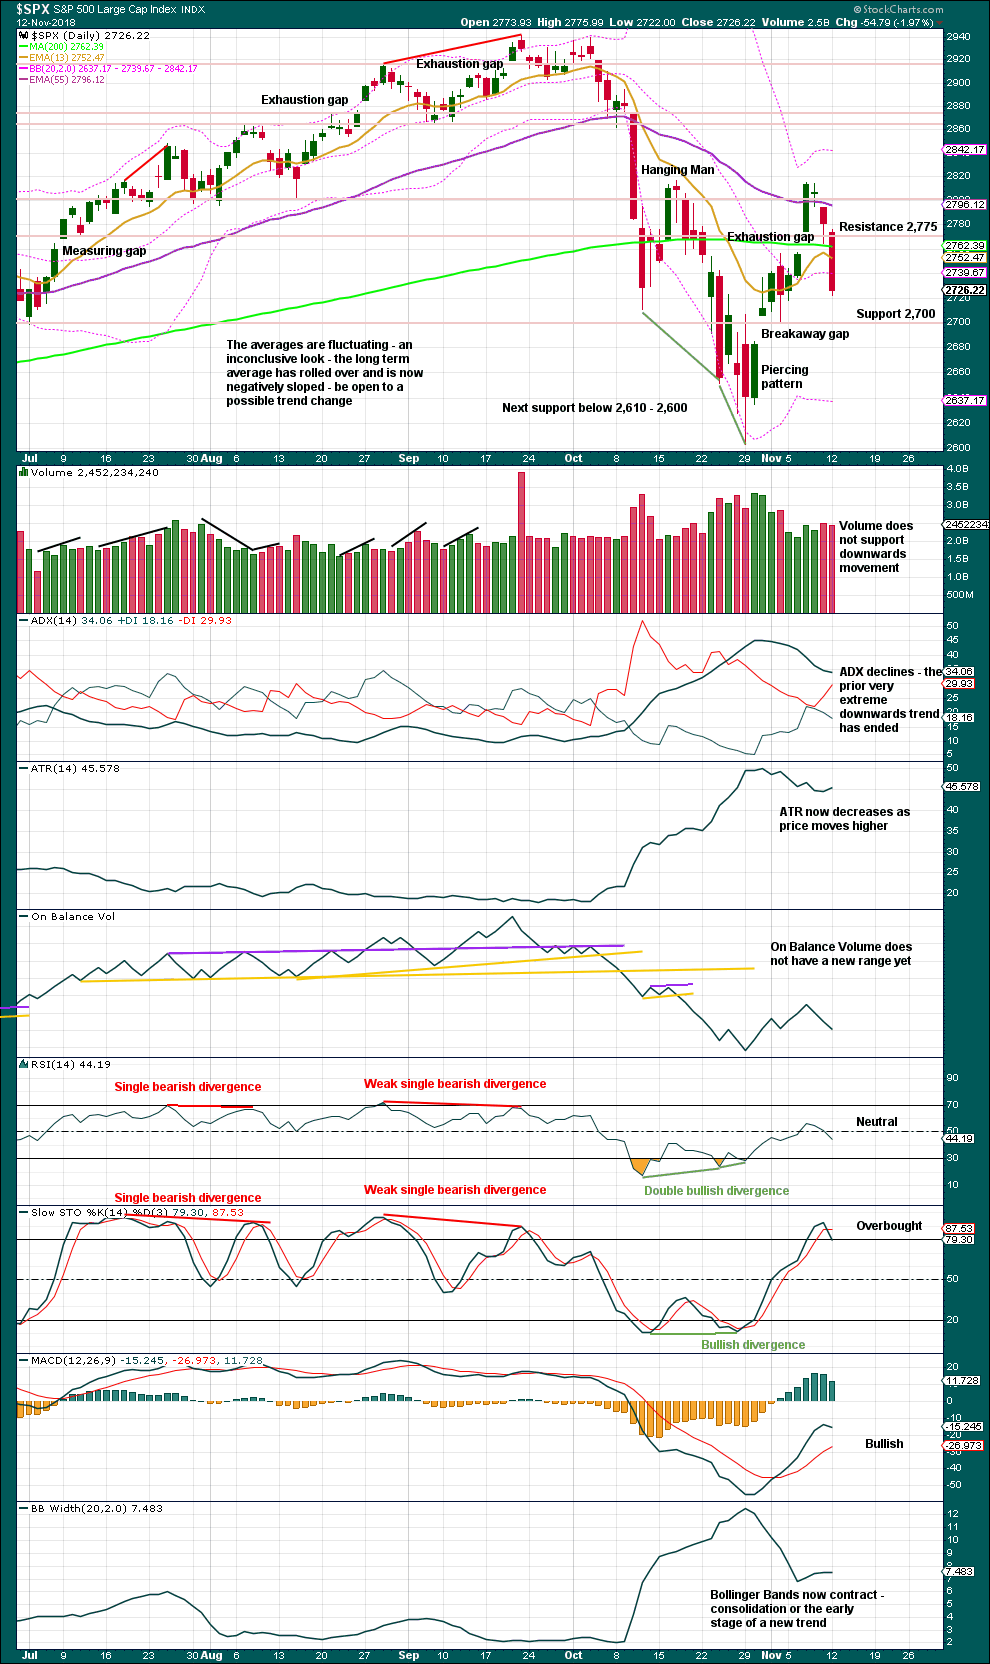
Weakness in volume and a long upper wick suggest this upwards week may be a counter trend bounce. Overall, this supports the Elliott wave count.
DAILY CHART
Click chart to enlarge. Chart courtesy of StockCharts.com.
The last gap is now closed, so it should correctly be now labelled an exhaustion gap.
The gap below is still open and may provide support. There is still strong support about 2,700.
With price reaching resistance and Stochastics overbought, a downwards swing to support may now be underway. If price can break below 2,700, then next support is about 2,600.
BREADTH – AD LINE
WEEKLY CHART
Click chart to enlarge. Chart courtesy of StockCharts.com.
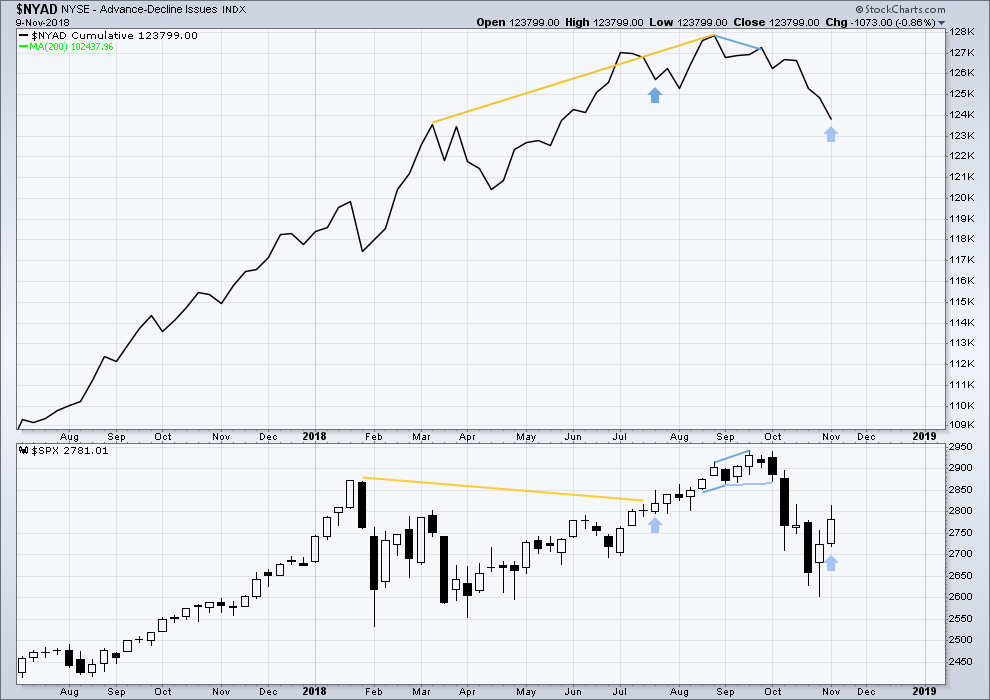
Last week price moved higher, but the AD line moved lower. This divergence is bearish and supports the second alternate Elliott wave count.
However, noted on this chart, there is one other instance of the same single week bearish divergence that was not followed by a downwards week.
DAILY CHART
Click chart to enlarge. Chart courtesy of StockCharts.com.
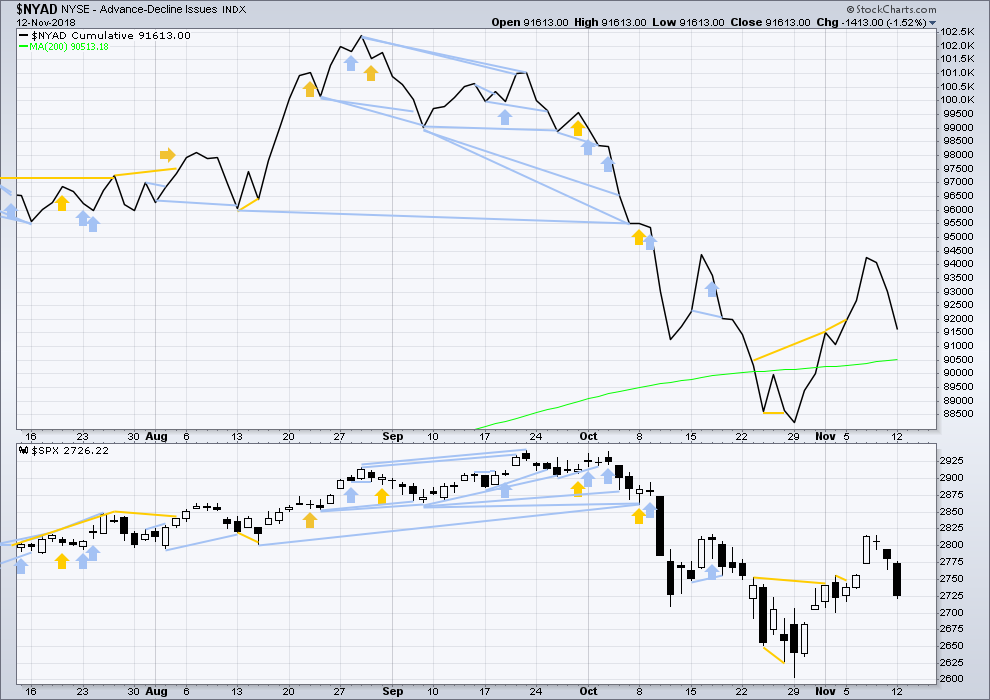
There is normally 4-6 months divergence between price and market breadth prior to a full fledged bear market. This has been so for all major bear markets within the last 90 odd years. With no longer term divergence yet at this point, any decline in price should be expected to be a pullback within an ongoing bull market and not necessarily the start of a bear market. New all time highs from the AD line on the 29th of August means that the beginning of any bear market may be at the end of December 2018, but it may of course be a lot longer than that. My next expectation for the end of this bull market may now be October 2019.
Breadth should be read as a leading indicator.
Downwards movement today has support from falling market breadth. There is no short-term divergence.
VOLATILITY – INVERTED VIX CHART
WEEKLY CHART
Click chart to enlarge. Chart courtesy of StockCharts.com. So that colour blind members are included, bearish signals
will be noted with blue and bullish signals with yellow.
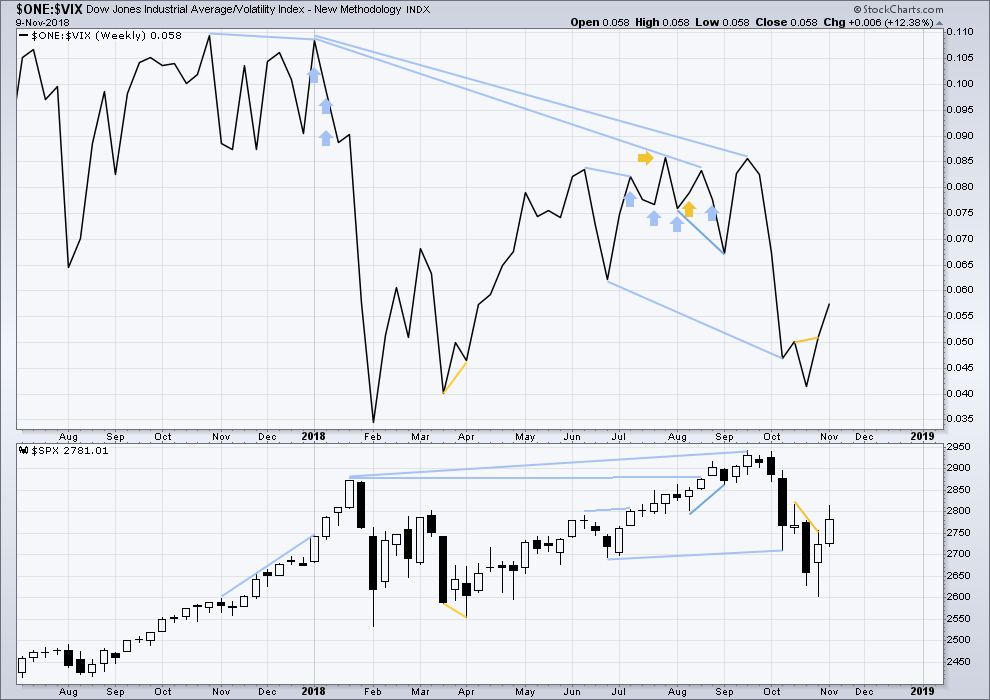
Last week price moved higher with inverted VIX. The rise in price last week comes with a normal corresponding decline in VIX.
DAILY CHART
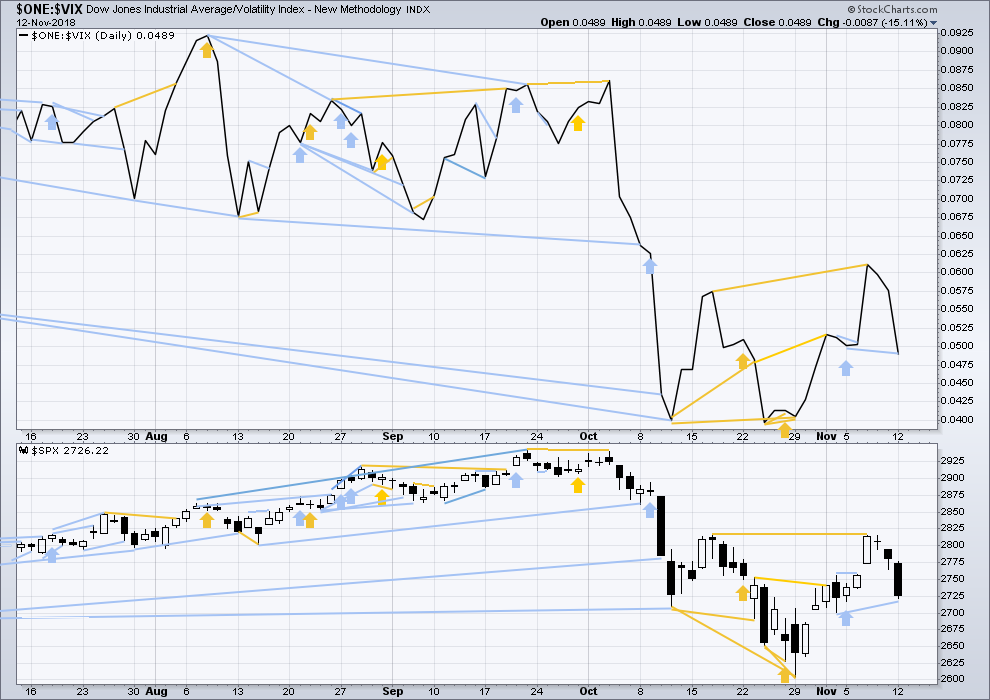
Click chart to enlarge. Chart courtesy of StockCharts.com. So that colour blind members are included, bearish signals
will be noted with blue and bullish signals with yellow.
Normally, volatility should decline as price moves higher and increase as price moves lower. This means that normally inverted VIX should move in the same direction as price.
Today inverted VIX makes a new low below the prior short term swing low, but price does not. VIX is rising faster than price is falling here. This divergence is bearish.
DOW THEORY
The following lows need to be exceeded for Dow Theory to confirm the end of the bull market and a change to a bear market:
DJIA: 23,344.52.
DJT: 9,806.79.
S&P500: 2,532.69.
Nasdaq: 6,630.67.
Published @ 10:45 p.m. EST.
—
Careful risk management protects your trading account(s).
Follow my two Golden Rules:
1. Always trade with stops.
2. Risk only 1-5% of equity on any one trade.
Joe:
Send me an e-mail….
Looking anecdotally at major global equity indices it appears as if most (DAX, CAC, FTSE, NKY, Toronto, AS30, STI, Sensex) are experiencing in the early stages of an A corrective wave as opposed to 4th wave you see for the S&P. How convinced are you that we are not there now for the US markets?
Thanks,
Peter M. Rup
Updated hourly chart for the first published daily triangle count:
Minute b now fits as an expanded flat, and it remains just within the narrow channel.
I’ve adjusted the target for minute c to equal minute a. This is the most common ratio for wave C of a zigzag.
I’ll add the my latest look at SPY volume profile shows that current zone is the highest volume. The next one down centers just a little lower that that target, at 2666. I do suspect SPX be goin’ thereabouts reasonably soon.
That all said, I’m more suspicious that we are in a zig zag or double z-z etc. than in an intermediate B up. But…we’ll see! It’s corrections inside corrections time, messy as all get out. Me, I’m effectively just trading the volatility (not trading the VIX, trading the market shorter term swings), with an overall downward biase (leaning on the longer term EW count and not worrying too much about the shorter term noise).
?
Or maybe 1-2 or A-B off this morning’s low?
Or not?
I think what you’re labelling there is an expanding triangle?
Well, that’s the one EW structure that looks like that anyway.
Wave E of an expanding triangle must end beyond the end of wave C.
Subwaves B, C and D each retrace a minimum 100% and maximum 150% of the prior subwave. In this example B is 1.75 X A, so the structure is invalid.
And finally, in my now 11 years of daily EW analysis I don’t think I have ever seen an expanding triangle. And in my research so far I have not found one. The rarity is so great, IMO the structure should almost be removed from the description of EW structures.
noted… sure was a good day to trade up and down in the narrow channel. thank you
True. Probably go down again.
Think the main count is still valid, just turned at 2,725 instead of 2,700.
has not breached the channel…
appears to be a backing/filling range day. Whether it’s setting up for a turn back up of some significance, or just pausing before continuing the daily level down trend is the question of the day as I see it. A wait and see day for me.
Meanwhile, TLT is moving back up into an area where I think considering renewed (additive) shorts is on my agenda. I’ve got the daily trend as back to mild up…but the last time that happened in late Oct, the same day that trend asserted itself, it topped. I.e., the current move up is almost certainly just a pullback in the continuing down trend. I’m buying put bear spreads on TLT, and will be happy to peel off the short side if it moves against me, at some point. The secular trend is clearly down.
Posted earlier this evening. Posted again here for full exposure. This is the ‘flat’ pattern explained in Lara analysis today. Sure enough, lowest probability.
—————————————————————————————
This may be of interest to some. If we make it down toward 2700 tomorrow and it seems like downward movement is stalling, I will most likely be buying long positions. Measured move of the inverse H&S pattern is 3000+.
Lara, it appears that when one posts a chart and later edits the text, the entire post is held for moderation. It is no problem for me but I thought you might like to know.
Yeah, I know. It happens to me too!
I would advise members when that happens, to just post the comment again. I’ll delete the duplicate.
firstus.
2nd
3rd