
A small range inside day fits overall expectations.
The main Elliott wave count remains the same. The alternate Elliott wave count is slightly adjusted to consider a different short-term structure.
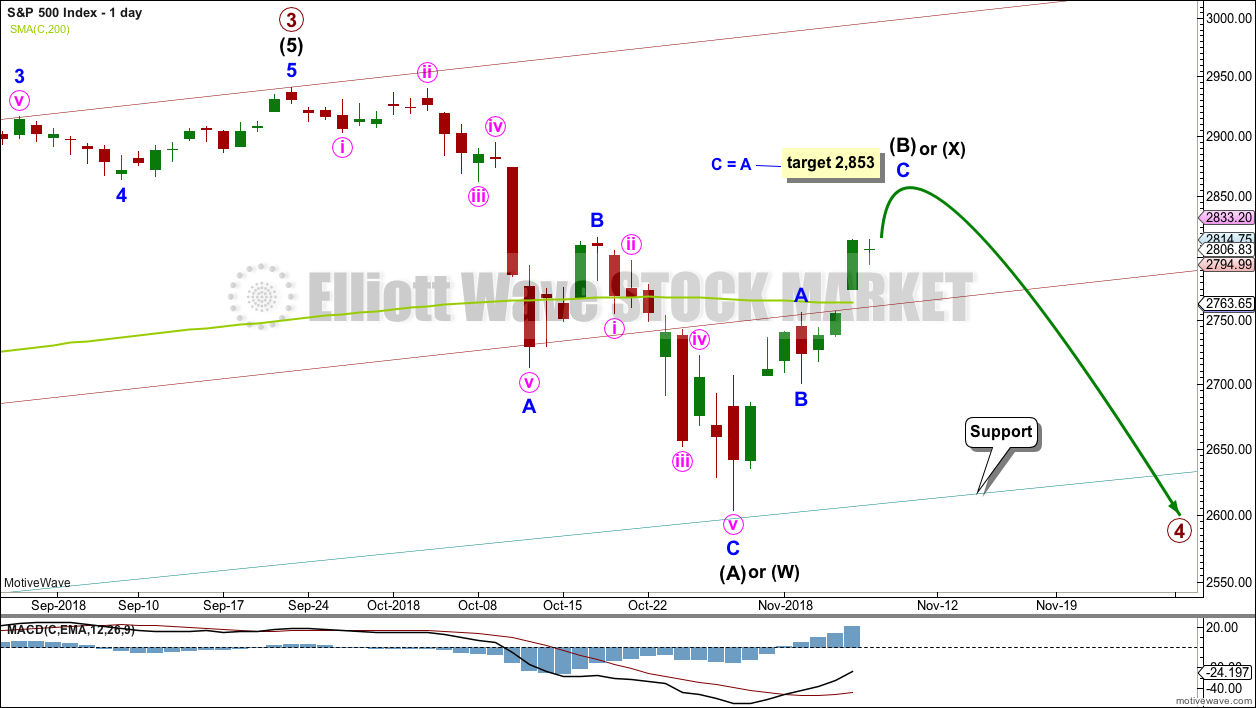
Summary: The target for this bounce to end is now 2,853. If this target is wrong, it may be too low; a range for a possible high is from from 2,873.54 to 2,890.38, with the lower edge of this zone favoured as there is strong resistance about 2,875.
A primary degree correction should last several weeks and should show up on the weekly and monthly charts. Primary wave 4 may total a Fibonacci 8, 13 or 21 weeks. Look for very strong support about the lower edge of the teal trend channel on the monthly chart.
Primary wave 4 should be expected to exhibit reasonable strength. This is the last multi week to multi month consolidation in this ageing bull market, and it may now begin to take on some characteristics of the bear market waiting in the wings.
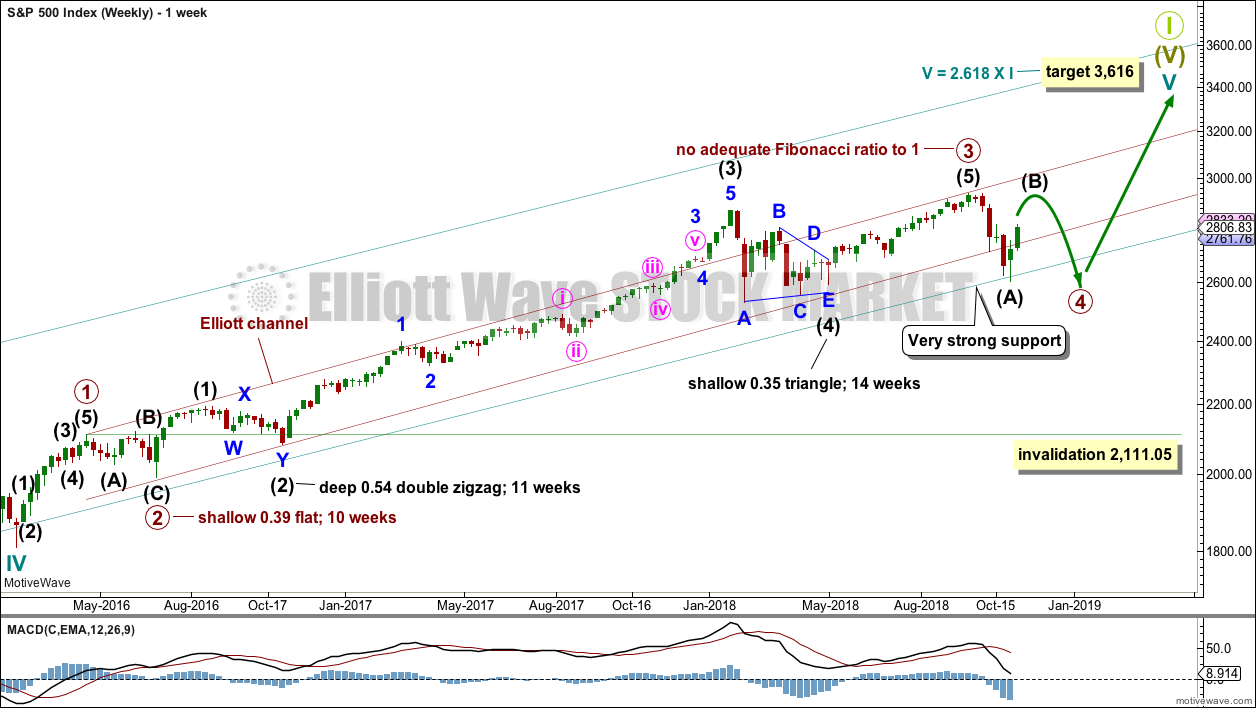
The final target for this bull market to end remains at 3,616, which may be met in October 2019.
New updates to this analysis are in bold.
The biggest picture, Grand Super Cycle analysis, is here.
Last published monthly chart is here, video is here.
ELLIOTT WAVE COUNT
WEEKLY CHART
Click chart to enlarge.
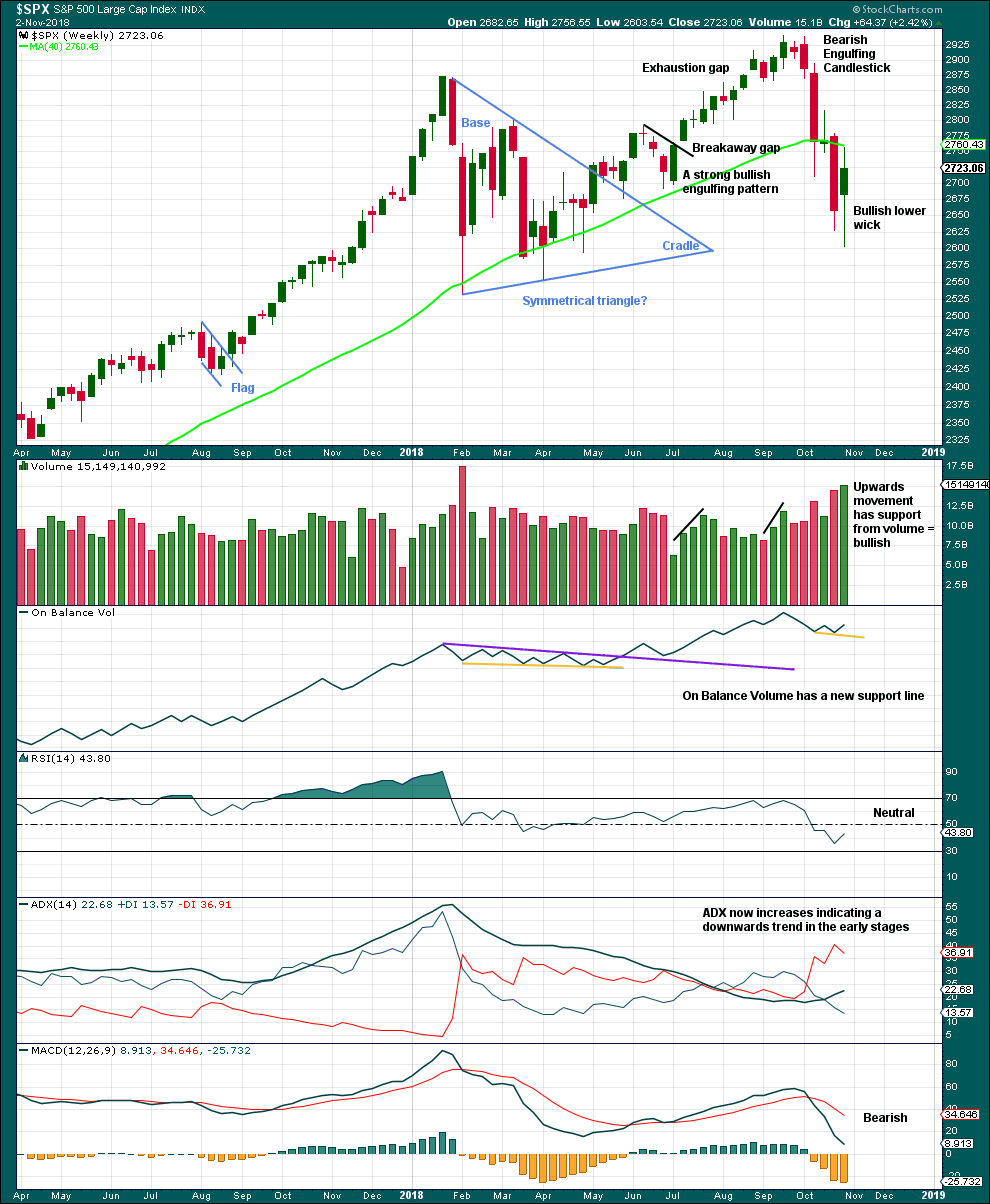
Cycle wave V must complete as a five structure, which should look clear at the weekly chart level and also now at the monthly chart level. It may only be an impulse or ending diagonal. It is clear it is an impulse.
Within cycle wave V, the third waves at all degrees may only subdivide as impulses.
Within primary wave 3, there is perfect alternation and excellent proportion between intermediate waves (2) and (4).
The maroon channel is drawn about primary degree waves. The first trend line is drawn from the ends of primary waves 1 to 3, then a parallel copy is placed upon the low of primary wave 2. The overshoot of the upper edge of this channel by the end of intermediate wave (3) looks typical. For the S&P, its third waves are usually the strongest portion of an impulse; they often exhibit enough strength to overshoot channels.
Primary wave 4 now has an overshoot on the lower edge of the channel. This is acceptable; fourth waves are not always neatly contained within channels drawn using this technique.
Primary wave 4 may find very strong support about the lower edge of the teal channel, and it looks like this is from where price may be bouncing. This channel is copied over from the monthly chart and contains the entire bull market since its beginning in March 2009. While Super Cycle wave (V) is incomplete, this channel should not be breached at the weekly chart level.
Primary wave 4 may not move into primary wave 1 price territory below 2,111.05.
When primary wave 4 may be complete, then the final target may be also calculated at primary degree. At that stage, the final target may widen to a small zone, or it may change.
At this stage, the expectation is for the final target to be met in October 2019. If price gets up to this target and either the structure is incomplete or price keeps rising through it, then a new higher target would be calculated.
DAILY CHART
Click chart to enlarge.
Primary wave 4 would most likely end somewhere within the price territory of the fourth wave of one lesser degree. Intermediate wave (4) has its price territory from 2,872.87 to 2,532.69. Within this range sit the 0.236 Fibonacci ratio at 2,717 and the 0.382 Fibonacci ratio at 2,578.
The 0.382 Fibonacci ratio would expect an overshoot of the teal channel. This may be too low; price may find support at the lower edge of the channel. However, as primary wave 4 should be expected to exhibit reasonable strength, it may be able to overshoot the channel and that would look reasonable. This possibility is now more seriously considered.
Primary wave 2 unfolded as a shallow regular flat correction lasting 10 weeks.
Intermediate wave (A) may be seen as a complete zigzag. A zigzag down to start primary wave 4 may also be labelled intermediate wave (W).
If intermediate wave (A) or (W) subdivide as a zigzag, then primary wave 4 may unfold as a double zigzag, double combination, flat or triangle. Of all these possible structures a flat correction would be least likely as that would not offer structural alternation with the flat correction of primary wave 2.
A double zigzag would also be less likely as that would require a very large overshoot of the teal trend channel, and it would also see a relatively brief primary wave 4.
A triangle would be fairly likely even though intermediate wave (4) was a triangle. This does not reduce the probability of primary wave 4 also subdividing as a triangle.
A double combination should always be considered if a triangle is possible, and this would also offer reasonable alternation with primary wave 2.
All structural options (except a double zigzag) which begin with a zigzag down would expect a high bounce for intermediate wave (B) or (X). Intermediate wave (B) or (X) would most likely subdivide as a zigzag.
Within a triangle for primary wave 4, intermediate wave (B) would most likely be about 0.8 to 0.85 the length of intermediate wave (A) giving a target range from 2,873.54 to 2,890.38. Intermediate wave (B) of a running triangle may make a new high above the start of intermediate wave (A). The target calculated would see intermediate wave (B) about 0.74 the length of intermediate wave (A); although this would be a little shorter than the most common length, it would still be acceptable.
Within a double combination for primary wave 4, intermediate wave (W) may be the first complete structure in a double. Intermediate wave (X) may be a very high bounce and may make a new high above the start of intermediate wave (W). There is no minimum requirement for the length of intermediate wave (X), and no maximum limit. The target calculated for intermediate wave (X) would see it as a reasonably high bounce; this would give a combination the right look.
When intermediate wave (B) or (X) is complete, then intermediate wave (C) or (Y) downwards may complete primary wave 4. If primary wave 4 is a triangle, then intermediate waves (C), (D) and (E) would be required to complete it.
For both of the more likely options of a triangle or combination for primary wave 4, price may continue to find support about the lower edge of the teal trend channel. This would give the wave count the right look at the monthly time frame.
HOURLY CHART
Click chart to enlarge.
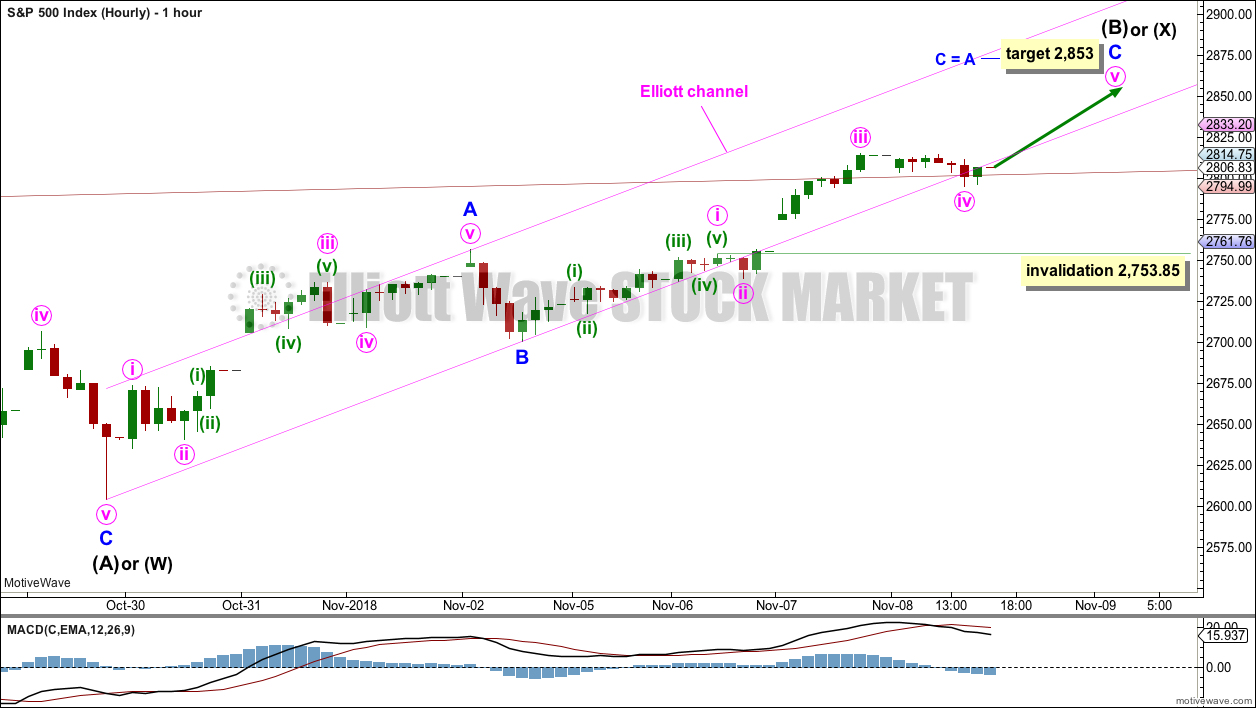
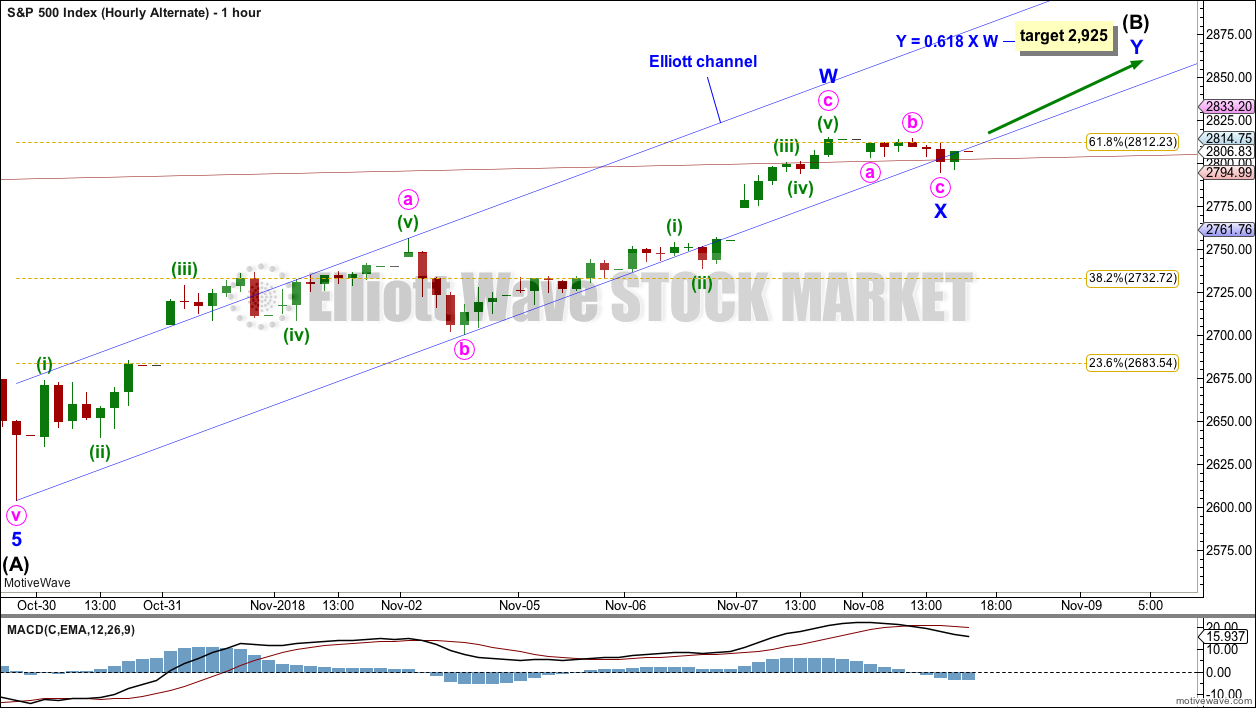
Intermediate wave (B) or (X) would most likely subdivide as a single or multiple zigzag to achieve a high bounce.
This main wave count will continue to consider the possibility that a single zigzag upwards may be completing. The alternate below will consider the possibility that a double zigzag upwards may be completing. Both ideas work in exactly the same way for both wave counts.
Within the zigzag, minor wave B may have been a relatively brief and shallow zigzag. The target for minor wave C expects it to exhibit the most common Fibonacci ratio to minor wave A.
Within minor wave C, minute wave iv may not move into minute wave i price territory below 2,753.85.
If the target at 2,853 is wrong, it may not be high enough. Intermediate wave (B) or (X) may be a higher bounce that ends within the range most common for B waves within triangles: between 2,873.54 to 2,890.38.
Draw a channel about this upwards movement using Elliott’s technique for a correction. Minor wave C may end either mid way within the channel or about the upper edge. A clear breach of the channel by downwards (not sideways) movement would be an early indication that intermediate wave (B) or (X) may be over. However, the S&P does not always fit well into channels at the end of bullish waves. It may breach this channel with sideways and weak downwards movement, only to then turn and continue higher. It does this when it forms slow curving rounded tops. The channel may not be very reliable.
If intermediate wave (A) or (W) has subdivided as a three, then intermediate wave (B) or (X) may make a new price extreme beyond the start of intermediate wave (A) or (W) above 2,940.91. There is no upper invalidation point for this main wave count for this reason.
ALTERNATE WAVE COUNT
DAILY CHART
Click chart to enlarge.
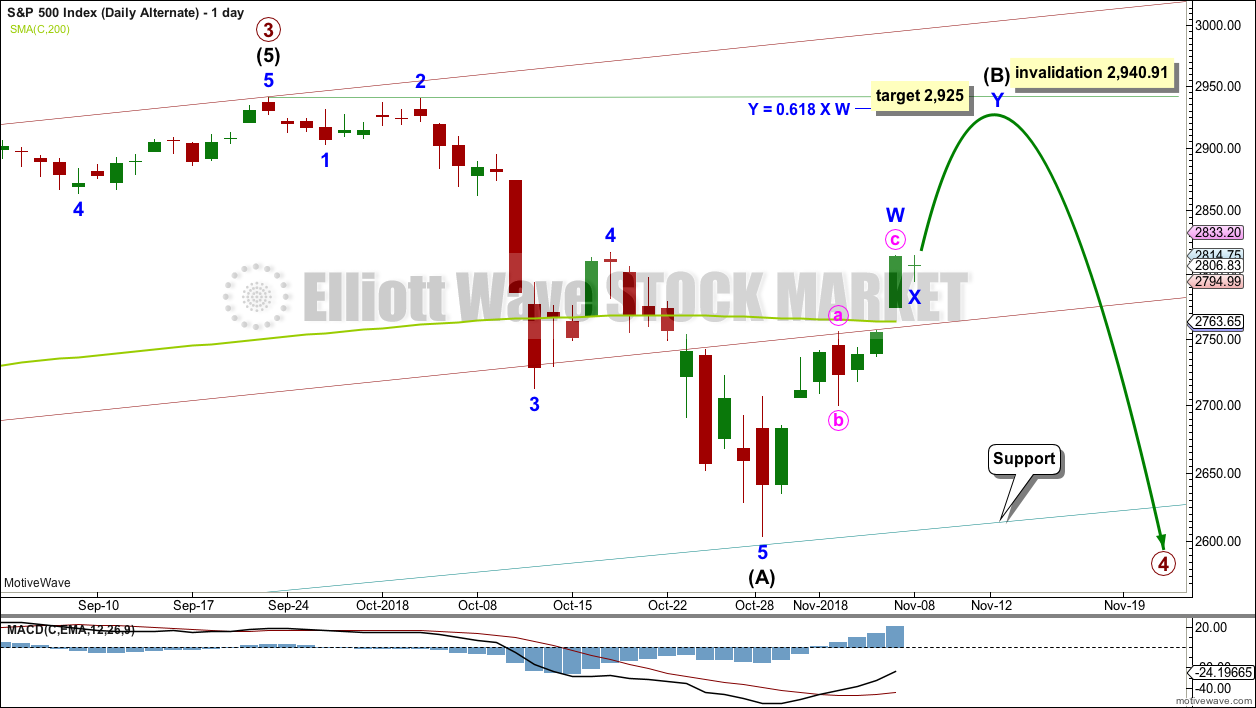
It is also possible to see the downwards wave labelled intermediate wave (A) as a complete impulse. If intermediate wave (A) is a five wave structure, then intermediate wave (B) may not move beyond its start above 2,940.91.
Primary wave 4 may be a zigzag to provide structural alternation with the flat correction of primary wave 2; intermediate wave (A) within a zigzag must subdivide as a five wave structure. When intermediate waves (A) and (B) are complete, then intermediate wave (C) would most likely end below the end of intermediate wave (A) to avoid a truncation. This would see the end of primary wave 4 substantially overshoot the lower edge of the teal channel, which would be unlikely and is why this alternate wave count is judged to have a lower probability than the main wave count.
Primary wave 4 may not move into primary wave 1 price territory below 2,111.05.
HOURLY CHART
Click chart to enlarge.
Intermediate wave (B) may be unfolding as a double zigzag.
The first zigzag in a double may be complete, labelled minor wave W. The double may be joined by a three in the opposite direction labelled minor wave X. It is possible also that minor wave X may be incomplete; it could move lower. There is no lower invalidation point for this wave count because there is no rule stating a limit for X waves within multiples.
Double zigzags normally have a strong slope against the prior trend. To achieve a strong slope their X waves are normally brief and shallow.
The target for intermediate wave (B) to complete would see it very deep in relation to intermediate wave (A). This is entirely possible.
If intermediate wave (A) has subdivided as a five, then intermediate wave (B) may not move beyond its start above 2,940.91.
TECHNICAL ANALYSIS
WEEKLY CHART
Click chart to enlarge. Chart courtesy of et=”_blank”>StockCharts.com.
Another long lower wick and support from volume last week looks bullish again.
The support line for On Balance Volume is removed and redrawn.
DAILY CHART
Click chart to enlarge. Chart courtesy of StockCharts.com.
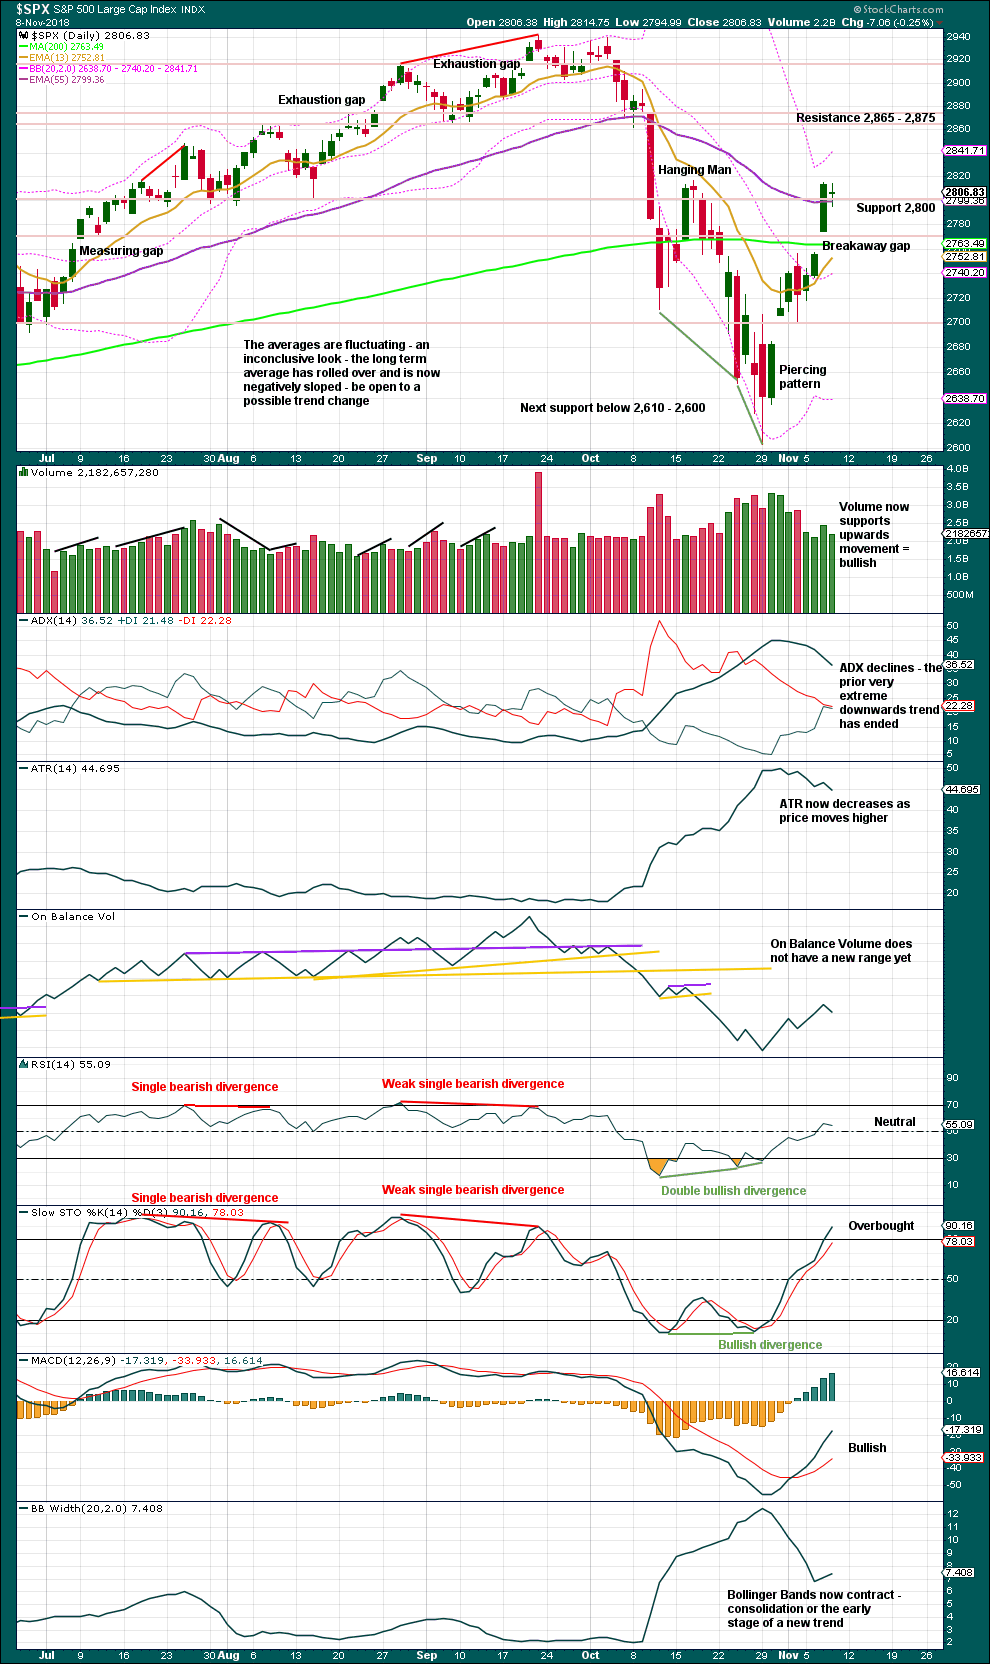
Today completes a small inside doji with the balance of volume downwards. Downwards movement within today’s session lacks support from volume; the short-term volume profile remains bullish.
Look now for upwards movement to continue to resistance about 2,765 – 2,875. If price reaches resistance and Stochastics is overbought, and then a candlestick reversal pattern appears, it may then be expected that a high is in place. That is not the case yet, so expect this upwards swing to continue.
BREADTH – AD LINE
WEEKLY CHART
Click chart to enlarge. Chart courtesy of StockCharts.com.
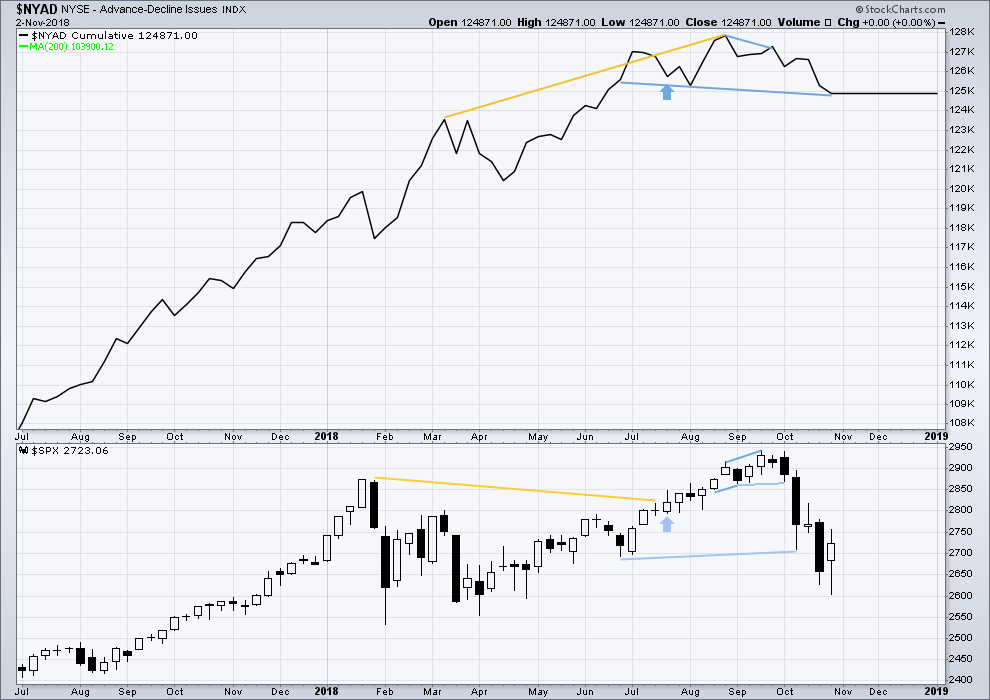
Falling price has support from a decline in market breadth. Breadth is falling in line with price. There is no divergence either way.
DAILY CHART

Click chart to enlarge. Chart courtesy of StockCharts.com.
There is normally 4-6 months divergence between price and market breadth prior to a full fledged bear market. This has been so for all major bear markets within the last 90 odd years. With no longer term divergence yet at this point, any decline in price should be expected to be a pullback within an ongoing bull market and not necessarily the start of a bear market. New all time highs from the AD line on the 29th of August means that the beginning of any bear market may be at the end of December 2018, but it may of course be a lot longer than that. My next expectation for the end of this bull market may now be October 2019.
Breadth should be read as a leading indicator.
Downwards movement within this last session has support from a small decline in market breadth. There is no new short term divergence.
VOLATILITY – INVERTED VIX CHART
WEEKLY CHART
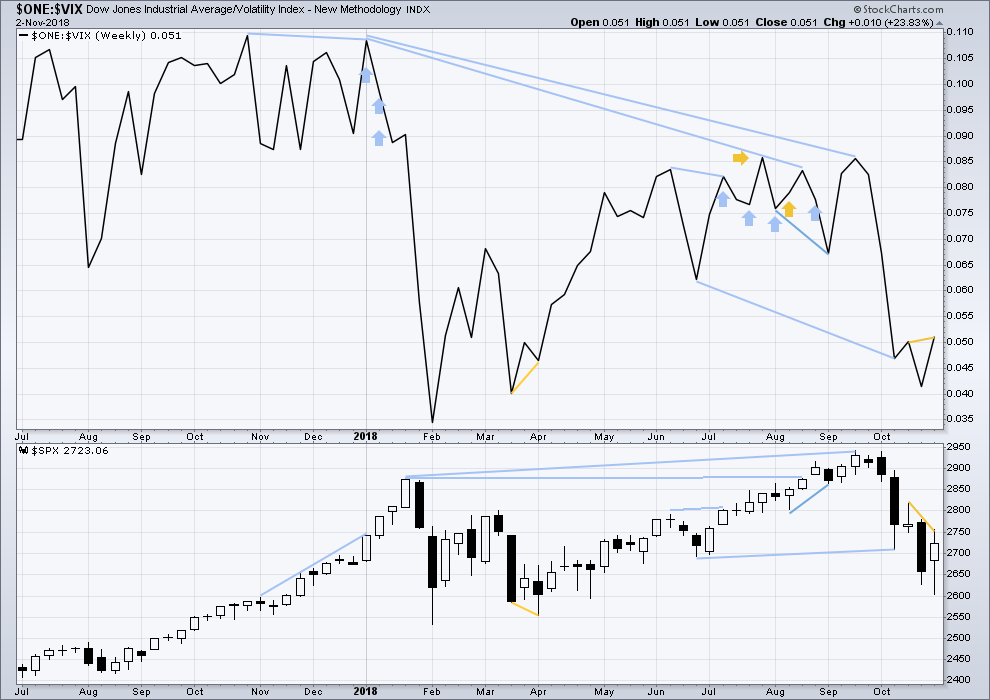
Click chart to enlarge. Chart courtesy of StockCharts.com. So that colour blind members are included, bearish signals
will be noted with blue and bullish signals with yellow.
Last week inverted VIX has made a new high above the prior swing high two weeks ago, but price has not. This divergence is bullish.
DAILY CHART

Click chart to enlarge. Chart courtesy of StockCharts.com. So that colour blind members are included, bearish signals
will be noted with blue and bullish signals with yellow.
Normally, volatility should decline as price moves higher and increase as price moves lower. This means that normally inverted VIX should move in the same direction as price.
Bullish divergence noted in last analysis has not been followed by more upwards movement today. It may have failed, or it may be an early warning.
The small fall in price during today’s session has support from a small decline in inverted VIX. There is no new short term divergence.
DOW THEORY
The following lows need to be exceeded for Dow Theory to confirm the end of the bull market and a change to a bear market:
DJIA: 23,344.52.
DJT: 9,806.79.
S&P500: 2,532.69.
Nasdaq: 6,630.67.
Published @ 08:24 p.m. EST.
—
Careful risk management protects your trading account(s).
Follow my two Golden Rules:
1. Always trade with stops.
2. Risk only 1-5% of equity on any one trade.
Very tricksy Mr. Market.
Not at all clear to me exactly what his is up to.
I snagged a vertical bull put spread for giggles as the candle shadow suggests a move higher next week. It COULD be a feint, so we will see. Rolled bear vertical spreads out a few more weeks just for good measure. Looks like one more push higher people.
See ya laters, Alligators! 🙂
Thankfully, I managed to scalp a quick small gain in RTY as it bounced at end of the day. Flat over the weekend.
I appreciate all the input from you savvy traders here on Lara’s comment thread. See y’all Monday.
Back to knife work, with price retracing the move down. Maybe it goes all way…maybe it doesn’t. I’ve taken 1/2 my tactical long profit, will hold out on the rest for a good guess at the ultimate top here, perhaps early next week.
Oops, took my second half too. Decided I don’t want to hold a tactical long here over the weekend. I can reenter tactical positions Monday and avoid the risk of a giant gap down opening.
Now a pretty strong turn back down right off the 50% (2790) fibo. I dunno folks…we’ll see on Monday. Maybe up and above the recent highs…maybe not.
Don’t worry. We will probably get a gap up Monday from the silly banksters on the way to a nominal high just enough to convince the gullible that we are headed back to the moon.
Today was a sneaky bear trap for short term trend followers imho…
Not likely. The market makers are not done shaking the trees. They know what is coming and are determined to shake out any and all weak hands ahead of the turn.
We had the most incredible assault on our massive SPY 279.5/280.5 bear call spread expiring this Friday that I have EVER seen. We figured from that massive gap higher Wednesday the plan was to push the short calls of bearish positions into the money and exercise them and that is exactly what the S.O.B.s tried. They pushed price above 279.50 but held in under 280.50 to keep our long calls out of the money and force an exit from the spread at a loss. We defended!
Two can play that game!
Just to stick it to ’em, although we did not have to as both legs ended up out of the money, we rolled the spread, and doubled the position!
Been awhile since they tried that with the posse…. 😀
Who’s the posse?
On the lighter side during this trader’s lul…
Does anybody know the palindromic greeting exchanged by the world’s first couple?
A case of Guinness for the winner! 🙂
Madam In Eden, I’m Adam
VERY IMPRESSIVE!!! 🙂 🙂 🙂
It is indeed impressive. Of course I could not have answered that because I had to look up the meaning of the word “palindromic “. It is Friday afternoon and you are taxing my brain. Not advised for this old man! Have a great weekend all. The “C” or “3rd” wave for which many are looking, is coming soon. Just not yet.
Enjoy your week-end my friend! 🙂
Careful with that axe Eugene! Palindromes are known to capture ghosts… If ya don’t believe me, read “Earthquake Weather” by Tim Powers, vastly entertaining stuff.
Ian,
About your comment on my ‘news’ source for the market hours next Monday, it did not dawn on me until I was gone from the house and riding in the car what you meant by asking if I got it from CNN. When I read it I thought, “Why would he think that?” But it dawned on me I was posting Fake News which some media channels are often dispensing. Good one. I chuckled at your wit and my density of mind. Thanks for the smiles.
Hey Ian when and where’s the party? Like our new SCOTUS member, “I like beer!”. Well, not as much as him, but one is good!
Guinness is the nastiest beer in the world.
You can have mine.
Definitely and “acquired” taste! 🙂
Regular beer drinkers really dislike it…hyuk!
When in doubt, sit it out.
I really don’t like this price action.
The bears did take out 2800, BUT…they did not do it as if they meant business.
We are lightening up positions. I would hate to miss the start of the C or third down but I have a feeling the banksters have another card up their sleazy sleeve…if ya know whatta mean… 🙂
On the other hand, if we take out 2700 before the close I’m all in!
2765 is a 23% retrace level and a high potential turn back up level. It’s “close enough” now at the hourly view.
If the 5 minute polarity inverts I will take a small tactical long.
23% held and polarity inversion in process. In like Flynn…
me too, but on the RUT
There is a trap being set for somebody…but who?….bull…..or bear?
i also count a CLEAR 5 down on the RUT, ready to hit the 0.382
Hourly chart updated:
This looks possible on the daily chart. Today’s red candlestick could be a correction of the same degree as the red daily candlestick for the 2nd of November.
An impulse could be incomplete for minor wave A.
Minute wave iv may not move into minute wave i price territory.
And now the problem becomes, 1-2-3 of an impulse subdivides exactly the same as A-B-C of a zigzag. They both subdivide 5-3-5.
So which is it? An impulse continuing higher? Or a zigzag complete at the last high?
It could be both. While price remains above 2,756.55 that is.
But even a new low below 2,756.55 is not enough to indicate the bounce is over. A double zigzag may continue higher. The only requirement for minor wave X within a double zigzag is that it is relatively brief and shallow.
I am not ready yet to consider this bounce for intermediate wave (B) or (X) as complete. If it is over at the last high it would be remarkably brief and shallow.
Now, that is possible, but when I look at it on the daily chart it looks way too shallow for intermediate wave (B) within a normal looking Elliott wave triangle.
It looks too shallow for intermediate wave (X) within a combination.
It does look possible for intermediate wave (X) within a double zigzag though. That’s possible. But that would see intermediate (Y) move below intermediate (W) which would expect a substantial overshoot of the teal channel.
This is all getting a bit confusing. I’ll try really hard later today to make this as clear as I can in the video.
many thanks for the intra day update! very valuable to me.
I’ve got the B up move (X?) at 33% of the time of the A (W?) down, and it retraced almost exactly 61.8%. Independent of anything else, those numbers seem reasonable to me. Leading me to think it very well may be the WXY model for P4. My posture is the market now needs to prove to me this isn’t the right count. That’s just me though, and I am being influence by the even stronger weakness in other markets.
Thank you, Lara. I am happily reminded that this is a B wave or X wave… or something. If you’re confused at the moment, then I won’t fret over the fact that I, a mere novice, am confused.
Hence the T-shirt I still await, “I really, really, really dislike B waves!”
A lot of possibilities and things changing / morphing all the time.
Yes indeed madam! 🙂
I have a feeling they are going to close that gap….
I remain most curious about the absence of greater selling pressure for this degree correction. It could be the slow build of momentum is gearing up for some serious droopage. This last ramp was intended to forestall margin calls. What now?
Kevin could be right.
If so, we revist those pivots.
Crashes usually start out slow and then snowball.
This could be options pin related. Peter T thinks ED.
Sir Charles got caught….ouch!.
Dxy is not stable and should be cause for concern.
In other words, I have no idea.
Yes he did. I thought those calls were dicey at best.
I and I mon a’ watching de pivots bwoy! 😀
Verne I can give you nice reggae rhythm on the guitar if you want to sing that for us! But no spliff for me mon protecting my lungs these day! BTW, bad fire in NorCal to the east 120 miles, and the easterlies are blowing, much of the northern CA coastal area is at RED health warnings re: being outside. Very smokey here in SF.
Cool! 🙂
RTOFL!!!! I love that. The voice of honesty!
I think I am going to wait for the cartel to fill that gap before I take the plunge…they just might!
Price hasn’t invalidated the main hourly. However, the depth of this iv under that count is quite out of proportion to the ii. That perhaps increases the likelihood price is under the alternate hourly, and this sell off was the X wave. In which case, watch our bears, “it’s a bear trap!”. Until that C down arrives.
That all said, I’m awaiting more data myself. In my recent experience, market tops surprise by being earlier than anticipated recently, rather than later. I think there’s still a reasonable (38.2%? lol!!) probability B up is complete here, even though we don’t have a WC from Lara as of yet supporting that. The RUT and NDX are pretty ugly today.
according to my wave count we are in wave C of the 4th wave correction of a 5 wave impulse up.
B would never be an impulse because it’s a 3 move corrective structure.
minimum target is 2775-2745
then we will start a the 5th wave impulse back up.
this is just my best guess but i think there is a good chance to truncate wave 5 ending just below the 100 day average some where around 2818-2830.
after that we will have a 3 wave corrective structure.
possibly taking us down to the lows for a retest.
move is going to be 2685- 2603.
then another 5 wave impulse. up this time breaking above the 100 day and 50 day averages.
this will be the final rally back to retest the highs 2875 to 2947
before we begin major C wave decent.
remember that B waves are corrective moves so they would not have a 5 wave impulse.
so it must be part of a larger structure.
5 wave impulse 3 wave correction ABC then 5 wave impulse.
A chart showing your count would be valuable. Getting it from your text is quite challenging. In fact, I even think it’s a forum policy if I’m not mistaken: if presenting an alternative (that isn’t extremely simply explained), show a chart please!
yeah, what Kevin said
I have responded to your comments yesterday with some suggestions and you have not acknowledged my responses nor my suggestions.
I have suggested that you need to post a chart if you are outlining an alternate wave count, because your text is very hard to follow.
If you cannot be bothered to post a chart for your idea, then do not expect others to take the time to consider it.
I have also suggested that you need to be clear on what degree of labelling you are mentioning.
Any further comments outlining your alternate wave count which is not accompanied by a chart and does not name degrees will be deleted.
Also, when others take the time to respond to your comments it would be polite to acknowledge their response.
Looking more impressive now!
into the gap we go…was it an exhaustion gap???
oh watch the RUT fall…glorious!
Indeed!
Man I really hate these pivot battles!
Decide already!!! 😀
Big cap stock after stock after stock have turned off 50% or 61.8%or 38.2% fibos of their retraces back up. Supporting a thesis that C down is on. AMZN, BA, BAC, CMCSA, CAT, I could through the entire alphabet finding these. JPM I mentioned a day ago. MA. Etc.
Man I sure hope you are right.
I am getting so tired of bankster ambushes that it’s making me paranoid!
kek!
This move down to me not all that impressive. This is not the way the heavy hitters take out pivots. I could be wrong, but I don’t think the bears are in charge….yet!
I’m certainly not sure either. Meanwhile, it’s down to knife work. Here’s the one minute view of the retrace back up…
This is the time to remember the adage, “top’s are a process, bottom’s are an event”. Top’s often begin with smaller and more tentative moves to start. Remember how for example the last Jan intermediate A down move started. First a small move down, then some sideways action…then a manic sell off. And of course the intermediate A of this P4 started slowly, and only after several days of mild selling did the downward momentum increase. Might be similar here.
We went to war with the banksters this week.
We were holding a huge bear call spread on SPY at 279.5/280.50
The assault was ferocious as they attempted to shake us out.
I think they got nervous about the massive put accumulation we used to defend their OpEx ambush. Those are some hombres muy, muy malos! 🙂
There was a huge call spread put on yesterday at 285 and 287.
We like to roll ’em! 🙂
Pretty strong down turns in all markets, and off key fibo’s in SPX and NDX. Pretty ugly AD counts for the markets too, 1-3 to 1-4 at the moment. More supporting evidence intermediate B up is complete…but yet more needed. A dueling day!
A turn at the overlapped fibos around 2920 now, including a major 61.8% and 50%. That could be consequential.
Let’s see how it progresses…
Just a typo – I think you meant 2820.
I am counting three waves up off the 2600 low. Currently in some 4th wave with 5 up to 2860 to follow.
Oops. What’s a hundred SPX pts between friends, really, though. Sorry!
I get you there Rodney. As I see it, it’s hanging in the balance at the moment, though. Perhaps there is a recovery here and push up. Perhaps.
BAM! Through my B wave lower trend line. Accumulating evidence B is done in my book. Getting through Wednesday big gap would seal the deal, though by then a fair chunk of B is already retraced.
That all said…this could be another iv or b etc.
Time for a view of the retrace landscape below, re: possible turn back up levels.
I expect the pivots to hold.
Any meandering, such as we are now seeing almost always means consolidation ahead of a move higher. The risk for bulls is we could get the turn in futures. There will be no mistaking the turn when it comes, now that we have at least two significant pivots to demolish. Have a wonderful week-end everyone!
Yes! #1
Have a great evening everyone. BTW, just a reminder, US markets are closed this Monday in honor of Veterans Day. Therefore, no Black Monday. How about a Black Tuesday?
Dear Rodney, Actually US markets are opened Monday, Veterans Day.
https://www.nyse.com/markets/hours-calendars
Gives us more time to reach the 2873 target.
Did you get that info on CNN?
No, Ian, I did not. But now that I’ve done a bit more checking, it looks like NYSE and other markets are open even thought government office are not.
Sorry for any confusion.
That was meant to be funny, not mean btw.
I suspect he got that news from the Mouth of Sauron, She who only utters False News and presents doctored videos. You’d almost think there was a policy of disinformation out of Mordor. Ha. Ha.