
More upwards movement fits the mid-term expectation for the Elliott wave count, although another test of support was expected first.
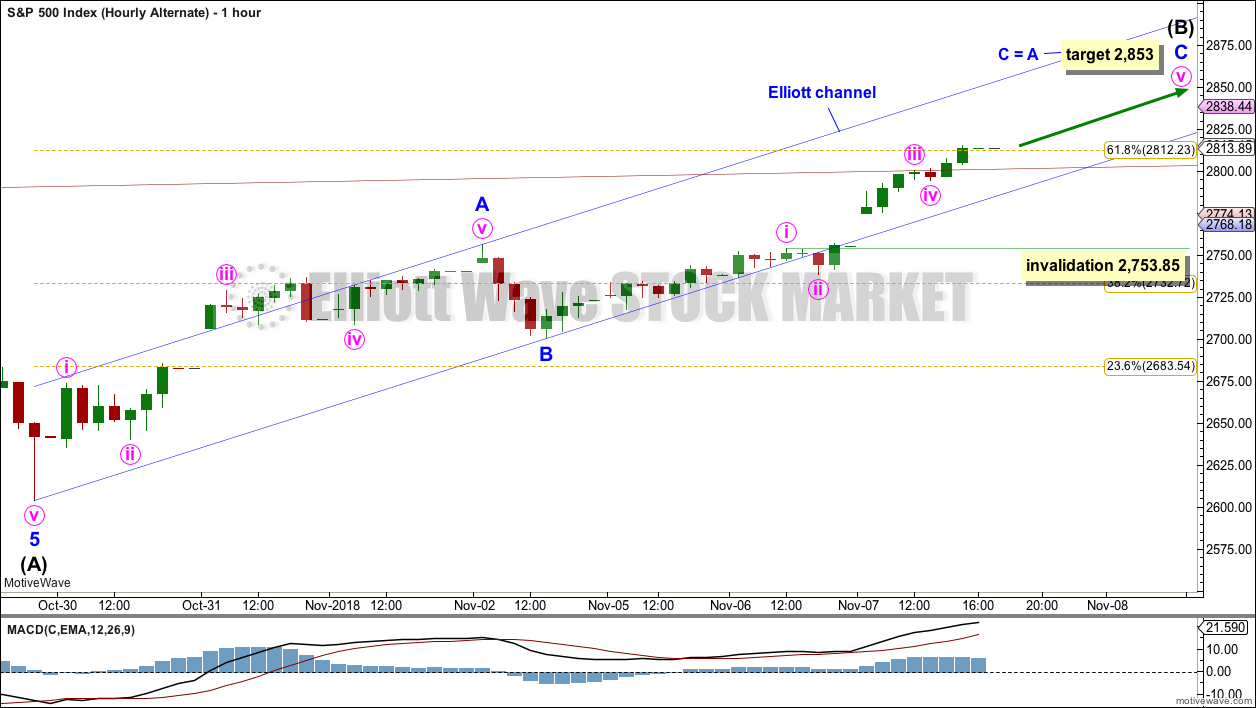
Summary: The target for this bounce to end is now 2,853. If this target is wrong, it may be too low; a range for a possible high is from from 2,873.54 to 2,890.38, with the lower edge of this zone favoured as there is strong resistance about 2,875.
A primary degree correction should last several weeks and should show up on the weekly and monthly charts. Primary wave 4 may total a Fibonacci 8, 13 or 21 weeks. Look for very strong support about the lower edge of the teal trend channel on the monthly chart.
Primary wave 4 should be expected to exhibit reasonable strength. This is the last multi week to multi month consolidation in this ageing bull market, and it may now begin to take on some characteristics of the bear market waiting in the wings.
The final target for this bull market to end remains at 3,616, which may be met in October 2019.
New updates to this analysis are in bold.
The biggest picture, Grand Super Cycle analysis, is here.
Last published monthly chart is here, video is here.
ELLIOTT WAVE COUNT
WEEKLY CHART
Click chart to enlarge.
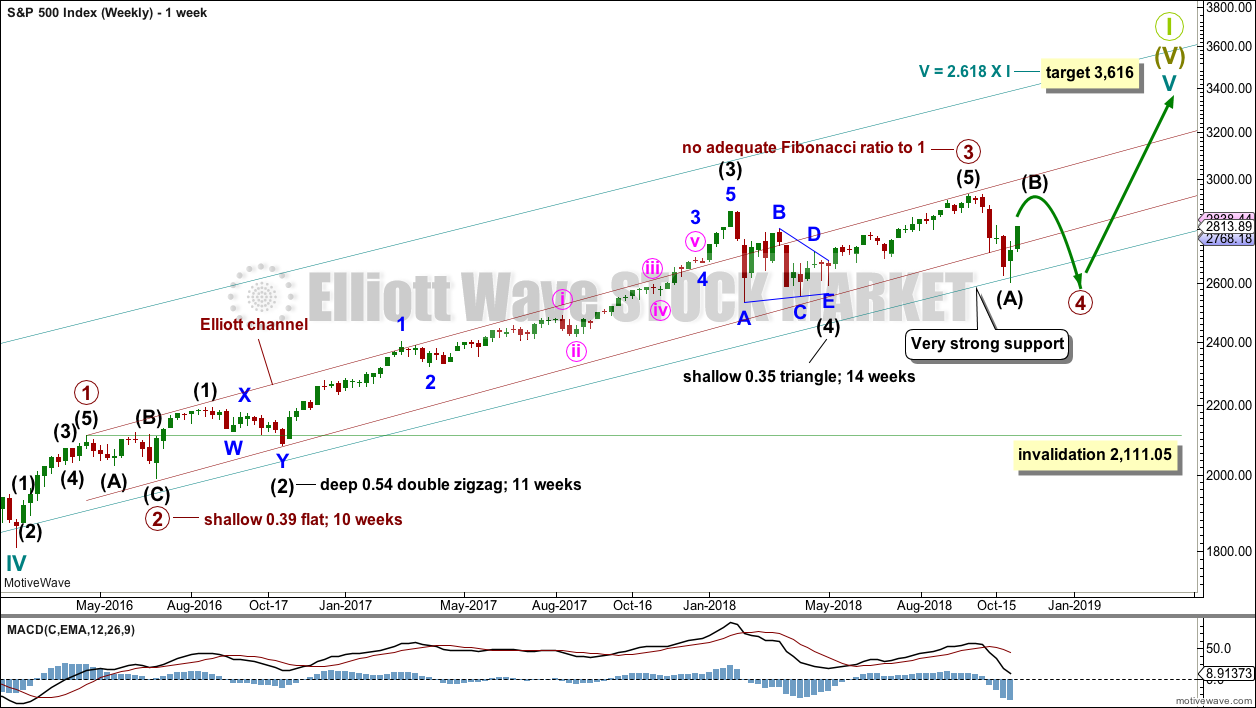
Cycle wave V must complete as a five structure, which should look clear at the weekly chart level and also now at the monthly chart level. It may only be an impulse or ending diagonal. It is clear it is an impulse.
Within cycle wave V, the third waves at all degrees may only subdivide as impulses.
Within primary wave 3, there is perfect alternation and excellent proportion between intermediate waves (2) and (4).
The maroon channel is drawn about primary degree waves. The first trend line is drawn from the ends of primary waves 1 to 3, then a parallel copy is placed upon the low of primary wave 2. The overshoot of the upper edge of this channel by the end of intermediate wave (3) looks typical. For the S&P, its third waves are usually the strongest portion of an impulse; they often exhibit enough strength to overshoot channels.
Primary wave 4 now has an overshoot on the lower edge of the channel. This is acceptable; fourth waves are not always neatly contained within channels drawn using this technique.
Primary wave 4 may find very strong support about the lower edge of the teal channel, and it looks like this is from where price may be bouncing. This channel is copied over from the monthly chart and contains the entire bull market since its beginning in March 2009. While Super Cycle wave (V) is incomplete, this channel should not be breached at the weekly chart level.
Primary wave 4 may not move into primary wave 1 price territory below 2,111.05.
When primary wave 4 may be complete, then the final target may be also calculated at primary degree. At that stage, the final target may widen to a small zone, or it may change.
At this stage, the expectation is for the final target to be met in October 2019. If price gets up to this target and either the structure is incomplete or price keeps rising through it, then a new higher target would be calculated.
DAILY CHART
Click chart to enlarge.
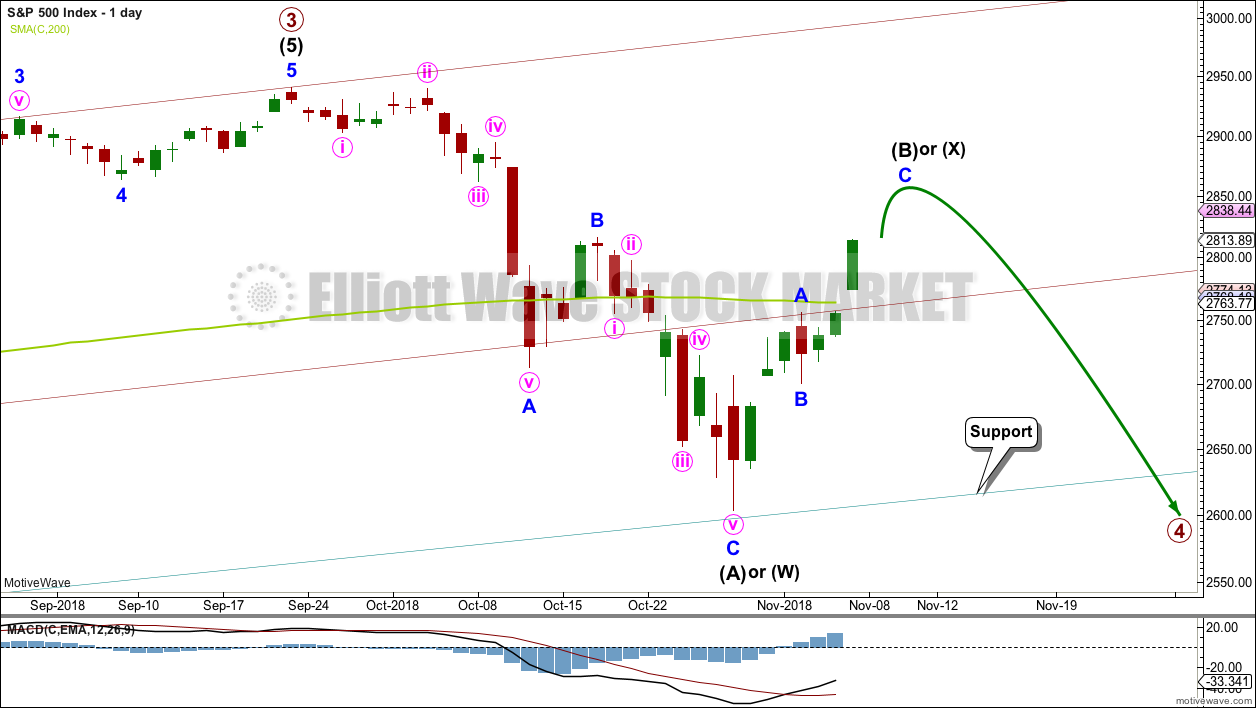
Primary wave 4 would most likely end somewhere within the price territory of the fourth wave of one lesser degree. Intermediate wave (4) has its price territory from 2,872.87 to 2,532.69. Within this range sit the 0.236 Fibonacci ratio at 2,717 and the 0.382 Fibonacci ratio at 2,578.
The 0.382 Fibonacci ratio would expect an overshoot of the teal channel. This may be too low; price may find support at the lower edge of the channel. However, as primary wave 4 should be expected to exhibit reasonable strength, it may be able to overshoot the channel and that would look reasonable. This possibility is now more seriously considered.
Primary wave 2 unfolded as a shallow regular flat correction lasting 10 weeks.
Intermediate wave (A) may be seen as a complete zigzag. A zigzag down to start primary wave 4 may also be labelled intermediate wave (W).
If intermediate wave (A) or (W) subdivide as a zigzag, then primary wave 4 may unfold as a double zigzag, double combination, flat or triangle. Of all these possible structures a flat correction would be least likely as that would not offer structural alternation with the flat correction of primary wave 2.
A double zigzag would also be less likely as that would require a very large overshoot of the teal trend channel, and it would also see a relatively brief primary wave 4.
A triangle would be fairly likely even though intermediate wave (4) was a triangle. This does not reduce the probability of primary wave 4 also subdividing as a triangle.
A double combination should always be considered if a triangle is possible, and this would also offer reasonable alternation with primary wave 2.
All structural options (except a double zigzag) which begin with a zigzag down would expect a high bounce for intermediate wave (B) or (X). Intermediate wave (B) or (X) would most likely subdivide as a zigzag.
Within a triangle for primary wave 4, intermediate wave (B) would most likely be about 0.8 to 0.85 the length of intermediate wave (A) giving a target range from 2,873.54 to 2,890.38. Intermediate wave (B) of a running triangle may make a new high above the start of intermediate wave (A). The target calculated today would see intermediate wave (B) about 0.74 the length of intermediate wave (A); although this would be a little shorter than the most common length, it would still be acceptable.
Within a double combination for primary wave 4, intermediate wave (W) may be the first complete structure in a double. Intermediate wave (X) may be a very high bounce and may make a new high above the start of intermediate wave (W). There is no minimum requirement for the length of intermediate wave (X), and no maximum limit. The target calculated today for intermediate wave (X) would see it as a reasonably high bounce; this would give a combination the right look.
For both of the more likely options of a triangle or combination for primary wave 4, price may continue to find support about the lower edge of the teal trend channel. This would give the wave count the right look at the monthly time frame.
HOURLY CHART
Click chart to enlarge.
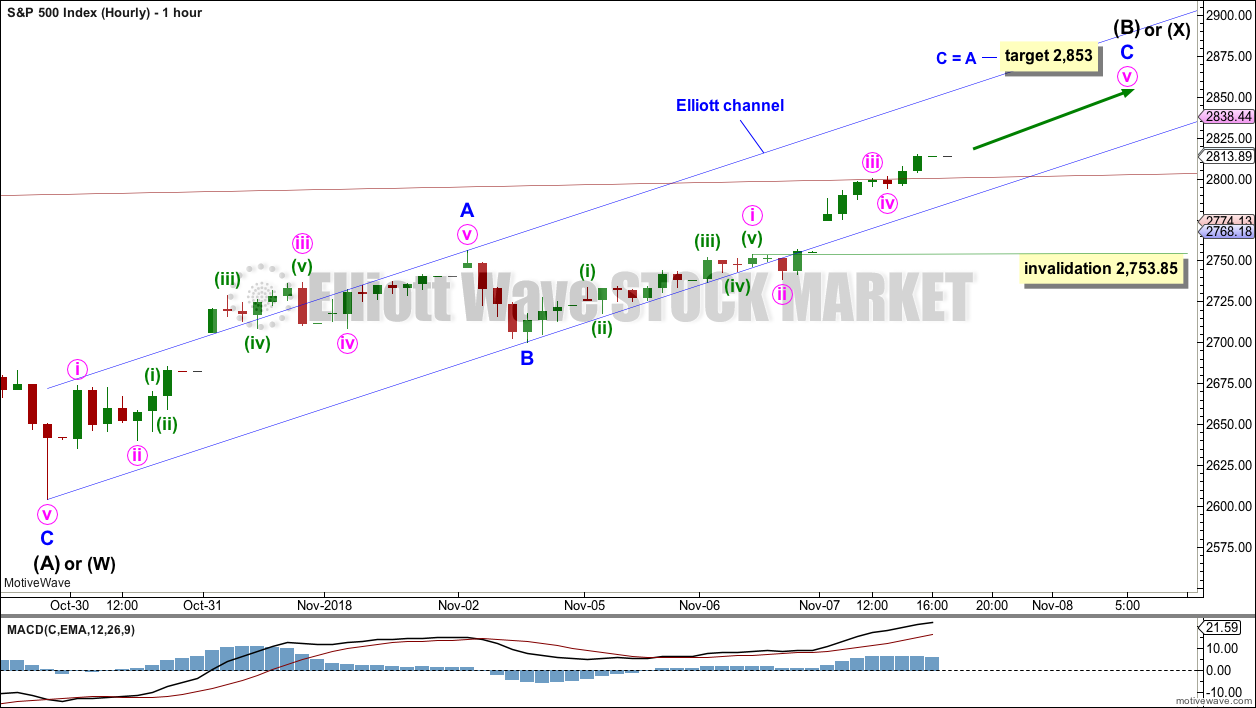
Intermediate wave (B) or (X) would most likely subdivide as a single or multiple zigzag to achieve a high bounce.
Within the zigzag, minor wave B may have been a relatively brief and shallow zigzag. The target for minor wave C expects it to exhibit the most common Fibonacci ratio to minor wave A.
Within minor wave C, if minute waves iii and iv are not over and minute wave iv is yet to unfold, then minute wave iv may not move into minute wave i price territory below 2,759.85.
If the target at 2,853 is wrong, it may not be high enough. Intermediate wave (B) or (X) may be a higher bounce that ends within the range most common for B waves within triangles: between 2,873.54 to 2,890.38.
Draw a channel about this upwards movement using Elliott’s technique for a correction. Minor wave C may end either mid way within the channel or about the upper edge. A clear breach of the channel by downwards (not sideways) movement would be an early indication that intermediate wave (B) or (X) may be over.
ALTERNATE WAVE COUNT
DAILY CHART
Click chart to enlarge.
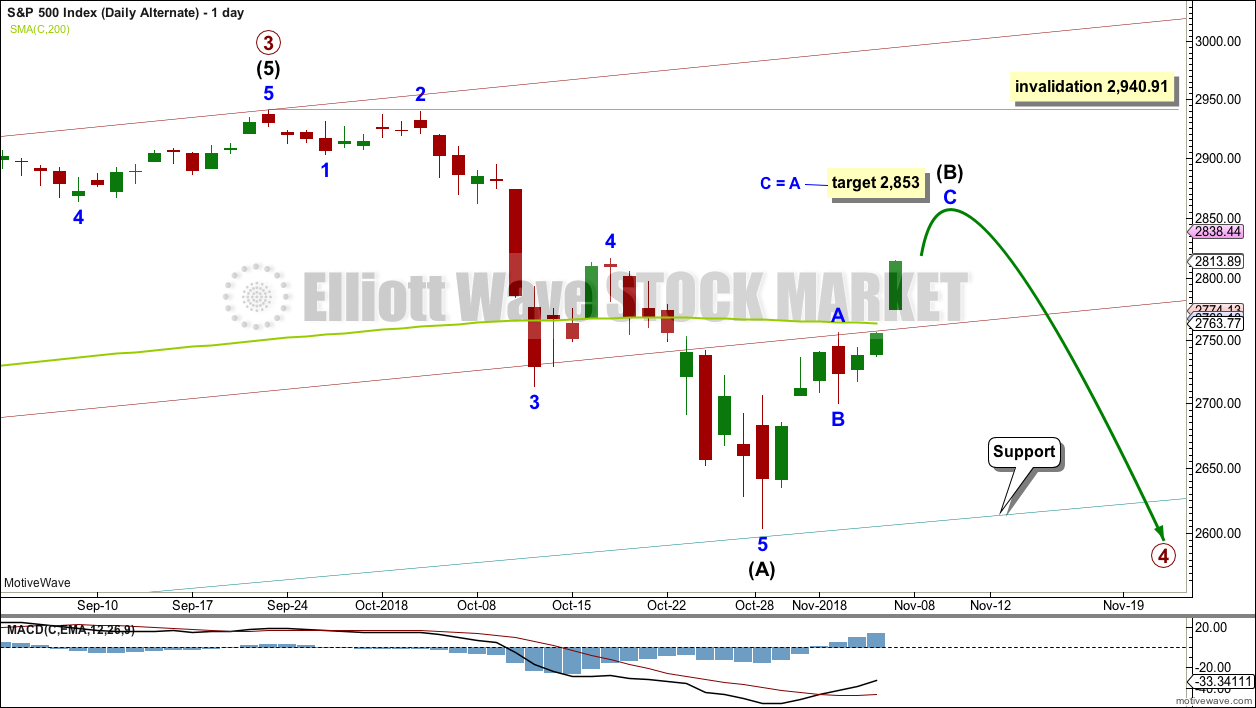
It is also possible to see the downwards wave labelled intermediate wave (A) as a complete impulse. If intermediate wave (A) is a five wave structure, then intermediate wave (B) may not move beyond its start above 2,940.91.
Primary wave 4 may be a zigzag to provide structural alternation with the flat correction of primary wave 2; intermediate wave (A) within a zigzag must subdivide as a five wave structure.
Primary wave 4 may not move into primary wave 1 price territory below 2,111.05.
This wave count would expect to see at its end a large overshoot of the teal channel for the end of primary wave C, so that it moves below the end of primary wave A and avoids a truncation. This looks less likely; this is one reason why this wave count is judged to have a lower probability and is labelled as an alternate.
HOURLY CHART
Click chart to enlarge.
At this stage, both wave counts expect a zigzag for intermediate wave (B) may be unfolding higher. The structure, invalidation point, target and channel are the same.
TECHNICAL ANALYSIS
WEEKLY CHART
Click chart to enlarge. Chart courtesy of et=”_blank”>StockCharts.com.
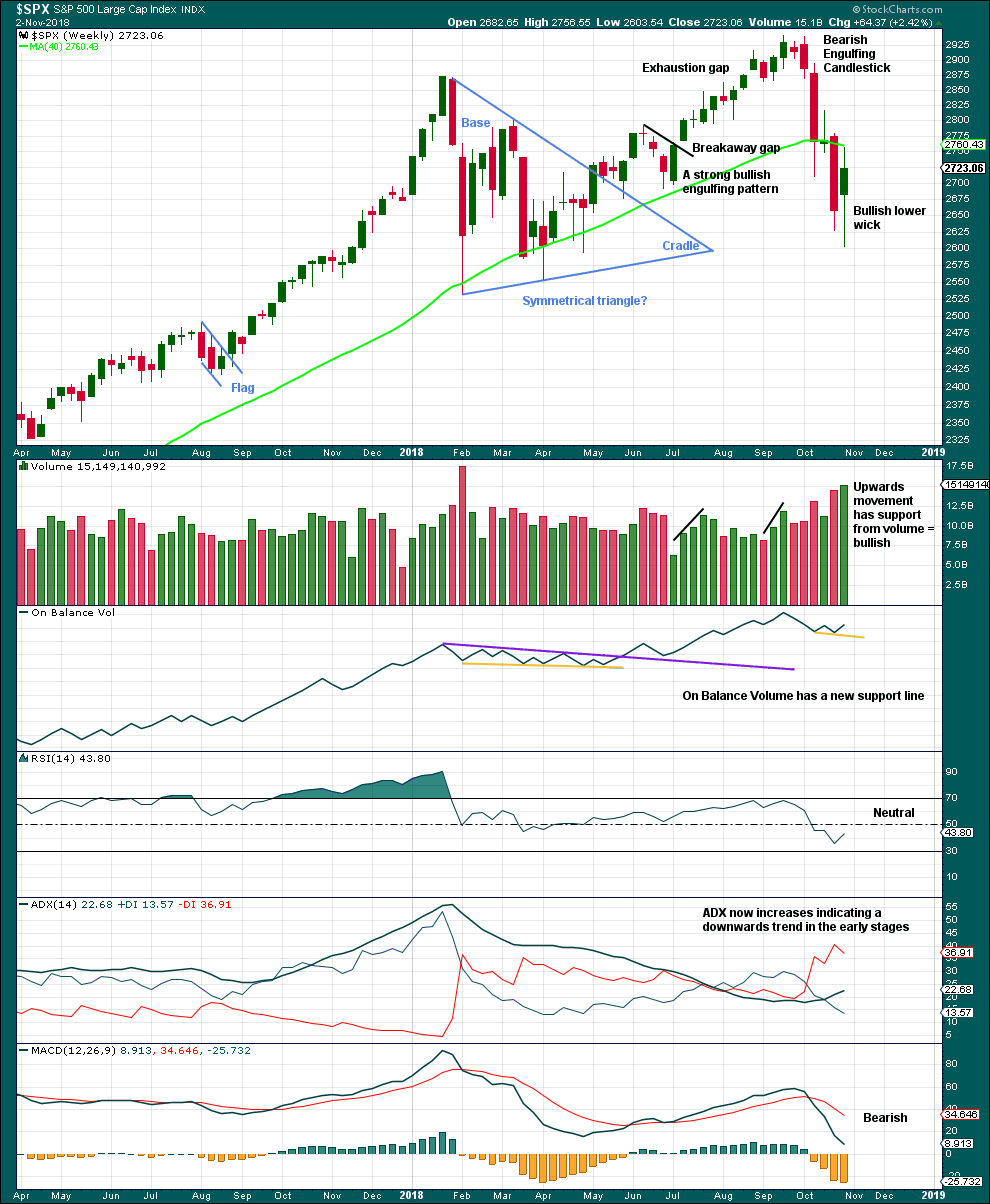
Another long lower wick and support from volume last week looks bullish again.
The support line for On Balance Volume is removed and redrawn.
DAILY CHART
Click chart to enlarge. Chart courtesy of StockCharts.com.
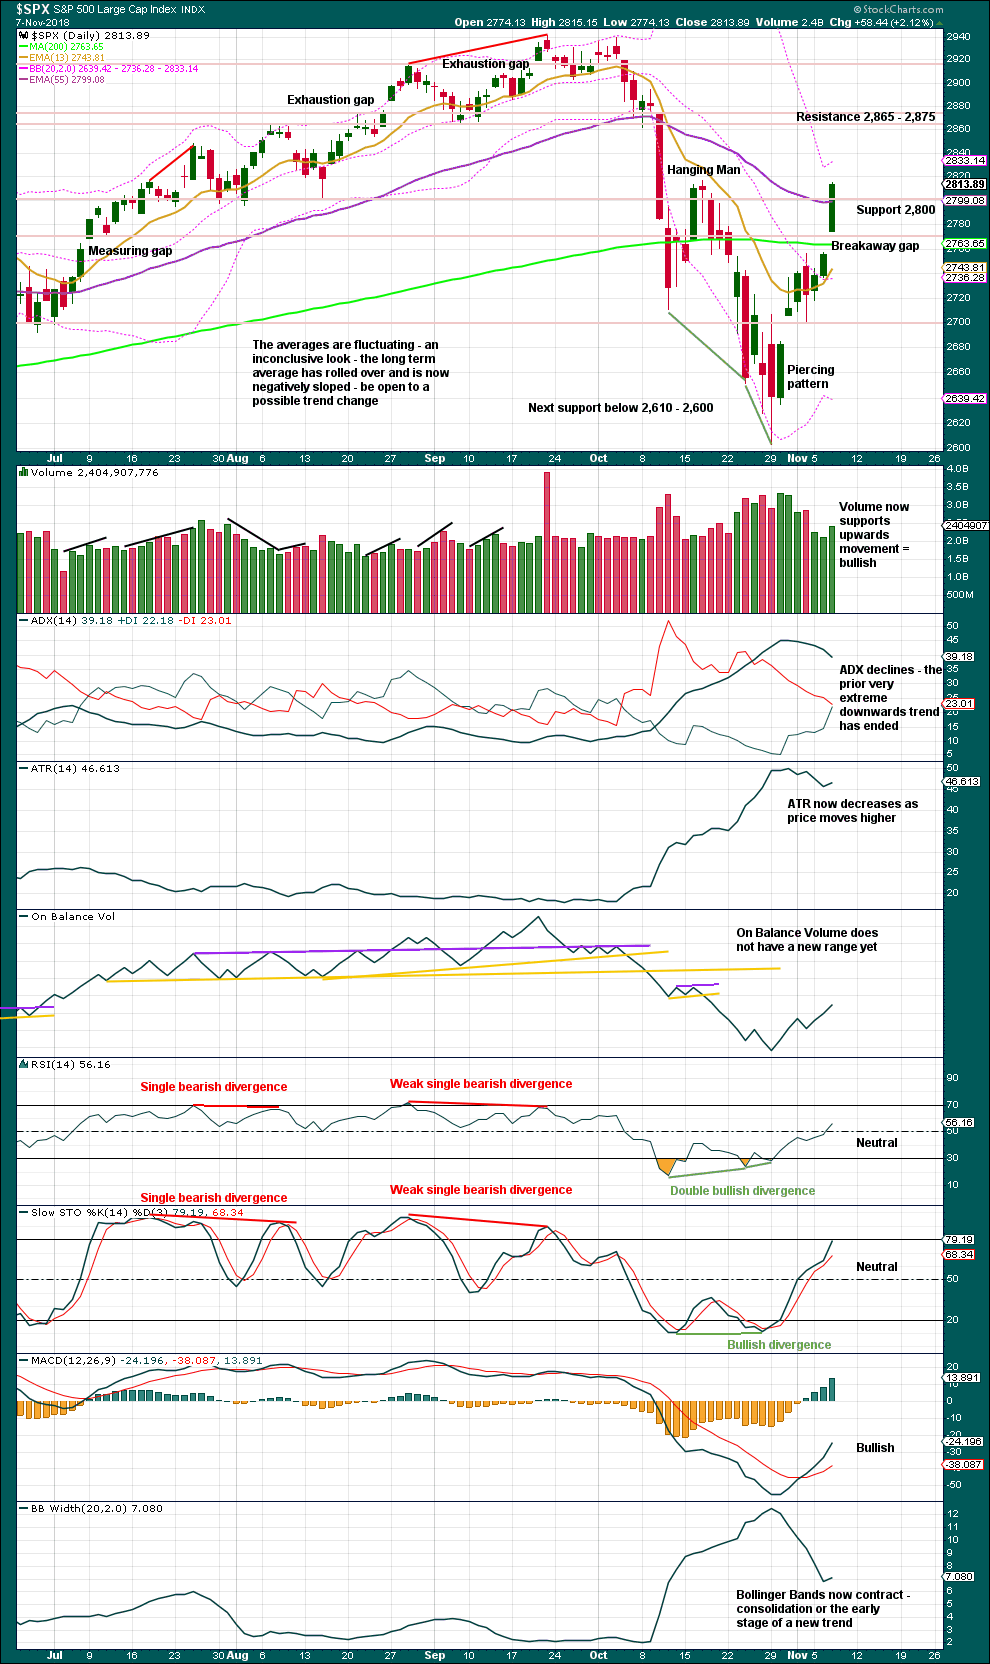
Today completes an upwards day (which breaks above a small consolidation) with support from volume. The breakaway gap may be expected to offer support about 2,756.82. However, there is strong support now closer by about 2,800.
Look now for upwards movement to continue to resistance about 2,765 – 2,875.
BREADTH – AD LINE
WEEKLY CHART
Click chart to enlarge. Chart courtesy of StockCharts.com.
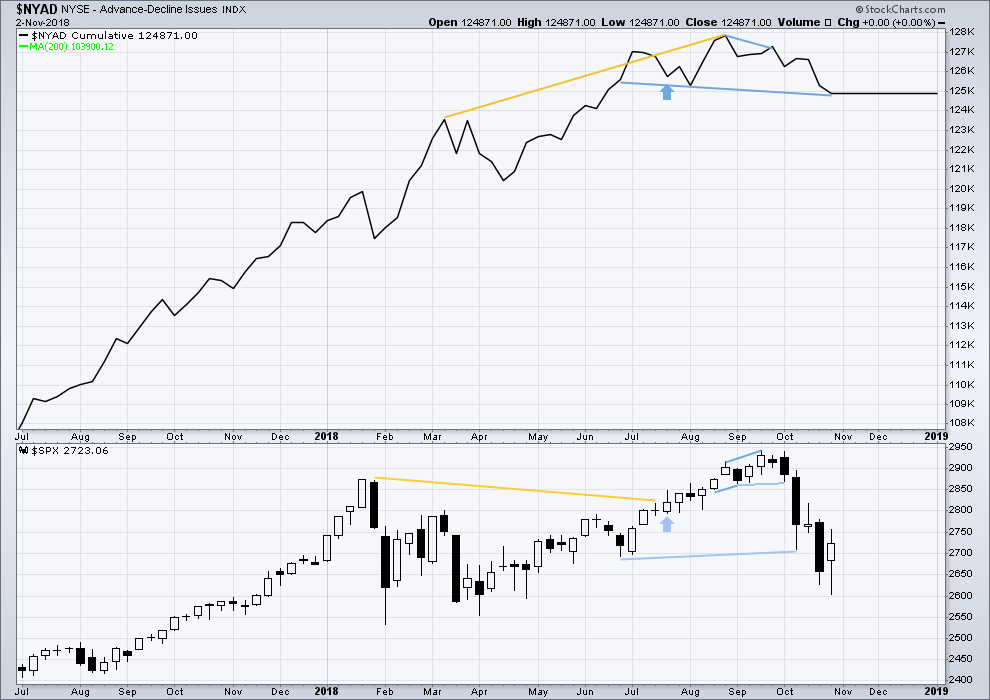
Falling price has support from a decline in market breadth. Breadth is falling in line with price. There is no divergence either way.
DAILY CHART
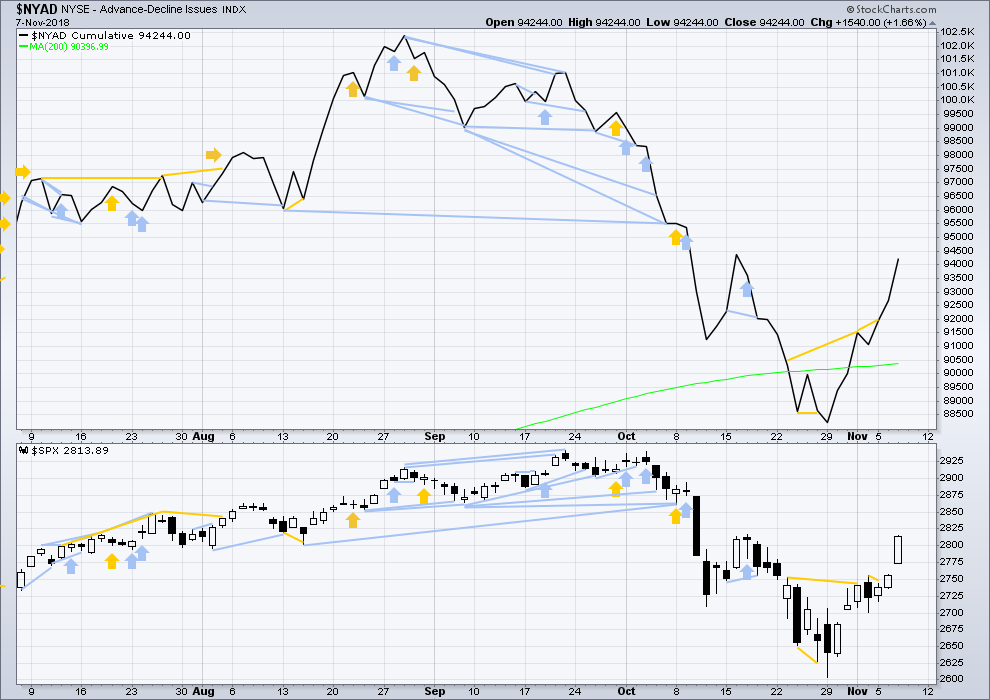
Click chart to enlarge. Chart courtesy of StockCharts.com.
There is normally 4-6 months divergence between price and market breadth prior to a full fledged bear market. This has been so for all major bear markets within the last 90 odd years. With no longer term divergence yet at this point, any decline in price should be expected to be a pullback within an ongoing bull market and not necessarily the start of a bear market. New all time highs from the AD line on the 29th of August means that the beginning of any bear market may be at the end of December 2018, but it may of course be a lot longer than that. My next expectation for the end of this bull market may now be October 2019.
Breadth should be read as a leading indicator.
Bullish divergence noted two sessions ago has been followed by upwards movement. There is no new short term divergence with the high today in price and the AD line. Upwards movement today has good support from rising market breadth.
VOLATILITY – INVERTED VIX CHART
WEEKLY CHART
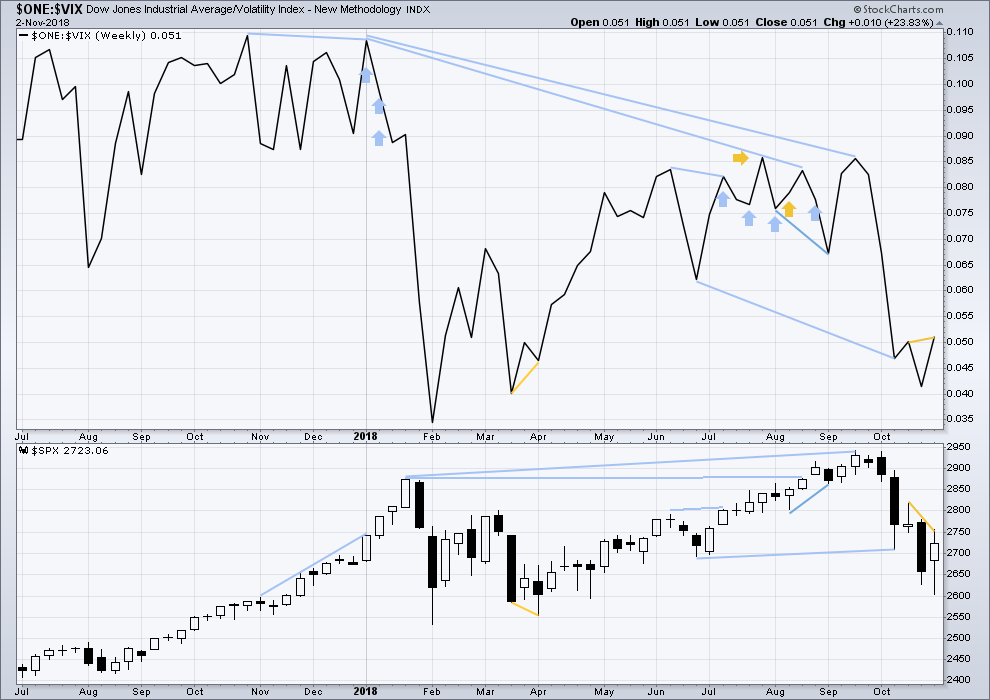
Click chart to enlarge. Chart courtesy of StockCharts.com. So that colour blind members are included, bearish signals
will be noted with blue and bullish signals with yellow.
Last week inverted VIX has made a new high above the prior swing high two weeks ago, but price has not. This divergence is bullish.
DAILY CHART
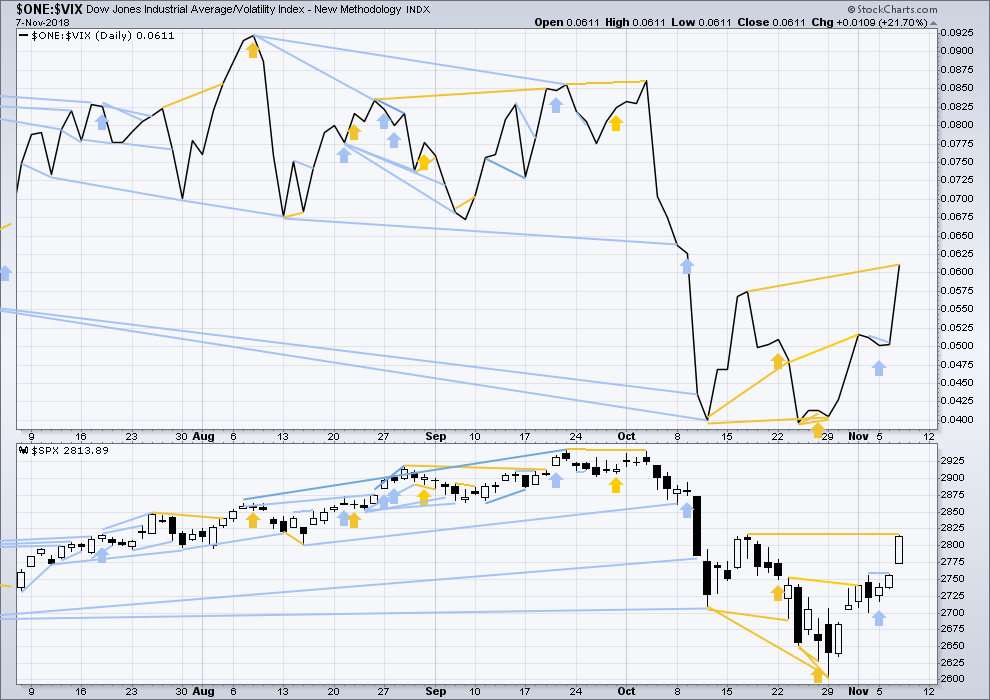
Click chart to enlarge. Chart courtesy of StockCharts.com. So that colour blind members are included, bearish signals
will be noted with blue and bullish signals with yellow.
Normally, volatility should decline as price moves higher and increase as price moves lower. This means that normally inverted VIX should move in the same direction as price.
Bearish divergence noted in last analysis has not been followed by any downwards movement. It is now considered to have failed.
Today inverted VIX has made a reasonable new high above the prior swing high of the 24th of October, but price has not by a small margin. This divergence is bullish; VIX may be falling faster than price.
DOW THEORY
The following lows need to be exceeded for Dow Theory to confirm the end of the bull market and a change to a bear market:
DJIA: 23,344.52.
DJT: 9,806.79.
S&P500: 2,532.69.
Nasdaq: 6,630.67.
Published @ 07:24 p.m. EST.
—
Careful risk management protects your trading account(s).
Follow my two Golden Rules:
1. Always trade with stops.
2. Risk only 1-5% of equity on any one trade.
Which one of you swept up all the $250/$251 SPY puts at 1:33pm EST today?
He!He!
Shhhhhh…!!!! 🙂
JPM did a perfect hit and turn off it’s biggest retrace 61.8% price level today (112.97 or thereabouts).
I’m going to move the degree of labelling within the zigzag down one degree and label intermediate (B) or (X) as a possible double zigzag today.
Double zigzags are fairly common structures, and a double zigzag would have the ability to create a high bounce.
I’m doing this because the small red candlestick today looks like a correction at the same degree or one higher than the last red daily candlestick. To label this candlestick today as part of minor C (as in the wave count published above) doesn’t look as right.
Bailed on my collection of long SPY commons and options. $11 move I grabbed. Wouldn’t be surprised to see $286, but I am happy with $281.
well played! I couldn’t agree more with the cautionary exit here. The surge for the exits might be starting Real Soon Now.
Quick ramp to $286 and I’ll be REAL interested in grabbing some puts.
I have never quite figured out why you get such remarkable profits trading counter-trend bounces during bear markets. It is generally attributed to short- covering but I doubt that is the entire story. The long calls in this down-trend have done as well as my puts even with a much smaller lot size. How strange. Some traders don’t bother to trade the counter-trend ramps an leave a lot of dough on the table.
The first big wave down breached the 200 day SMA then briefly reclaimed it for three trading session before surrendering it once more. This will be our second day above that important MA.
Start of a C down should breach it as well as 2800…..
Don’t be in the least bit surprised by another cash dump as we approach the pivots….
For short term traders, the banksters are trying to set up bear traps. The heavy hitters are going to make their presence known with a smash of the 2800 pivot.
While we continue to trade above, or even close beneath it market dips are nothing but bankster bait. Best to wait from the signal from the “Big Boys”…….
The 1.27% extension in NDX is still holding, and the overlapped fibos around 2820 in SPX. RUT is a bit in no man’s land, a ways below some overlapped fibos at 1600.
This is starting to smell like a big sell off right around the corner consistent with our shy intermediate C. It’s ready, aim, aim, aim time. I could be wrong; maybe there is another leg up here. But I’m suspecting high momentum down in what, oh, about 60-70 minutes from now. We’ll see!
That is what I thought we would see this session.
The sideways coil looks to me like they are setting traders up for one more ramp higher and will launch the reversal either in futures or after Fedspeak.
I am accumulating more Nov 30 275 strike puts which have highest open interest….or is that me??!! 😀
Tend to agree with more north to come, that being said… I don’t think it drops today/tonight.
Man you give away secrets/pearls, lol…..Everyone owes Verne multiple beers!
🙂
The next congestion area, above the current price and nearest in time, has its bottom boundary around 2860. I am thinking we will go to the underside of the congestion area or slightly into it to end the current Minor C. This is a bit above Lara’s target.
That would be loverly….cheaper puts! 🙂
Ok so in order to move higher we have to break through the 100 day moving average and the 50 day.
we are in a major b wave structure if i’m Correct?
So the move should be corrective not impulsive.
The count would be 5 – 3 – 5
I think everyone thinks this is feb 2018 and wave B hits it’s target on the first try. Remember vix was over 50 at the low. The low here was vix 28
First attempt usually fails to reach target. Then a correction A B C then a second impulse.
B waves are counter trend and corrective in structure.
A – waves would be 5 waves in the trend B -wave is correcting A then C wave corrects B.
After completing a 5 wave pattern of the 2009 lows we should expect A major A- wave followed by a major B wave then a major C wave.
If the market is bullish enough to handle this correction and that means hold the lows or 2532 even then I think we will have and extended wave. So we would have a extra 1000 points from the lows. This would then complete around 2020.
Remember that the major C wave coming is a brutal one. It wants to break trend. So everyone is acting like this rally is real when it is a fake.
I can’t say if we will hold the lows or not.
SPX is in an intermediate (an elliott wave term) B up. “major” is not an elliott wave term, so it’s not clear what you mean by “major”.
Both the daily charts above show the ABC structure of the intermediate B. Price is now in the C wave up of the ABC intermediate B. Where it ends is the question of the day/hour.
Then there’s going to be an intermediate C back down. Which as you cite will be impulsive (5 wave structure). What the ultimate low of the intermediate C down will be is unknown, because of the wide variety of forms the overall primary 4 can take. zig-zag, it’ll under cut the recents, triangle, it won’t, etc.
That will complete a primary 4 down. Then a primary 5 should launch, taking SPX to new all time highs. When THAT is complete, the 5 wave structure from the 2009 lows are complete. More significantly, per Lara’s Grand Super Cycle model, the ENTIRE US STOCK MARKET OVER ITS HISTORY completes a GSC wave 1. Best current estimates per Lara are a high of 3600 in SPX (or so), and complete in Oct 2019.
What happens after that, I won’t speculate here, but it won’t be pretty.
I hope this helps orient you.
Good job, Kevin, on both your clarity and your kindness in both your replies today to “samsoundguy.” Yeah, I noticed… with much appreciation. Hats off to you, sir!
As we say in the pool world, “we’re all on the path to elliott wave (pool) heaven! some of us are here, some of us are there, some are movin’ forward, some are movin’ backward”. Lol!!!
Thanks Curtis.
Hi Kevin
Do you think 3600 is a pretty high target?
In my opinion we will be lucky if it can make it to 3200.
There’s also the possibility that the ATH is already in.
Time will only tell.
I think it’s a pretty high target.
At this time I can only calculate the target at cycle degree.
When primary wave 4 is over and I know where primary wave 5 begins from, at that stage I can calculate the target at primary degree also.
At that stage the target at 3,600 may change, or I may have a new lower target and so have two targets.
I do hope this makes sense, and I do hope members fully understand how I’m doing this. I’ll try and make it really clear in my video tomorrow.
You’re outlining a zigzag. 5-3-5
But that’s not the only Elliott wave corrective structure.
What about a triangle?
I’m also wondering if you are confusing the different degrees I’m trying to follow here.
I’m going to have to ask you please to be specific as to which Elliott wave degrees you are referring to. Intermediate? Primary? Or cycle or Super Cycle? Because it looks like your comment is covering more than one of these, but you’ve not named them. So your comment is unclear.
I’m also going to have to really stress that if you are outlining a possible alternate Elliott wave count in your comment that it must be accompanied by a chart. You can upload charts in this comment section.
Question: will the C wave down be matched by a strong bull run in gold?
i hope so….
If it is a fourth wave, the move up in Gold will probably be corrective, and head back down to around 1130 before we get an extended bull run. If we have a market top, as some analysts believe, PMs are taking a rocket ship to Andromeda…! 🙂
Copper has been under heavy accumulation.
Verne, would you mind if I messaged you privately? If so, please e-mail me at market_manipulator@yahoo.com
Would love to have your thoughts on a particular topic.
O.K.
Looking at NDX, I think we have one more wave up as move down there not looking at all impulsive. We will have to wait for FED blather it seems…Oh, well. Keep powder dry… 🙂
Cash dumps at the pivots. Unless the bears respond this a.m, we are going higher in an extending fifth wave….
Wow! Final wave up has third wave of possible ED (DJIA) exceeding first wave by less than one point! Talk about cutting it close! That’s all she wrote it would appear….
There is potential the intermediate B up is going to turn at/underneath the major overlapped 61.8% and 50% retrace levels at 2819-2821. I believe the structure of B can be characterized as complete here. If price pushes through, then no. But if price turns at/just beneath and starts generated sell triggers (swing lows violated, trend lines violated, lower swing lows/highs = “polarity inversion”) then very much perhaps short game on.
Either the banksters dump cash at 2800, or we get an impulsive move down through it. That will be your sell signal.
That will be a goot one, mon!!! The battle certainly is raging here. Classic triangles on the 5 minute SPX and NDX.
Yep. The banksters are being dragged kicking and screaming to the impending C or third down…they might be able to hold things off one more day for FED speak.
NDX will reverse its decline if that is what we have…
My view of the higher potential turn levels in NDX.
The 61.8% at 7263 stands out (QQQ = 177.1).
The strongest wave of this possible primary decline should be imminent. Some analysts even think we are in a second wave up with a third down on deck. The move back above round numbers DJIA 26K amd SPX 2.8K is truly fascinating. High degree trend changes often signal their arrival by demolition of MULTIPLE support pivots on initial waves down. Deep pockets buying has so far limited downside momentum during this primary degree correction. If it is indeed a P wave, the next wave down will not only slice through 2800, but 2700 as well. Have a great trading day!
Dear Lara
so I was really curious as to why you labeled B-A and the B-B but you decided to excluded the C wave. I was too looking for the C wave to complete the formation.
I guess my problem i’m Having is with just an A-B correction. Can you please explain why you decided that we are just going to skip it.
The first thing that came to my mind is this.
What if wave 3 of the lows ended @ 2766 and wave A was just wave 4 correction. Then wave 5 was extended.
Don’t you think it’s weird that wave A then wave B would be almost 200% bigger that wave A?
B wave forms are usually 5-3-5
12345 – abc -12345
Plus your saying that wave C will just not occur?
In feb 2018 we got a 150 point retracement from the the highs of the first leg up after we corrected back down then went back up slightly higher. This happened before wave C took us back down to the lows.
is it a possibility that the abc correction of wave b up has not taken place
I just think it’s wierd that you just disregarded C. Instead of a recount of your waves.
Can you explain what rule states single correction of A-B.
Also the other thing is why you are so confident that we are going to stay above 2600 when C wave ends.
Also if the bottom of 2600 holds why would that be 4
As don’t you think it could be an extended wave 5 formation
The other thing i’m Wondering is this.
Also why do you we will hold the bottom at 2603 on a c wave correction.
C should be correcting the
Why don’t you think S&p 500 1500
This cycle has 5 Waves
Wouldn’t a major market rest be good for the market
This would mean that this bull market is wave 1 of super cycle.
Correction 2 1500 being wave 2 of super cycle and next bull market being super cycle wave 5-3?
Also the fed must think the market is a joke. We freak out and go down 10% every time the fed worries us. Why would they stop raising rates. This means that the fed is only going to put more rates in the forecast and ignore the market. So if we retest the low and hold 2600 the fed has no worry to stop the interest hiking cycle.
So if we hold the lows we should be on 5th wave extension which form the math would be 1000 points from the low.
3600 s&p 500.
If we don’t hold the lows
2200 to 1500 s&p 500
If B wave does not make a new high won’t the top of the market look like a head and shoulders pattern.
Note sure how you reached a conclusion that Lara is suggesting that an AB structure with no C. I’m 100% certain she is not. If she didn’t include a matching C, that’s because it completes a higher level structure and she shows that completing instead; the C is implied. No one knows EW rules better than Lara.
Just because there is not a (C) sitting above the maroon 4 (circle) label, does not mean I do not expect (C).
The big arrow down kinda outlines that?
That’s how Motive Wave shows labels. The (C) label will only show up when it can see the end of (B).
“What if wave 3 of the lows ended @ 2766 ” this makes absolutely no sense to me. If you are suggesting another wave count then please provide a chart. I cannot follow your comment.
When I do the end of week video tomorrow I will outline the possible pathway for different structures for primary wave 4. They all include C waves. A triangle also includes D and E waves.
1
Looks like I should go long overnight…. goodness