
A breakout of the channel on the hourly charts indicated a low was most likely in place. More upwards movement was expected at that stage, which has happened.
Summary: A breach of the blue channel offers some confidence that a low is most likely in place. Look for a small pullback tomorrow to find support now at the upper edge of the blue channel, with today’s gap offering support at 2,865.43.
A primary degree correction should last several weeks and should show up on the weekly and monthly charts. Primary wave 4 may total a Fibonacci 8, 13 or 21 weeks. Look for very strong support about the lower edge of the teal trend channel on the monthly chart.
Primary wave 4 should be expected to exhibit reasonable strength. This is the last multi week to multi month consolidation in this ageing bull market, and it may now begin to take on some characteristics of the bear market waiting in the wings.
The final target for this bull market to end remains at 3,616, which may be met in October 2019.
New updates to this analysis are in bold.
The biggest picture, Grand Super Cycle analysis, is here.
Last published monthly chart is here, video is here.
ELLIOTT WAVE COUNT
WEEKLY CHART
Click chart to enlarge.
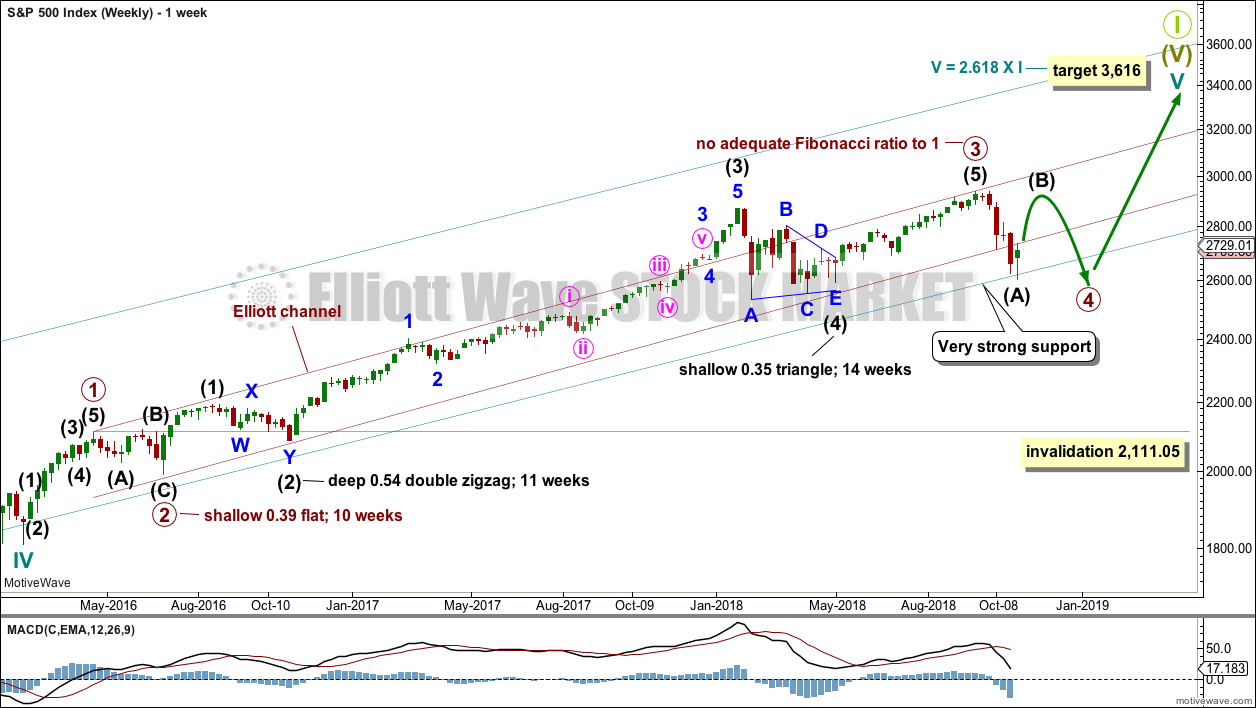
Cycle wave V must complete as a five structure, which should look clear at the weekly chart level and also now at the monthly chart level. It may only be an impulse or ending diagonal. It is clear it is an impulse.
Within cycle wave V, the third waves at all degrees may only subdivide as impulses.
Within primary wave 3, there is perfect alternation and excellent proportion between intermediate waves (2) and (4).
The channel is now drawn about primary degree waves. The first trend line is drawn from the ends of primary waves 1 to 3, then a parallel copy is placed upon the low of primary wave 2. The overshoot of the upper edge of this channel by the end of intermediate wave (3) looks typical. For the S&P, its third waves are usually the strongest portion of an impulse; they often exhibit enough strength to overshoot channels.
Primary wave 4 now has an overshoot on the lower edge of the channel. This is acceptable; fourth waves are not always neatly contained within channels drawn using this technique.
Primary wave 4 may find very strong support about the lower edge of the teal channel, and it looks like this is from where price may be bouncing. This channel is copied over from the monthly chart and contains the entire bull market since its beginning in March 2009. While Super Cycle wave (V) is incomplete, this channel should not be breached at the weekly chart level.
Primary wave 4 may not move into primary wave 1 price territory below 2,111.05.
When primary wave 4 may be complete, then the final target may be also calculated at primary degree. At that stage, the final target may widen to a small zone, or it may change.
At this stage, the expectation is for the final target to be met in October 2019. If price gets up to this target and either the structure is incomplete or price keeps rising through it, then a new higher target would be calculated.
DAILY CHART
Click chart to enlarge.
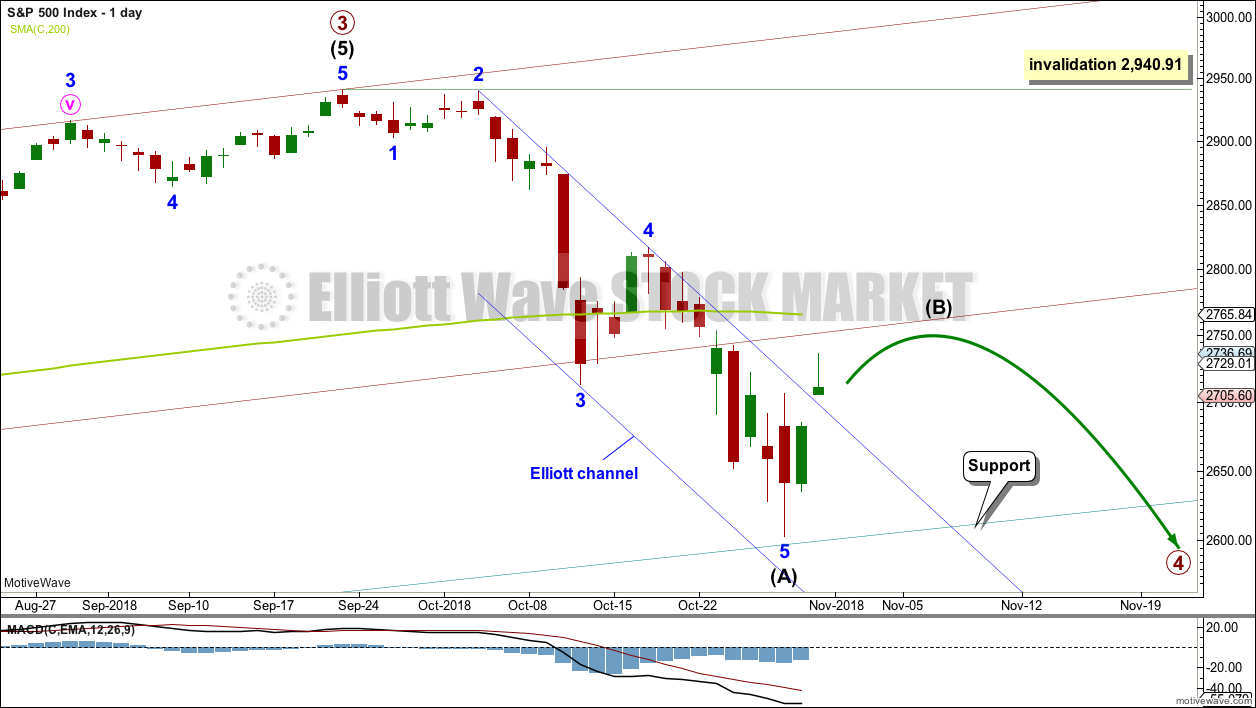
Primary wave 4 would most likely end somewhere within the price territory of the fourth wave of one lesser degree. Intermediate wave (4) has its price territory from 2,872.87 to 2,532.69. Within this range sit the 0.236 Fibonacci ratio at 2,717 and the 0.382 Fibonacci ratio at 2,578.
The 0.382 Fibonacci ratio would expect an overshoot of the teal channel. This may be too low; price may find support at the lower edge of the channel. However, as primary wave 4 should be expected to exhibit reasonable strength, it may be able to overshoot the channel and that would look reasonable. This possibility is now more seriously considered.
Primary wave 2 unfolded as a shallow regular flat correction lasting 10 weeks.
Intermediate wave (A) is labelled as a possible complete five wave impulse.
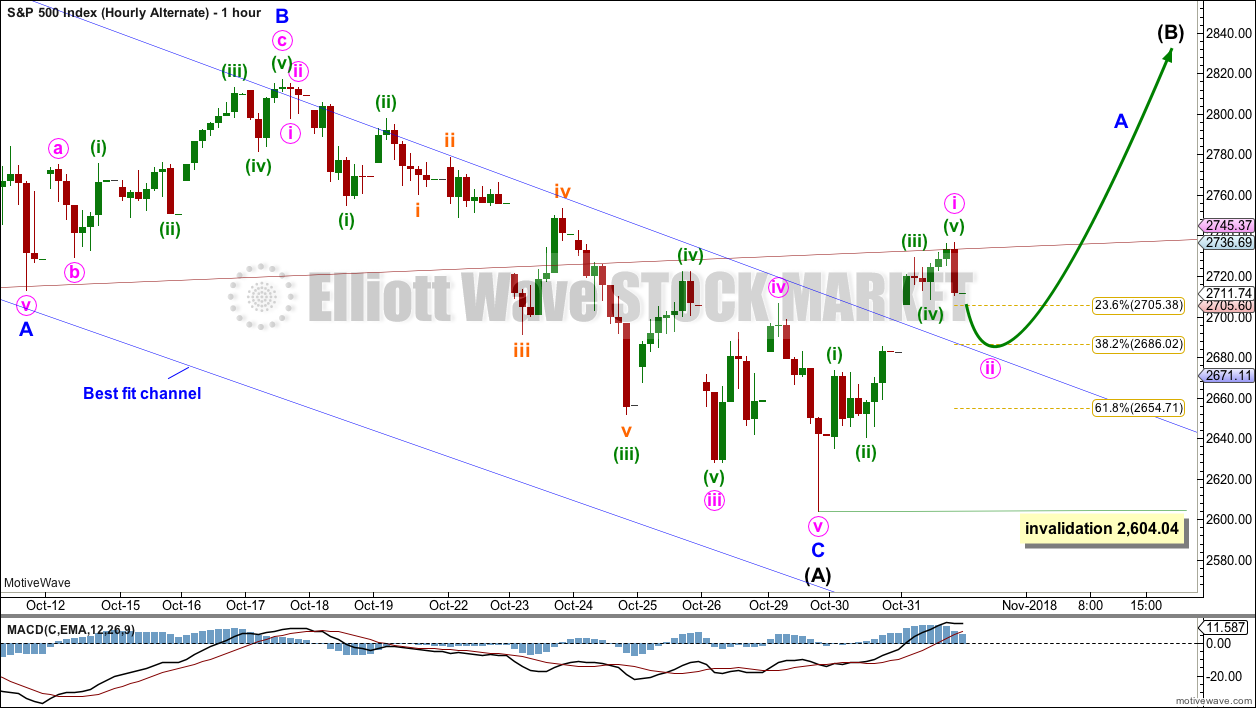
The blue Elliott channel about downwards movement is drawn in the same way on all hourly charts below. Draw the first trend line from the highs labelled minor waves 2 to 4, then place a parallel copy on the low labelled minor wave 3. This channel is clearly breached by upwards movement. Some confidence may now be had that a low is in place.
If intermediate wave (A) is a five wave structure, then intermediate wave (B) may not move beyond its start above 2,940.91.
Primary wave 4 would most likely be a zigzag to provide structural alternation with the flat correction of primary wave 2; for this reason, intermediate wave (A) would most likely be a five wave structure.
Primary wave 4 may not move into primary wave 1 price territory below 2,111.05.
HOURLY CHART
Click chart to enlarge.
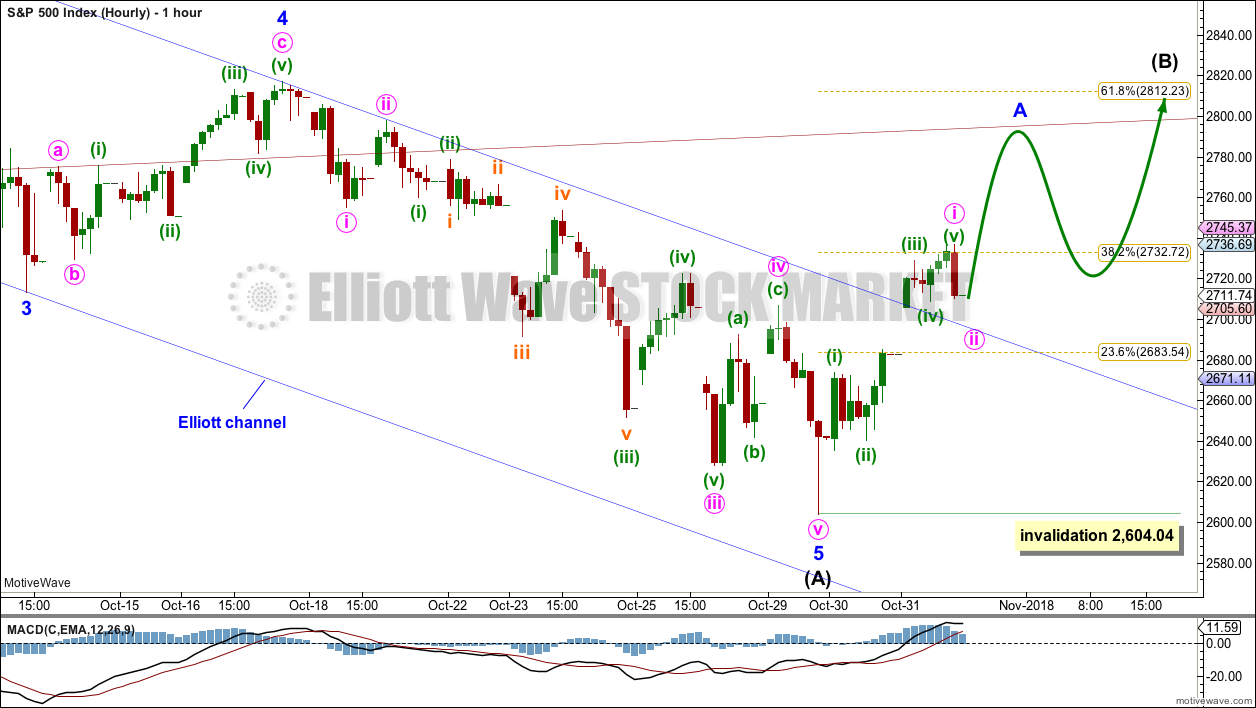
Intermediate wave (B) may be expected to last a few weeks. An intermediate degree wave should begin with a five up on the hourly chart; today, this would be complete. Minute wave ii may not move beyond the start of minute wave i below 2,604.04.
Intermediate wave (B) may unfold as one of more than 23 possible corrective structures. B waves exhibit the greatest variety in structure and price behaviour. They can be very complicated time consuming sideways corrections, or equally as likely they can be quick sharp zigzags.
To take up time and move price sideways, intermediate wave (B) for this main wave count may most likely be a complicated sideways structure such as a flat, combination or triangle. A longer lasting intermediate wave (B) would give primary wave 4 better proportion to primary wave 2 in terms of duration.
ALTERNATE WAVE COUNT
DAILY CHART
Click chart to enlarge.
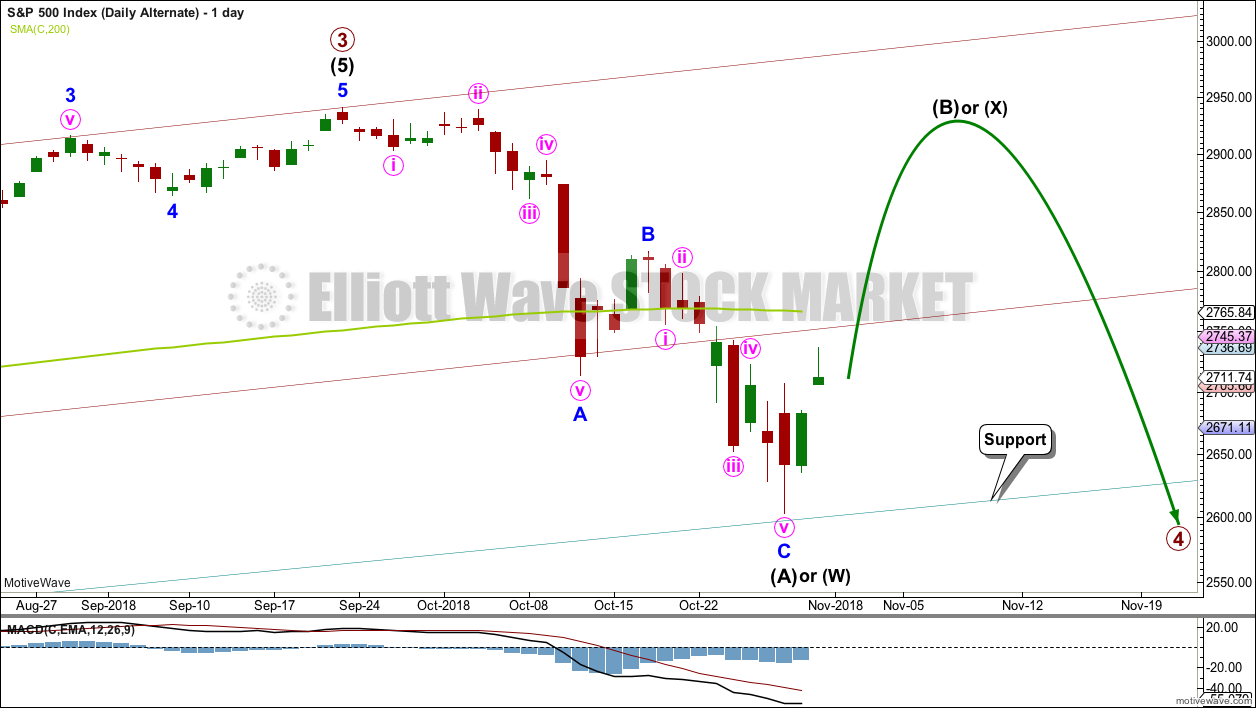
It is also possible that intermediate wave (A) may be seen as a complete zigzag. A zigzag down to start primary wave 4 may also be labelled intermediate wave (W).
If intermediate wave (A) or (W) subdivide as a zigzag, then primary wave 4 may unfold as a double zigzag, double combination, flat or triangle. Of all these possible structures a flat correction would be least likely as that would not offer structural alternation with the flat correction of primary wave 2.
A double zigzag would also be less likely as that would require a very large overshoot of the teal trend channel, and it would also see a very brief primary wave 4.
A triangle would be fairly likely even though intermediate wave (4) was a triangle. This does not reduce the probability of primary wave 4 also subdividing as a triangle.
A double combination should always be considered if a triangle is possible, and this would also offer reasonable alternation with primary wave 2.
All structural options (except a double zigzag) which begin with a zigzag down would expect a high bounce for intermediate wave (B) or (X).
Within a triangle for primary wave 4, intermediate wave (B) would most likely be about 0.8 to 0.85 the length of intermediate wave (A) giving a target range from 2,873.54 to 2,890.38. Intermediate wave (B) of a running triangle may make a new high above the start of intermediate wave (A).
Within a double combination for primary wave 4, intermediate wave (W) may be the first complete structure in a double. Intermediate wave (X) may be a very high bounce and may make a new high above the start of intermediate wave (W). There is no minimum requirement for the length of intermediate wave (X), and no maximum limit.
HOURLY CHART
Click chart to enlarge.
A new wave upwards at intermediate degree should begin with a five up on the hourly chart; this may now be complete. A five up (whether it be a first wave or an A wave) should be followed by a three down which may then not make a new low below 2,604.04.
SECOND ALTERNATE WAVE COUNT
HOURLY CHART
Click chart to enlarge.
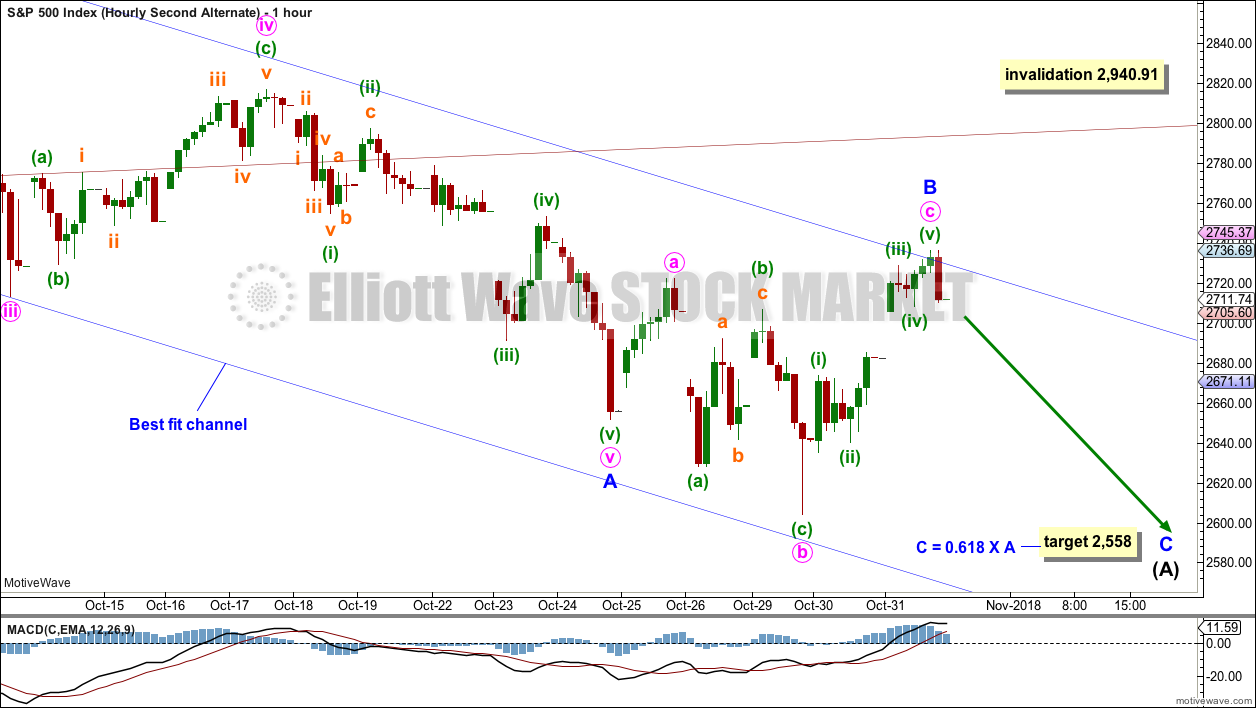
Intermediate wave (A) may be an incomplete zigzag. Within intermediate wave (A), minor wave B may today be complete as an expanded flat correction.
If it continues higher, then minor wave B may not move beyond the start of minor wave A above 2,940.91.
A target is calculated for minor wave C. This target may not have a good probability as it would expect a substantial breach of the teal trend channel.
TECHNICAL ANALYSIS
WEEKLY CHART
Click chart to enlarge. Chart courtesy of et=”_blank”>StockCharts.com.
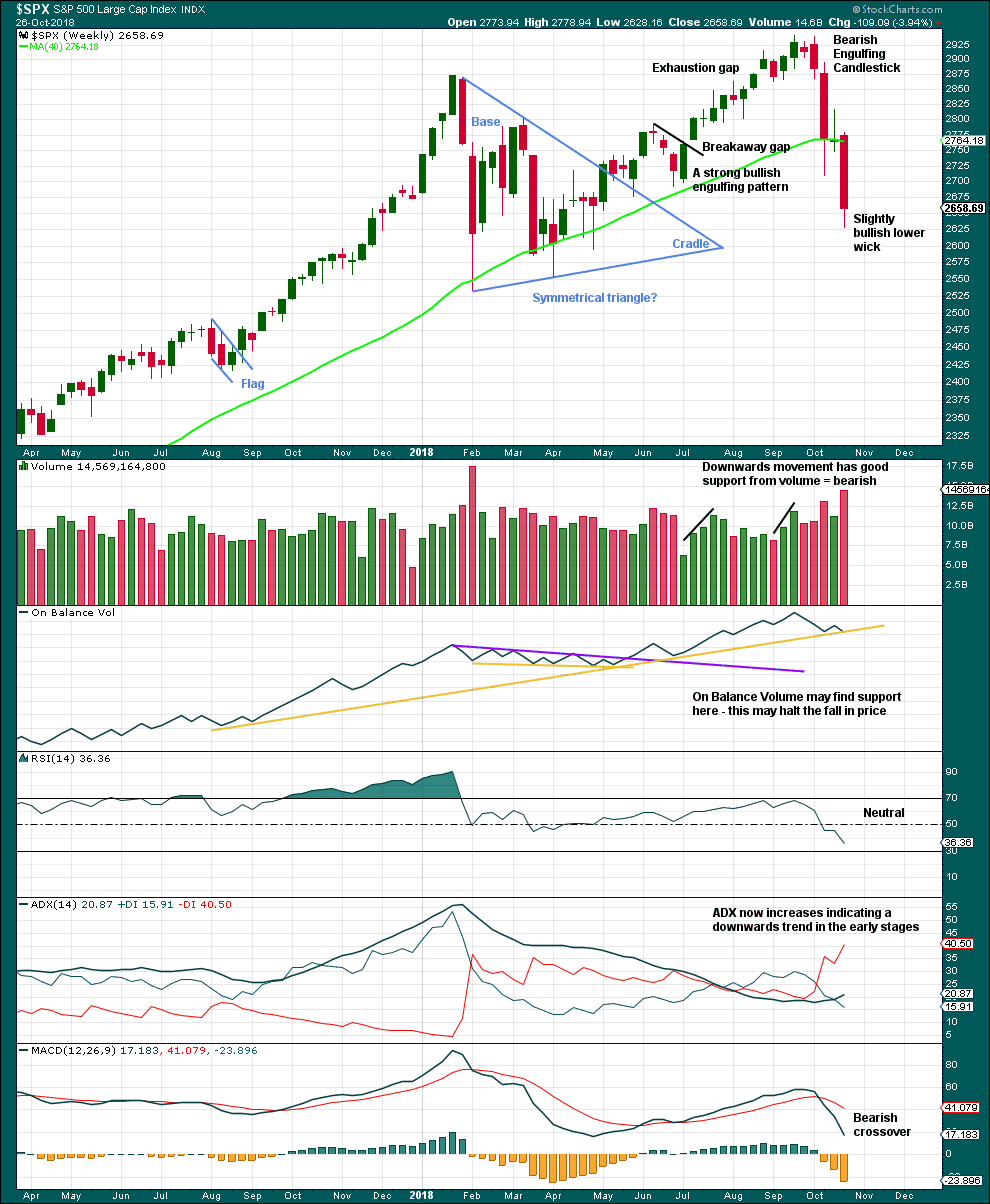
Support for On Balance Volume along with a slightly longer candlestick wick looks slightly bullish. A low for the first downwards swing within a consolidation may be found very soon this week.
DAILY CHART
Click chart to enlarge. Chart courtesy of StockCharts.com.
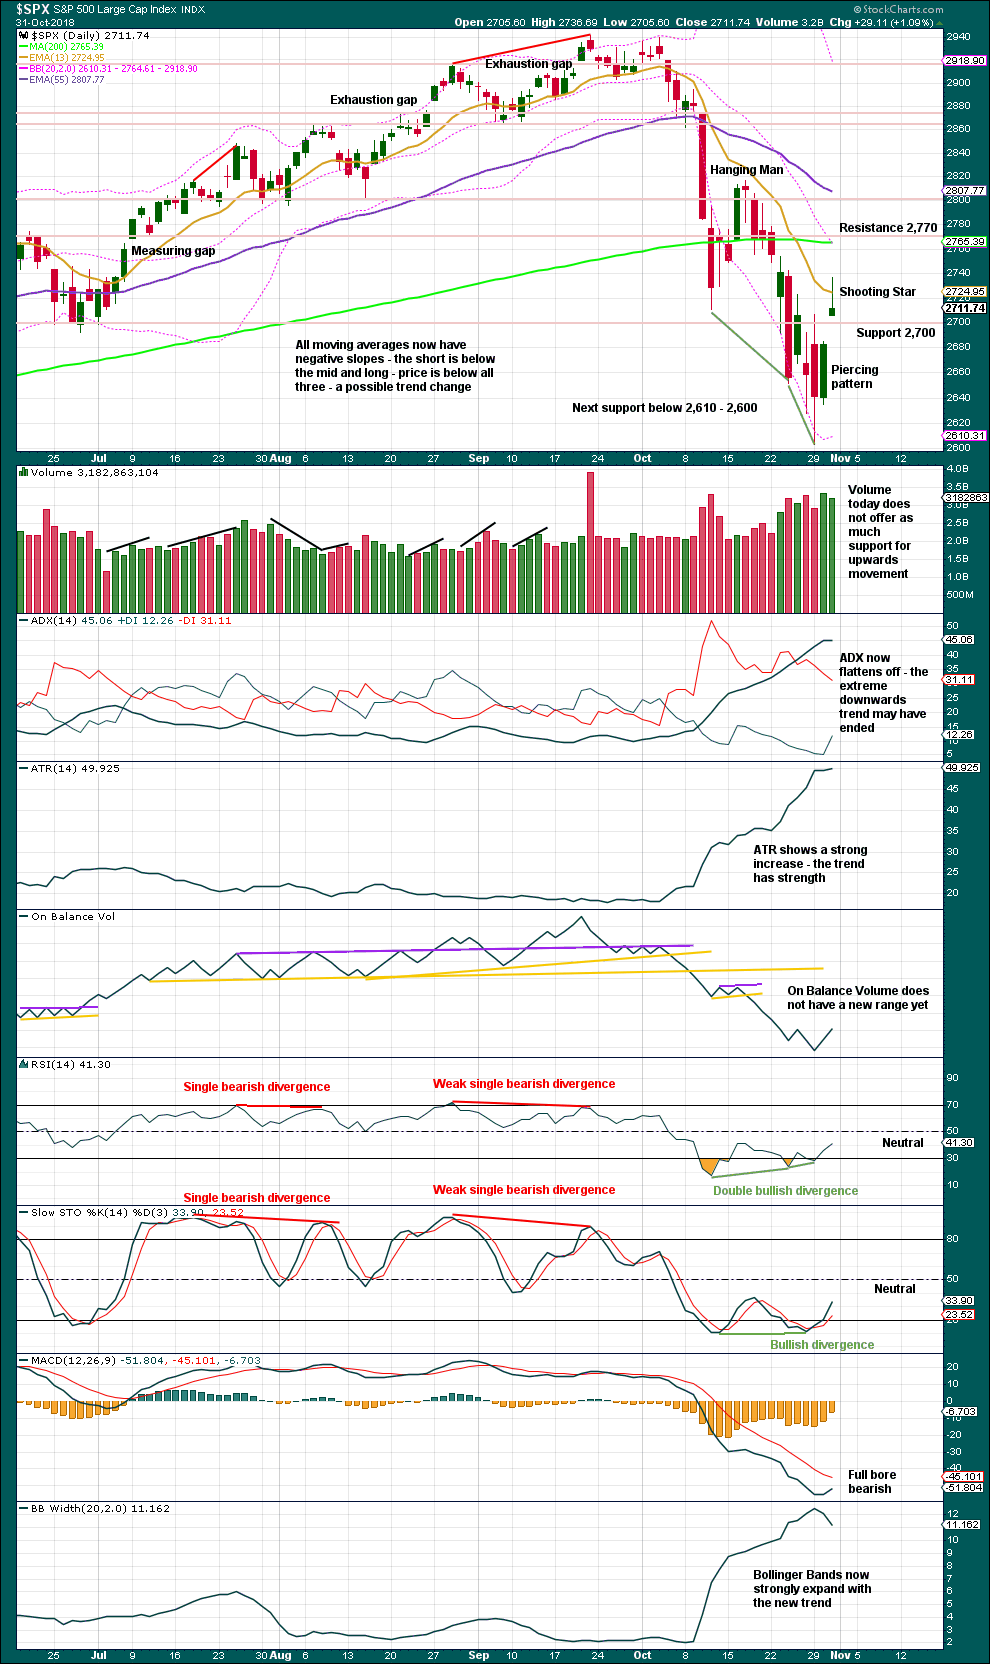
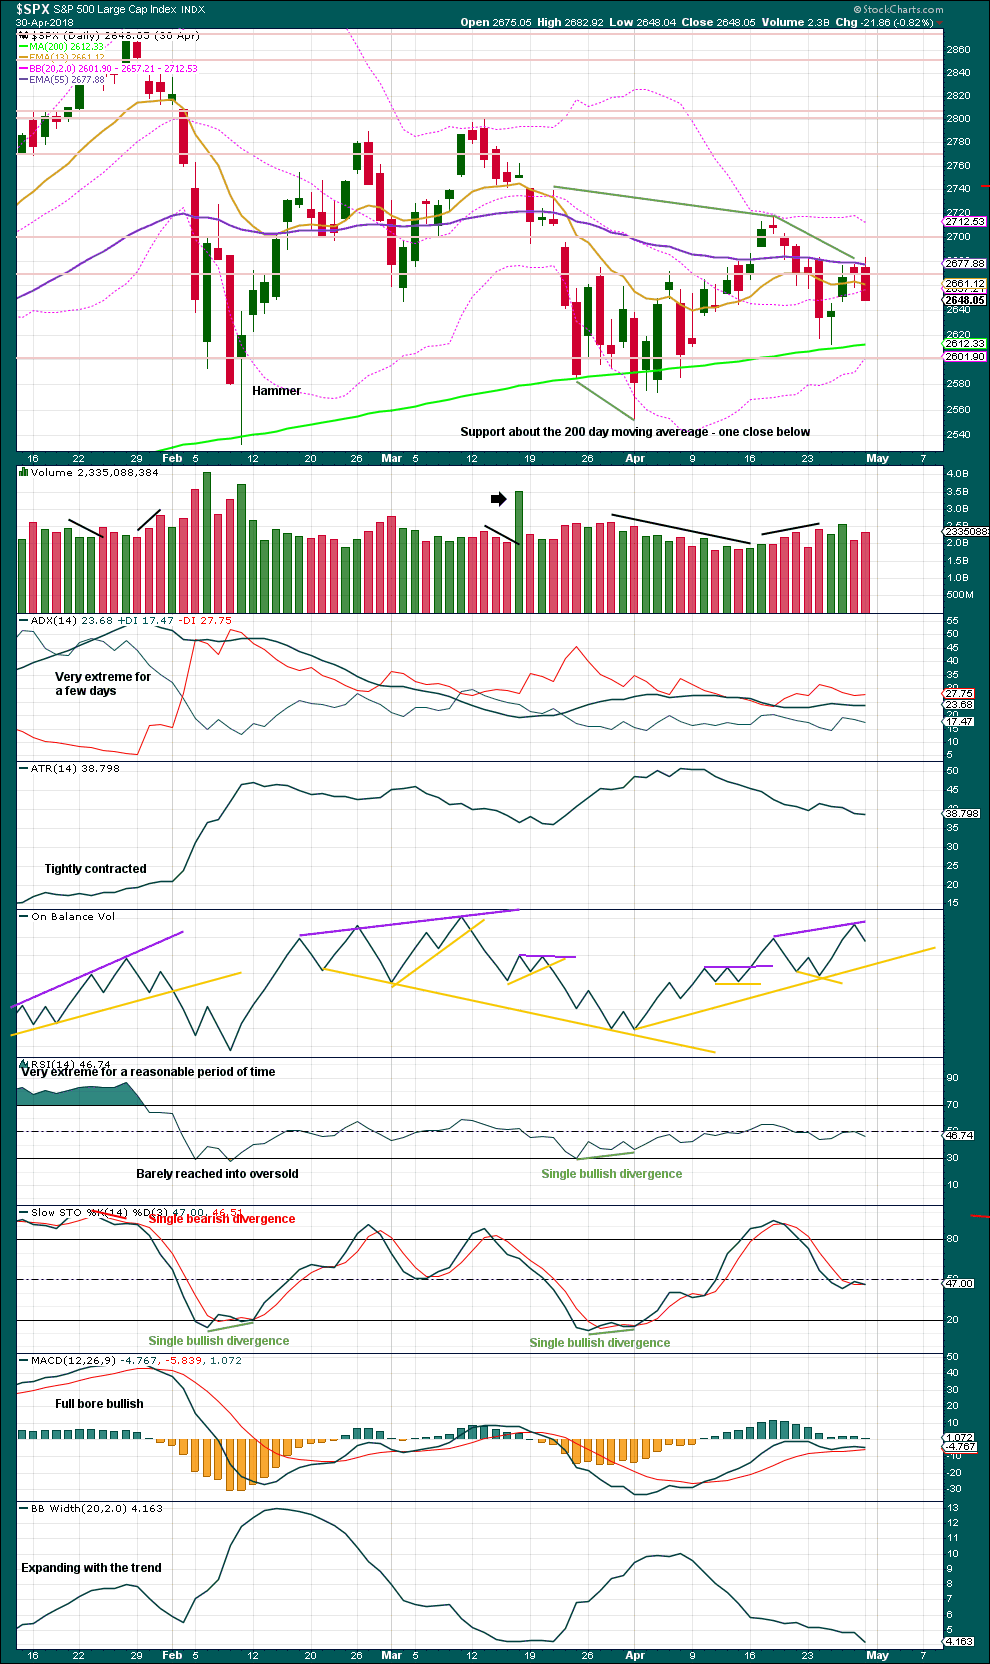
ADX reached very extreme, and there was a bullish candlestick reversal pattern at the low. It still looks like a low may be in place.
There is some weakness in upwards movement today, but a slight decline in volume will not be given weight as a feature of this market for some years now has been rising price with light and declining volume.
What is concerning today is the Shooting Star bearish reversal candlestick pattern. A downwards day tomorrow may result. For the short term, this may fit the main Elliott wave count; a second wave correction may complete a red daily candlestick.
Today’s gap may be a breakaway gap. If it is, then it may provide support; breakaway gaps are not closed. Support is at 2,865.43.
BREADTH – AD LINE
WEEKLY CHART
Click chart to enlarge. Chart courtesy of StockCharts.com.
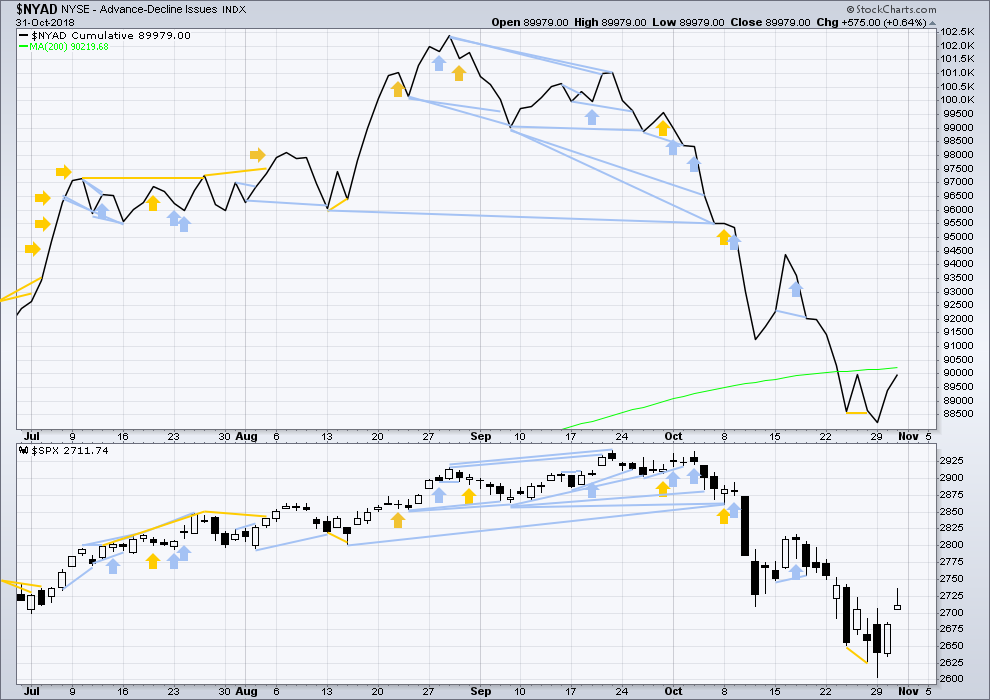
Falling price has support from a decline in market breadth. Breadth is falling in line with price. There is no divergence either way.
DAILY CHART
Click chart to enlarge. Chart courtesy of StockCharts.com.
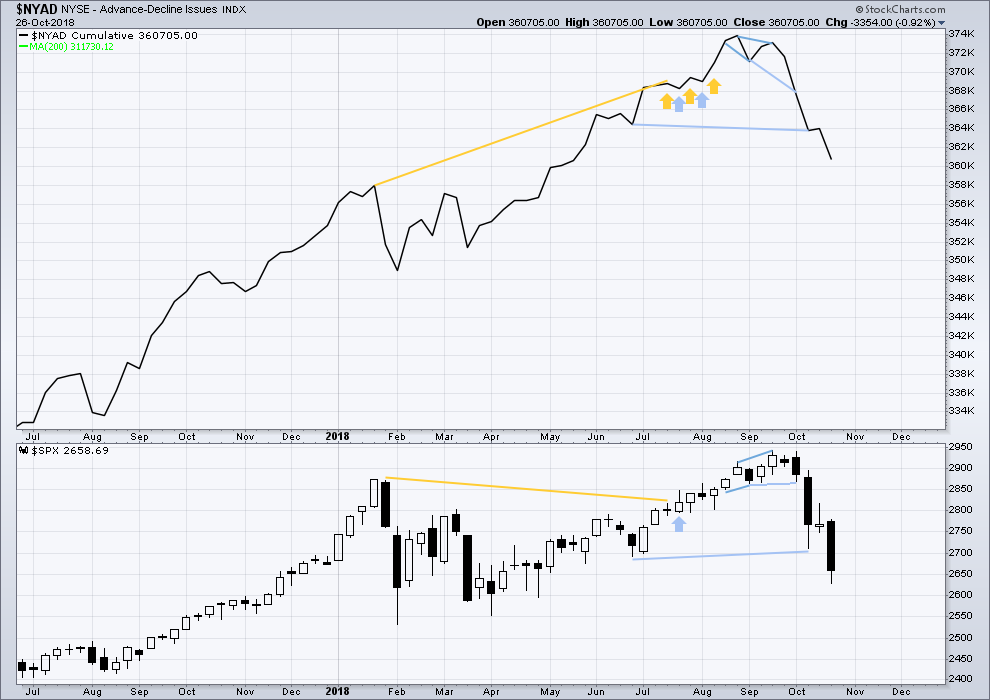
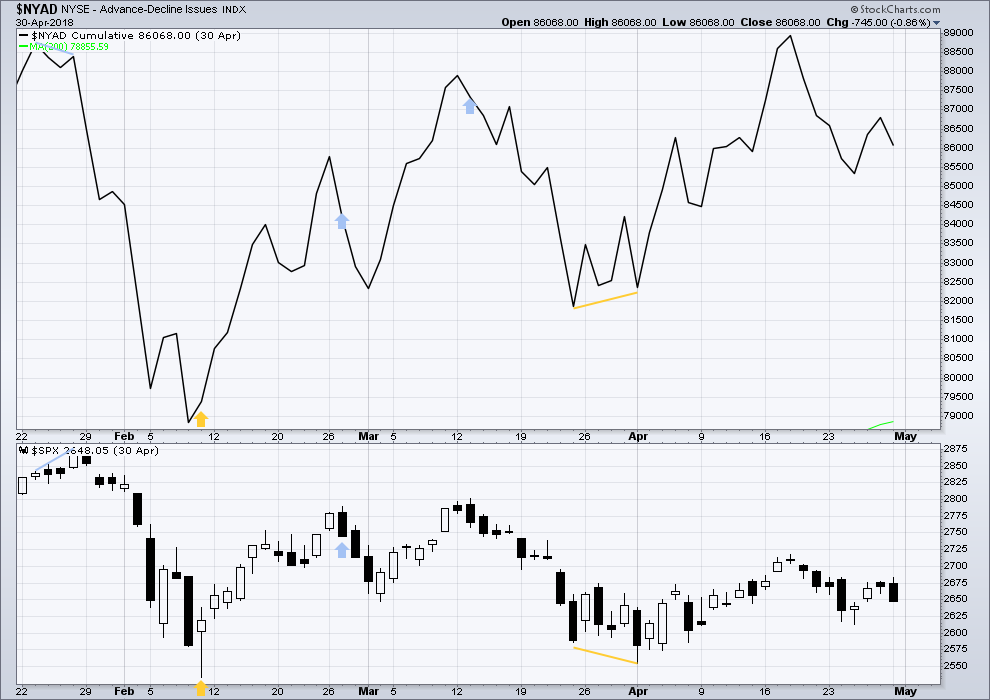
There is normally 4-6 months divergence between price and market breadth prior to a full fledged bear market. This has been so for all major bear markets within the last 90 odd years. With no longer term divergence yet at this point, any decline in price should be expected to be a pullback within an ongoing bull market and not necessarily the start of a bear market. New all time highs from the AD line on the 29th of August means that the beginning of any bear market may be at the end of December 2018, but it may of course be a lot longer than that. My next expectation for the end of this bull market may now be October 2019.
Breadth should be read as a leading indicator.
Upwards movement today has support from rising market breadth. The AD line is not rising quite as fast as price. There is no bearish divergence, but there is slight weakness.
VOLATILITY – INVERTED VIX CHART
WEEKLY CHART
Click chart to enlarge. Chart courtesy of StockCharts.com. So that colour blind members are included, bearish signals
will be noted with blue and bullish signals with yellow.
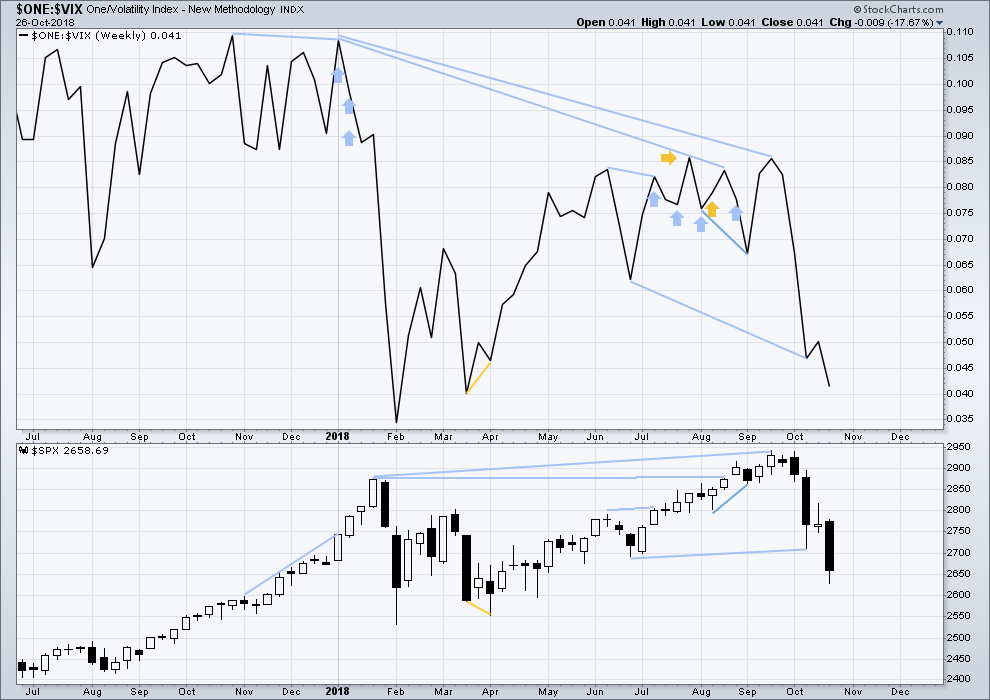
The fall in price last week comes with a normal corresponding increase in volatility as inverted VIX also declines. There is no new divergence. Last noted mid term bearish divergence has now been resolved.
DAILY CHART
Click chart to enlarge. Chart courtesy of StockCharts.com. So that colour blind members are included, bearish signals
will be noted with blue and bullish signals with yellow.
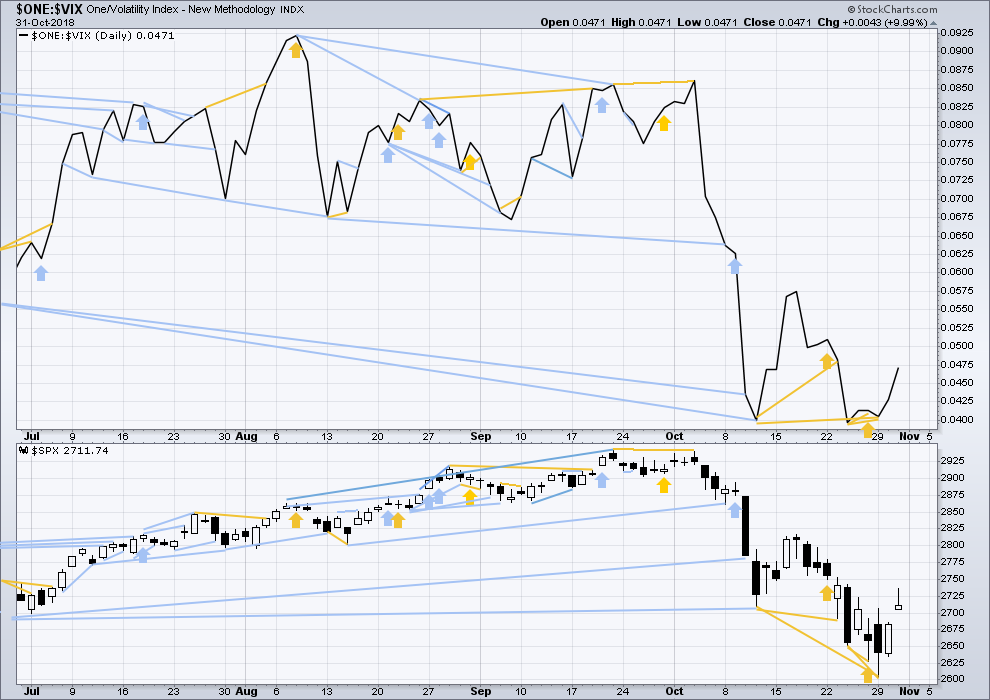
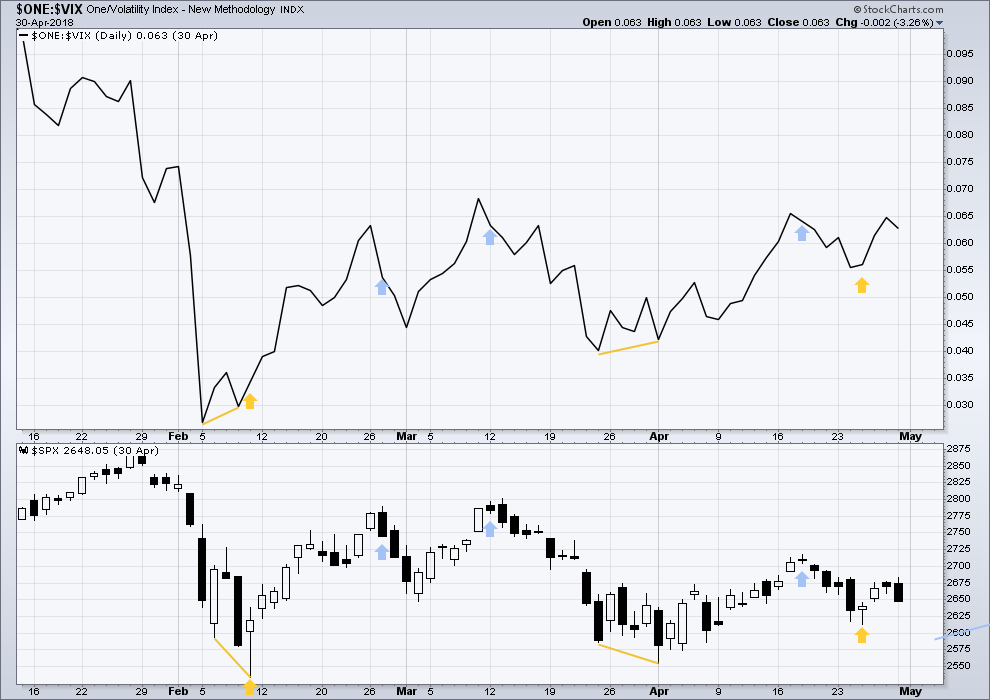
Normally, volatility should decline as price moves higher and increase as price moves lower. This means that normally inverted VIX should move in the same direction as price.
Price has support from rising inverted VIX. There is no divergence.
DOW THEORY
The following lows need to be exceeded for Dow Theory to confirm the end of the bull market and a change to a bear market:
DJIA: 23,344.52.
DJT: 9,806.79.
S&P500: 2,532.69.
Nasdaq: 6,630.67.
ANALYSIS OF INTERMEDIATE WAVE (4)
TECHNICAL ANALYSIS
Click chart to enlarge. Chart courtesy of StockCharts.com.
Intermediate wave (4) was a large symmetrical triangle. The deepest wave was the first wave. At its low there was a clear candlestick reversal pattern and bullish divergence between price and Stochastics.
RSI barely managed to reach into oversold.
The current correction for primary wave 4 may behave differently, but there should be some similarities.
It is expected that primary wave 4 may be stronger than intermediate wave (4).
VIX
Click chart to enlarge. Chart courtesy of StockCharts.com.
This is a daily chart.
At the two major lows within intermediate wave (4), inverted VIX exhibited single short term bullish divergence.
At highs within intermediate wave (4), inverted VIX exhibited one single day bullish divergence with price.
AD LINE
Click chart to enlarge. Chart courtesy of StockCharts.com.
This is a daily chart.
At the two major lows within intermediate wave (4), there was bullish divergence between price and the AD line. At the two major highs within intermediate wave (4), there was each one instance of single day bearish divergence.
Published @ 09:24 p.m. EST.
—
Careful risk management protects your trading account(s).
Follow my two Golden Rules:
1. Always trade with stops.
2. Risk only 1-5% of equity on any one trade.
There are two possibilities here for the very short term: minute ii could be over at today’s low as I have it labelled. But it could also be continuing sideways as a flat correction.
I’m going to tentatively label it as most likely complete for two reasons:
1. For this market, the second wave corrections can be relatively brief and shallow.
2. When third waves extend (most common for this market) they look like they start out slowly. Their subdivisions are extended in time, so their lower degree second and fourth waves within them look like a stretched out accordion. So the stalling here may be the start of minuette (ii). That would look fairly typical.
I could of course be wrong, and minute ii could continue lower. If it does then look for a test of support at the upper edge of the blue channel. That’s why I’m going to keep it on the chart.
By my estimation the initial A up of the B up may now be complete with a 5 wave move off the bottom. Could be.
I’m in the 2nd half of the “Verne trade” in JPM. Bought a bull put credit spread around the recent lows, and started buying back the profitable short puts late yesterday on JPM’s giant up move. Finished earlier today. Have several weeks to exit the long puts at lower prices (though I’ve started peeling there already too). Love this type of trade; offers very low risk with substantial reward opportunities!
Sweet! 🙂
SPX now in about 1.5 hours of squeeze on the 5 minute chart, an unusually long time. Entered from below. Could/”should” break out upward…perhaps to 2745 area. Though NDX was in one and has already broken out upward, while RUT is running up slow but sure all day long. So maybe…SPX ain’t gonna go here. Waiting for evidence…
TLT (daily chart here) for a 2nd time tagging a 1.27% extension down, and bouncing a bit up. 1.27%’s are often temporary stall levels, but also often a longer term turn level too. Given the extremely “rangy” nature of TLT/bonds, one play here is to take TLT long in some fashion to play a “back into the range above” move, with a stop just below that 1.27%. Should offer a fine reward to risk ratio. In which case, even if it’s a 50-50 bet re: which way price moves, the overall expected value should be very positive (though I have to acknowledge there’s always risk of a surprise overnight move way down and we wake up to find out position deeply in the red; trading’s a —— sometimes!).
If the market was to start selling off here…it will turn around one of these fibo levels, with the .386 perhaps the most likely, but I’ll let the market inform me. Right now…I guess I expect this current stalemate to resolve upward, but again, I’m waiting for the market to tell me.
Should the market reach 2743-47 today, those overhead fibos there have high potential to stall/turn SPX today IMO.
Here, here! Rodney
Yesterday, Kevin gave some very affirming remarks to Lara regarding her analysis of the recent SPX low at 2603. I did not see Lara’s response until this morning. I want to highlight it for all readers because it speaks to the honesty and character of Lara. She responded as follows:
—————————————————————
October 31, 2018 at 4:20 pm
Thanks Kevin, but I think I got it wrong about three days in a row? I’m not happy with that.
It was really hard to find this low. That bullish divergence appeared, then price kept going down, more bullish divergence, long lower candlestick wicks… all led me to think the low was in a few days ago. I was not happy with my analysis this last week.
————————————————————–
I am convinced Lara’s work is the very best. She is disciplined and willing to make the hard calls. But there are a few things that set her apart from the crowd especially the Financial Advisor/Analyst crowd; honesty, humility and desire to serve her clients the very best she is able. Add it all up and those are some of the reasons I have been here for over 7 years going on 8 in a couple of months.
Have a great day everyone.
BTW, Lara once again mentioned selling T shirts labeled “I Hate B Waves”
Regardless the cost, my order for the first one off the press stands.
“Hate” is a really ugly word to put on a shirt here in the US these days, IMO.
I’m for a more positive EW messaging shirt. Ala, “I longboard 3 of 3’s!”. Or “I’m only in it for the motive waves”. Or “Catch a motive wave, Catch the Joy!”. Etc.
No offense and please don’t take this as a personal attack what-so-ever but this all just sounds so nerdy that I’m LMAO and SMH.
LOL!
Yea, it’s awesome. ‘cuz nerds make money. LoL!!!
ROTFL
Agreed re the negativity, and I like the “I ride third waves”
But I still hate B waves.
And seeing as I’m literally on the other side of the world from the USA, the word hate isn’t carrying quite the same weight for me.
This editorial does not reflect the views of the EWSM or anyone associated with the EWSM. It is the opinion of only the author and given here only for edification and perhaps some fun.
Kevin, does the word ‘hate’ really bother you? I am not being sarcastic or flippant as I ask. I truly would like to know. I am not much of a politically correct kind of guy although most who know me would say I am quite considerate of other’s feelings and have a good way of communicating. But I must admit that I ‘hate’ all sorts of things.
I hate evil. I hate rape and domestic violence. I hate murder. I hate to loose money. I even sometimes hate to spend money. The list could go on. It does not mean however, that I have malicious intent to harm anyone who is guilty of those things. I just choose to stay away and go another course.
So in the end, I despise B waves. I stay away from B waves. I choose to go another course with B waves. And yes, I still hate B waves.
Lara I have to disagree. You did NOT get it “wrong” 3 days in a row. You properly identified several alternatives 3 days in a row where the situation re: probabilities was not highly skewed one way or another. So your reporting (for me) generated absolutely appropriate caution, etc. To members: my analogy for Lara’s alternative wave counts is “alternative paths” that the market is likely to take through the general market landscape we are in. Sometimes there’s only one, usually 2 or even more, with some relative probabilities. Overall, it’s indicative and guidance, in particular if suddenly the market veers from one to another, we immediately have sense of where it’s likely to be headed. But predicting exactly which alternative will play out in the very short term…Lara does a great job at that, but NO ONE can get that right day after day without occasionally the “lower probability” case playing out instead. Perhaps that will help a few figure out how best to use Lara’s work. It’s a model that has helped me.
Cheers Kevin.
I agree with you. I can just be a bit hard on myself sometimes.
I think of it like a map guiding us through a maze. There may be more than one valid pathway to get to the exit, and sometimes they can be ranked in probability. But it’s impossible to know for sure which one it will be.
So if one pathway comes to a dead end, you throw that map away and pick up the next likely map.
Thank you very much Rodney, that’s very kind
not sure what this is? Could be a flat for Minute II
“….today’s gap offering support at 2865.43” You mean 2685.43?
Thanks Michael, you are correct. My typo.
It’s 2,685,43
1st?
Yep, you is!