
The first Elliott wave count, which was slightly preferred, expected upwards movement for Tuesday’s session, which is what has happened.
Summary: There is now a bullish candlestick reversal pattern at the low. A breakout of the blue Elliott / best-fit channel on the hourly charts would add confidence that a low is in place. A new high above 2,706.85 would add further confidence. At that stage, a multi-week bounce may be expected to continue towards about 2,812 and possibly higher.
A new low below 2,604.04 tomorrow would indicate more downwards movement. The target remains at 2,544.
A primary degree correction should last several weeks and should show up on the weekly and monthly charts. Primary wave 4 may total a Fibonacci 8, 13 or 21 weeks. Look for very strong support about the lower edge of the teal trend channel on the monthly chart.
Primary wave 4 should be expected to exhibit reasonable strength. This is the last multi week to multi month consolidation in this ageing bull market, and it may now begin to take on some characteristics of the bear market waiting in the wings.
The final target for this bull market to end remains at 3,616, which may be met in October 2019.
New updates to this analysis are in bold.
The biggest picture, Grand Super Cycle analysis, is here.
Last published monthly chart is here, video is here.
ELLIOTT WAVE COUNT
WEEKLY CHART
Click chart to enlarge.
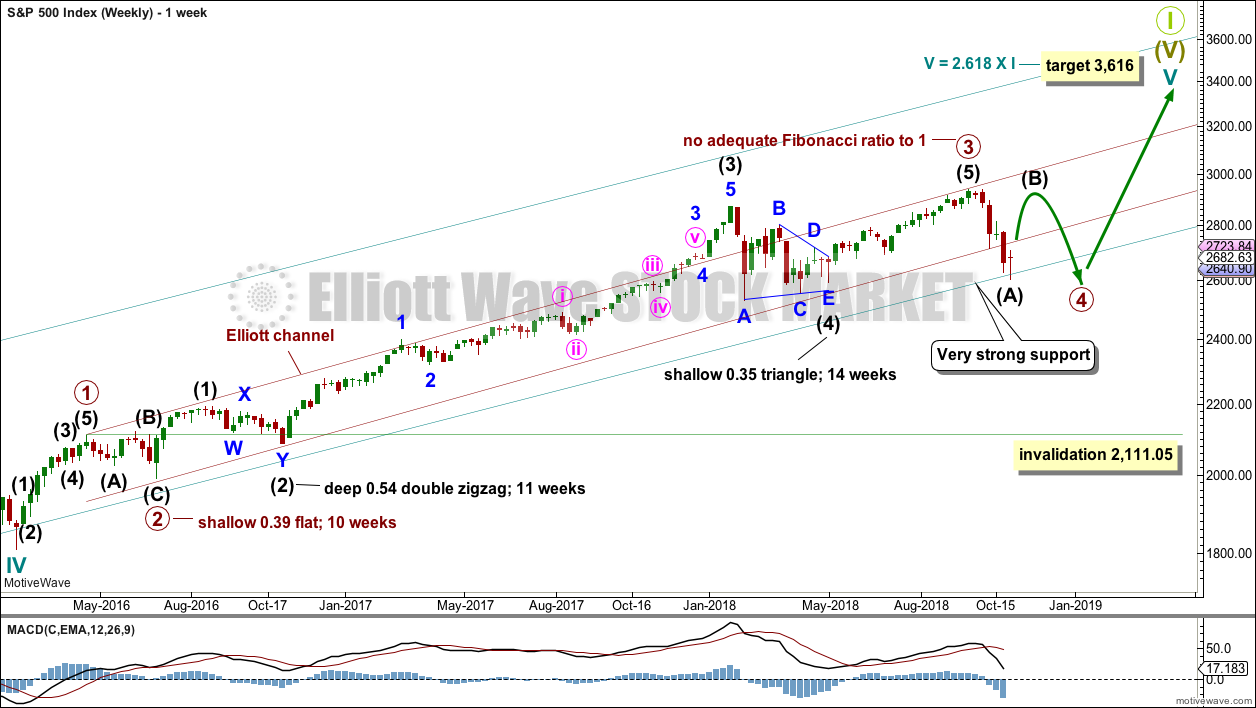
Cycle wave V must complete as a five structure, which should look clear at the weekly chart level and also now at the monthly chart level. It may only be an impulse or ending diagonal. It is clear it is an impulse.
Within cycle wave V, the third waves at all degrees may only subdivide as impulses.
Within primary wave 3, there is perfect alternation and excellent proportion between intermediate waves (2) and (4).
The channel is now drawn about primary degree waves. The first trend line is drawn from the ends of primary waves 1 to 3, then a parallel copy is placed upon the low of primary wave 2. The overshoot of the upper edge of this channel by the end of intermediate wave (3) looks typical. For the S&P, its third waves are usually the strongest portion of an impulse; they often exhibit enough strength to overshoot channels.
Primary wave 4 now has an overshoot on the lower edge of the channel. This is acceptable; fourth waves are not always neatly contained within channels drawn using this technique.
Now that primary wave 4 has broken out of the narrow maroon channel, it may find very strong support about the lower edge of the teal channel. This channel is copied over from the monthly chart and contains the entire bull market since its beginning in March 2009. While Super Cycle wave (V) is incomplete, this channel should not be breached at the weekly chart level.
Primary wave 4 may not move into primary wave 1 price territory below 2,111.05.
When primary wave 4 may be complete, then the final target may be also calculated at primary degree. At that stage, the final target may widen to a small zone, or it may change.
At this stage, the expectation is for the final target to be met in October 2019. If price gets up to this target and either the structure is incomplete or price keeps rising through it, then a new higher target would be calculated.
DAILY CHART
Click chart to enlarge.
Primary wave 4 would most likely end somewhere within the price territory of the fourth wave of one lesser degree. Intermediate wave (4) has its price territory from 2,872.87 to 2,532.69. Within this range sit the 0.236 Fibonacci ratio at 2,717 and the 0.382 Fibonacci ratio at 2,578.
The 0.382 Fibonacci ratio would expect an overshoot of the teal channel. This may be too low; price may find support at the lower edge of the channel. However, as primary wave 4 should be expected to exhibit reasonable strength, it may be able to overshoot the channel and that would look reasonable. This possibility is now more seriously considered.
Primary wave 2 unfolded as a shallow regular flat correction lasting 10 weeks.
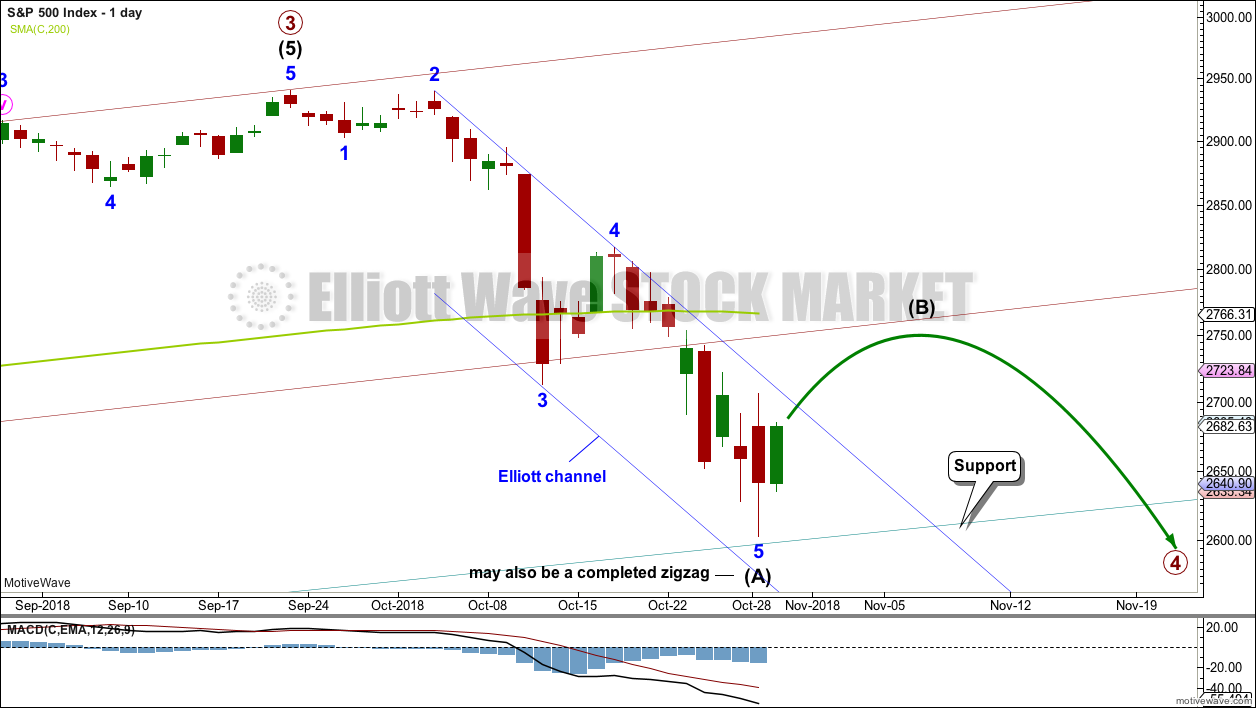
Intermediate wave (A) is labelled as a possible complete five wave impulse. However, it must also be accepted that it could also be labelled as a complete zigzag. Once there is confidence that intermediate wave (A) is finally over, then this alternate idea will then be presented at the daily chart level.
The blue Elliott channel about downwards movement is drawn in the same way on all hourly charts below. Draw the first trend line from the highs labelled minor waves 2 to 4, then place a parallel copy on the low labelled minor wave 3. Only when this channel is clearly breached by upwards movement with at least one full hourly candlestick above and not touching the upper trend line may confidence be had that a low is in place.
If intermediate wave (A) is a five wave structure, then intermediate wave (B) may not move beyond its start above 2,940.91. If intermediate wave (A) is a three wave structure, then intermediate wave (B) may make a new high above 2,940.91 as in an expanded flat or running triangle. There is no upper invalidation point for this reason.
Primary wave 4 would most likely be a zigzag to provide structural alternation with the flat correction of primary wave 2; for this reason, intermediate wave (A) would most likely be a five wave structure.
Primary wave 4 may not move into primary wave 1 price territory below 2,111.05.
Three hourly charts are published below, roughly in order of probability. However, the first hourly chart requires a breach of the trend channel for confidence.
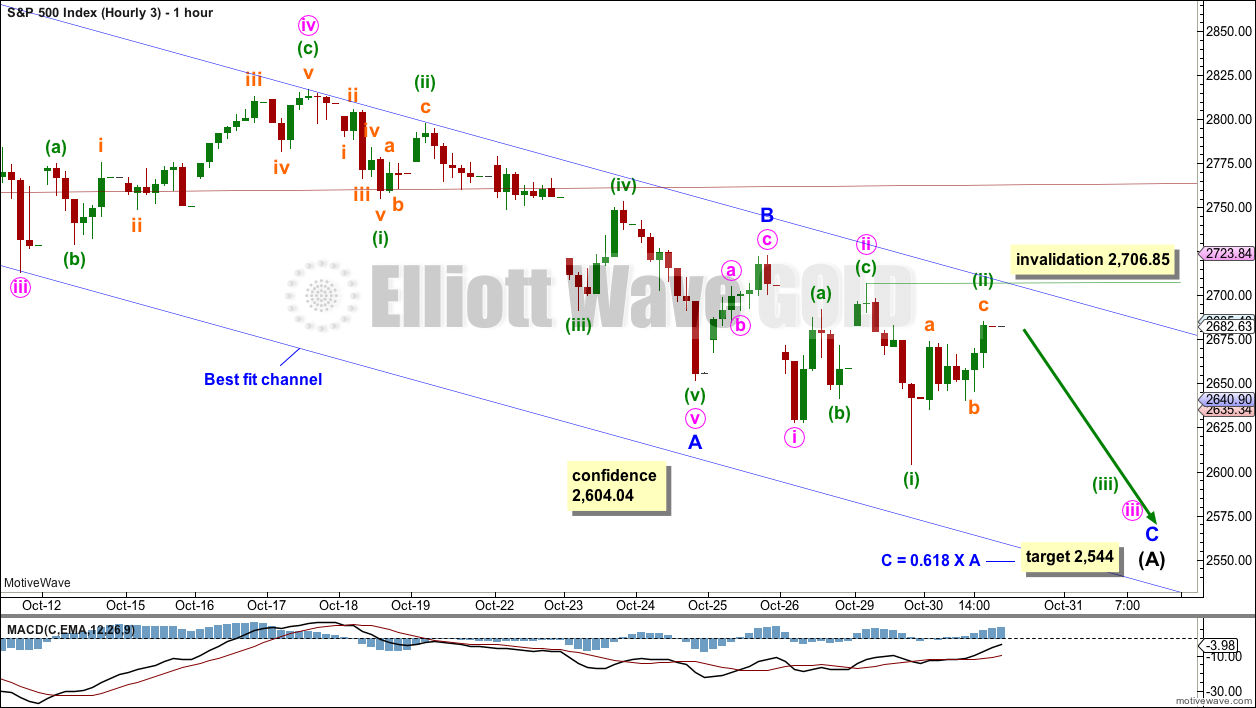
FIRST HOURLY CHART
Click chart to enlarge.
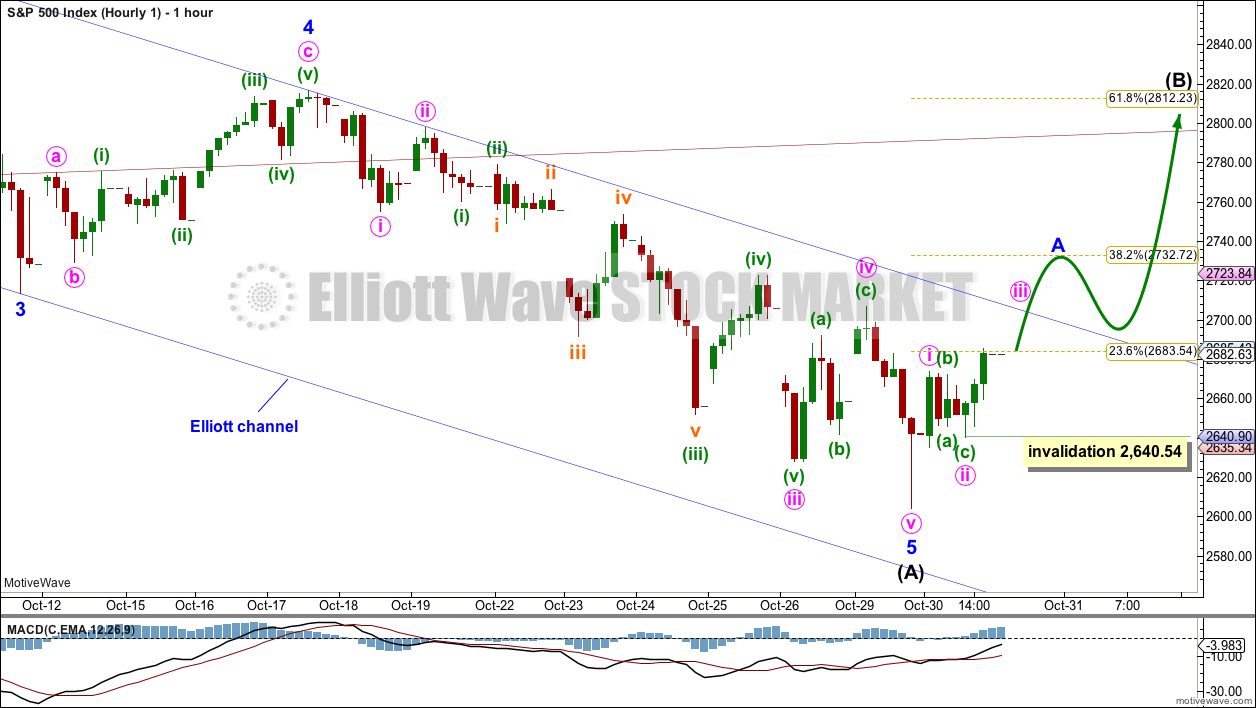
A break out above the upper edge of the blue channel is required for confidence that a low is in place. A new high above 2,706.85 would provide further confidence.
Intermediate wave (B) may be expected to last a few weeks and be a very high bounce. An intermediate degree wave should begin with a five up on the hourly chart. So far this would be incomplete; it is labelled as beginning with minute waves i and ii. Within minute wave iii, no second wave correction may move beyond the start of its first wave below 2,640.54.
Intermediate wave (B) may unfold as one of more than 23 possible corrective structures. B waves exhibit the greatest variety in structure and price behaviour. They can be very complicated time consuming sideways corrections, or equally as likely they can be quick sharp zigzags.
SECOND HOURLY CHART
Click chart to enlarge.
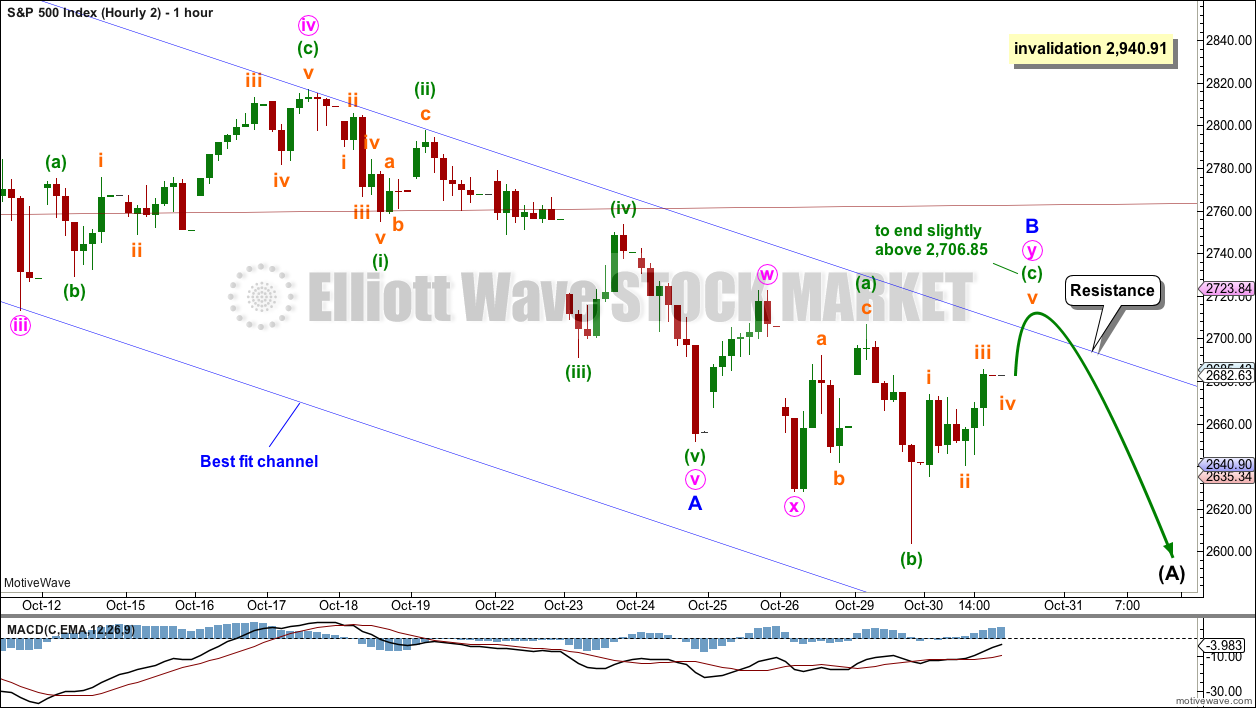
Intermediate wave (A) may be an incomplete zigzag. Within intermediate wave (A), minor wave B may be underway.
Minor wave B is labelled here as an incomplete double combination: zigzag – X – flat.
Within the flat of minute wave y, minuette wave (c) would most likely make at least a slight new high above the end of minuette wave (a) at 2,706.85 to avoid a truncation and a very rare running flat. Minute wave y may end about the same level as minute wave w at 2,722.70, so that the combination effectively moves price sideways.
Minor wave B may not move beyond the start of minor wave A above 2,940.91.
When minor wave B is complete, then a relatively short wave down for minor wave C may end at support about 2,600 and at the teal trend line on the daily chart.
THIRD HOURLY CHART
Click chart to enlarge.
It is possible that intermediate wave (A) may continue lower as a single zigzag, and that minor wave C within it is only just beginning. Within minor wave C, there may now be two overlapping first and second waves now complete. This wave count would expect an increase in downwards momentum and a strong overshoot of the lower edge of the teal channel.
This is possible, but at this stage it looks less likely.
The target is calculated to allow enough room for the structure of minor wave C to complete.
TECHNICAL ANALYSIS
WEEKLY CHART
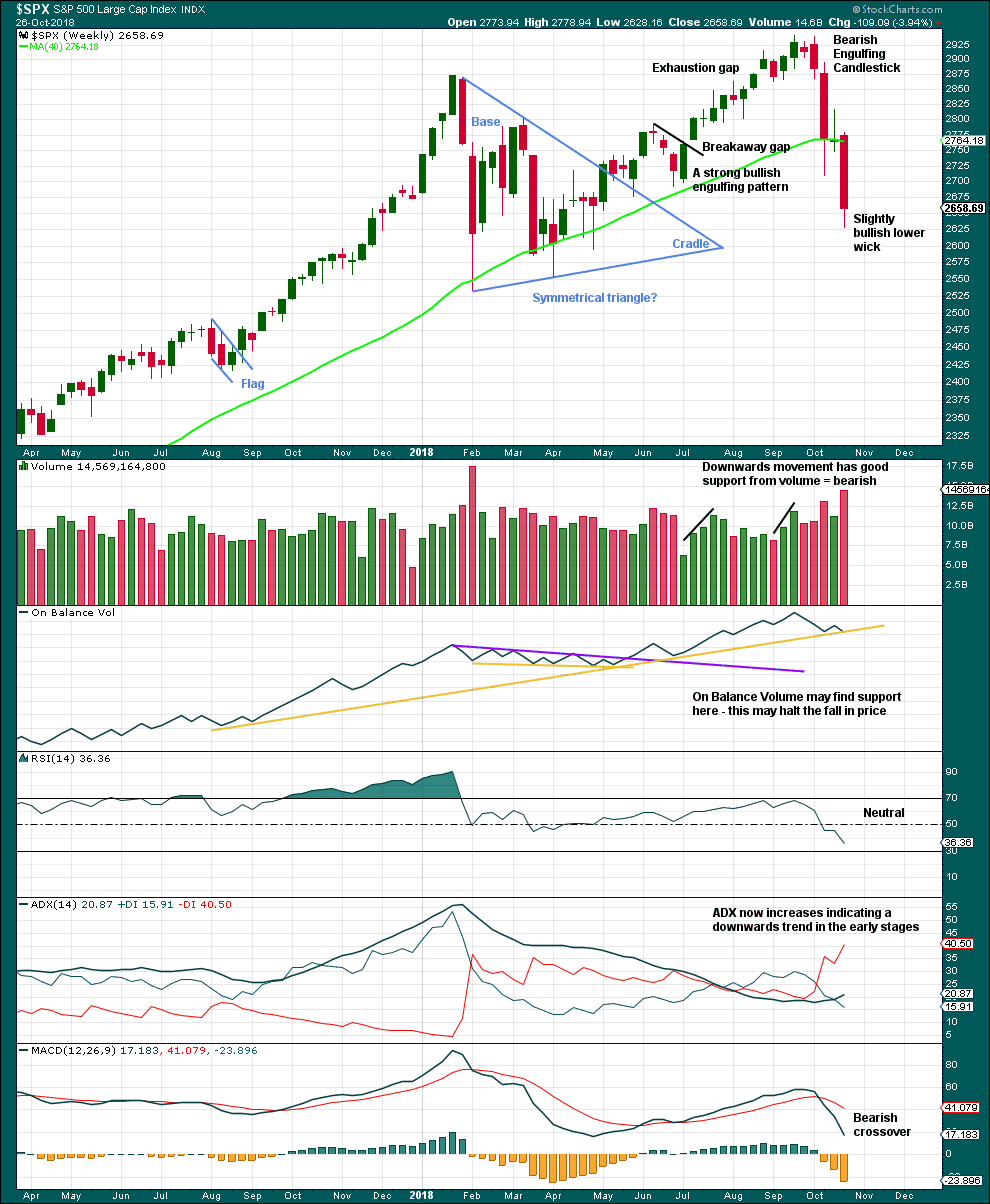
Click chart to enlarge. Chart courtesy of et=”_blank”>StockCharts.com.
Support for On Balance Volume along with a slightly longer candlestick wick looks slightly bullish. A low for the first downwards swing within a consolidation may be found very soon this week.
DAILY CHART
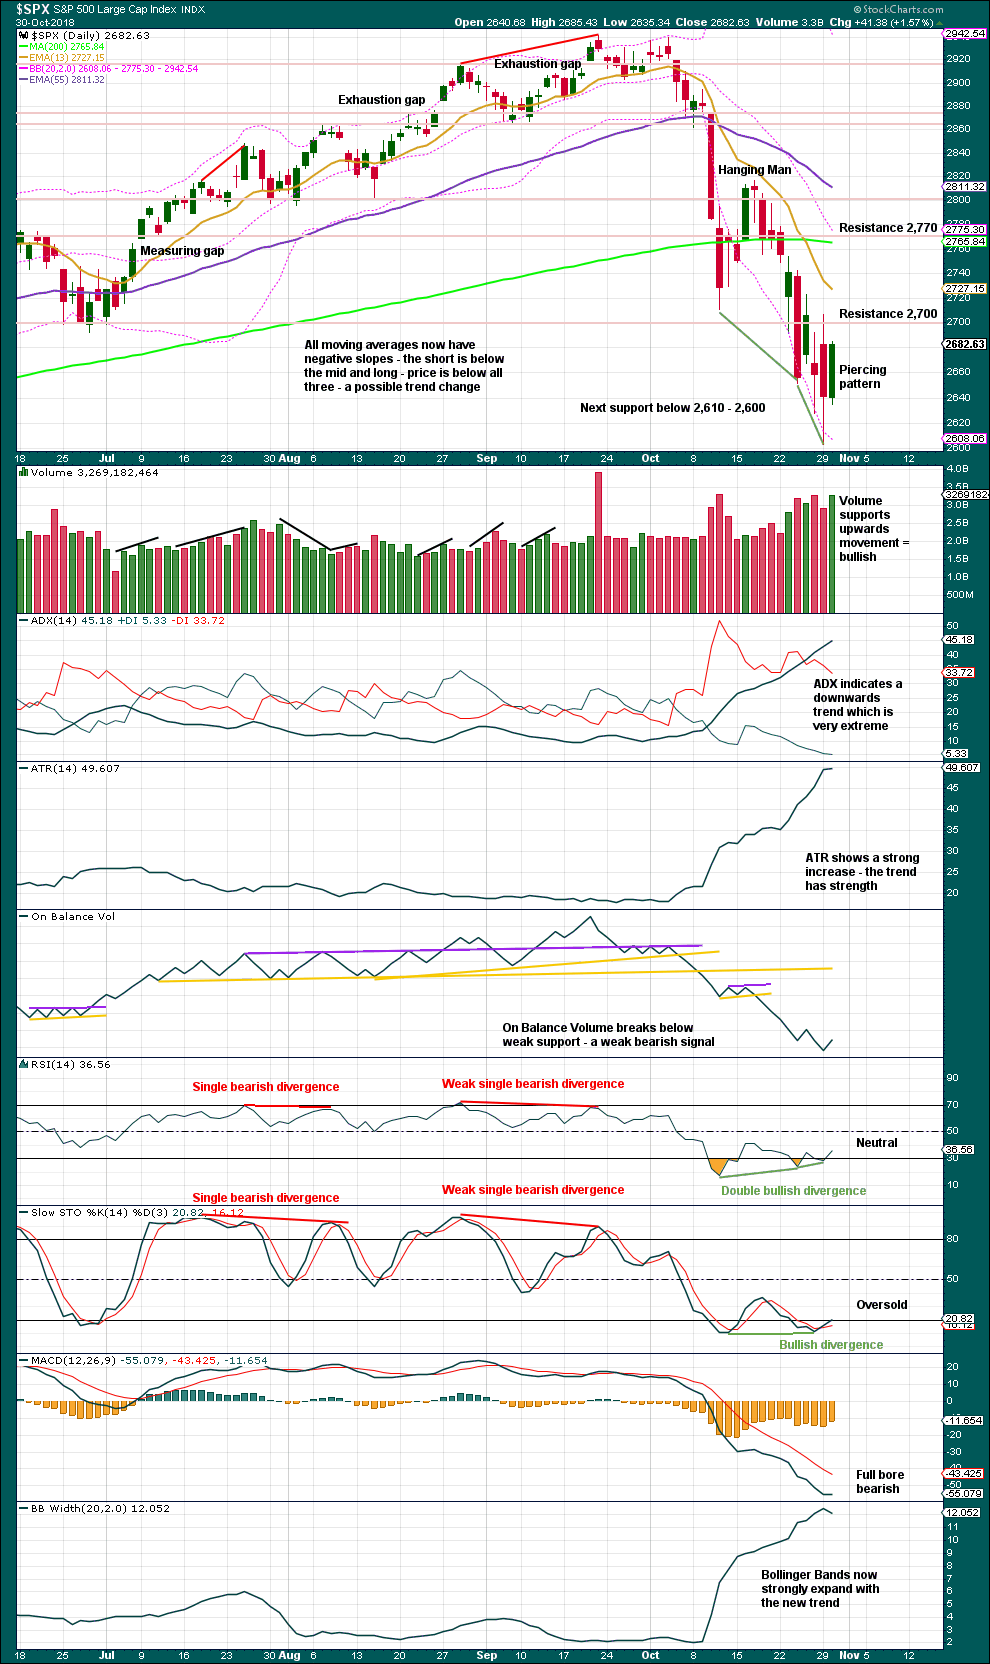
Click chart to enlarge. Chart courtesy of StockCharts.com.
ADX is very extreme, and there is now a bullish candlestick reversal pattern. These should be given weight; they support the first hourly chart. The reversal pattern is a Bullish Piercing pattern, which is very strong (it fails by just 0.02 points to be a Bullish Engulfing pattern).
Both the mid and small caps today have very strong Bullish Engulfing patterns.
Volume for today’s upwards day is stronger than the last downwards day. The short term volume profile is bullish. However, it is still not stronger than the downwards day three sessions ago, so the bullish interpretation here is not very strong.
With bullish divergence between price and both of RSI and Stochastics, and now a candlestick reversal pattern, it does look like a low may now be in place at least for the mid term.
BREADTH – AD LINE
WEEKLY CHART
Click chart to enlarge. Chart courtesy of StockCharts.com.
Falling price has support from a decline in market breadth. Breadth is falling in line with price. There is no divergence either way.
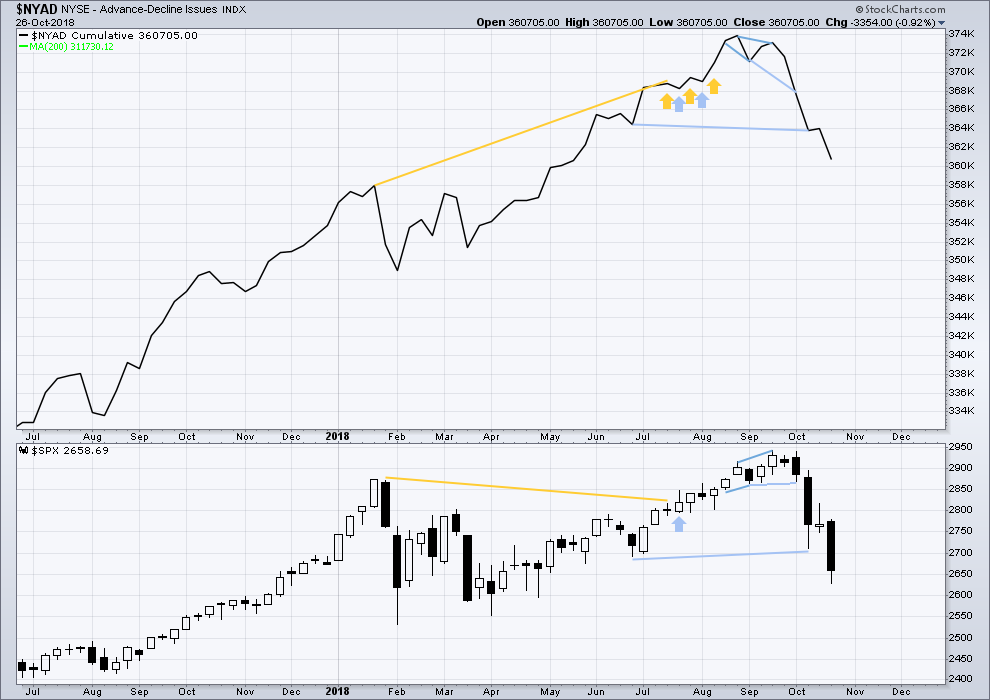
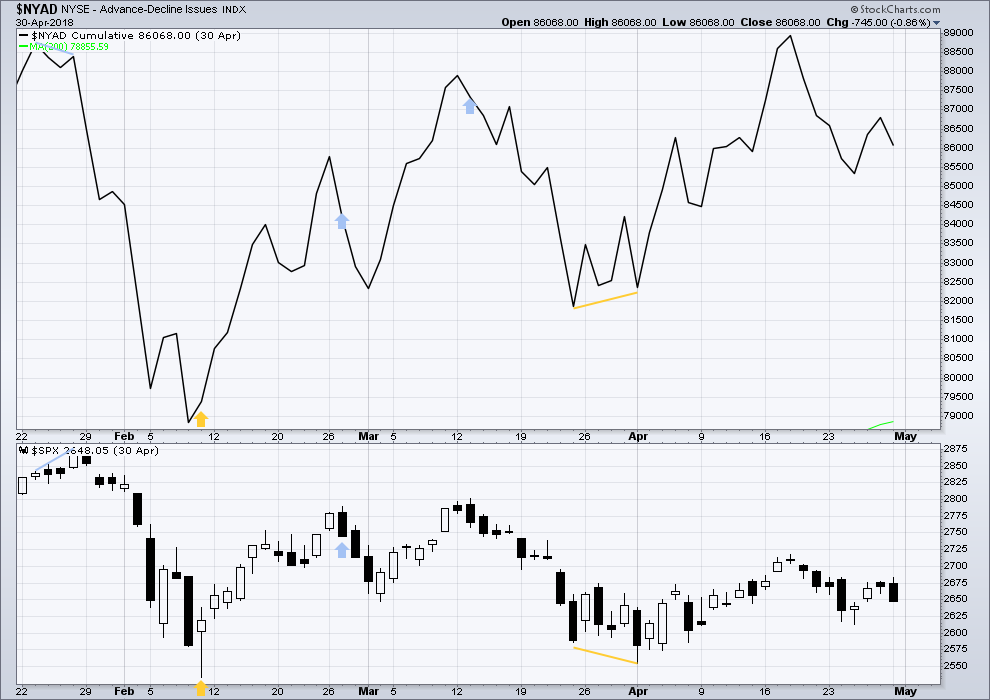
DAILY CHART
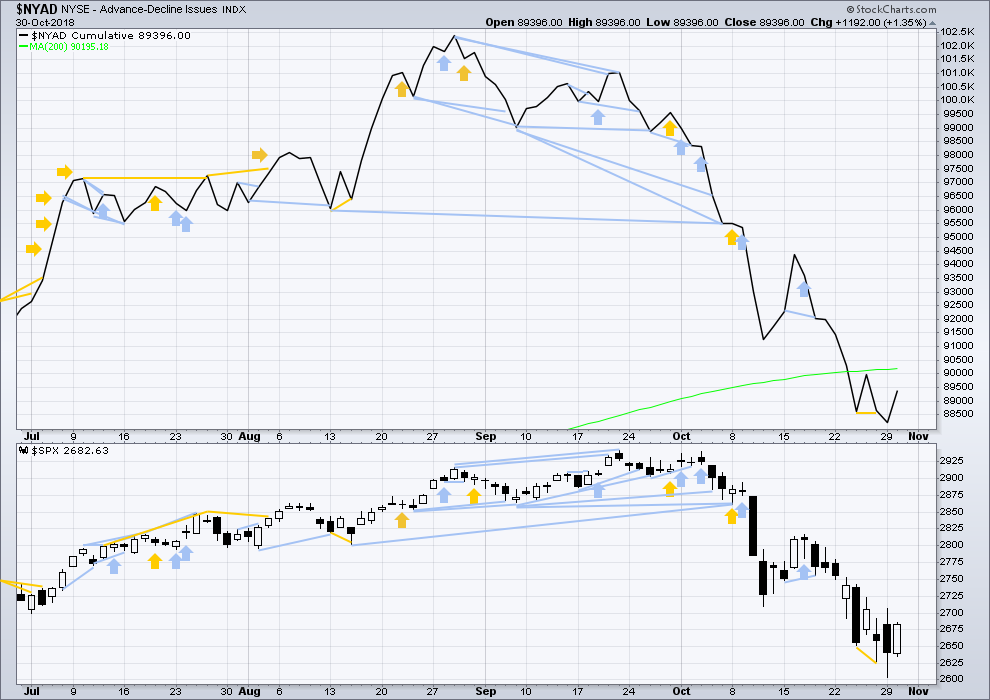
Click chart to enlarge. Chart courtesy of StockCharts.com.
There is normally 4-6 months divergence between price and market breadth prior to a full fledged bear market. This has been so for all major bear markets within the last 90 odd years. With no longer term divergence yet at this point, any decline in price should be expected to be a pullback within an ongoing bull market and not necessarily the start of a bear market. New all time highs from the AD line on the 29th of August means that the beginning of any bear market may be at the end of December 2018, but it may of course be a lot longer than that. My next expectation for the end of this bull market may now be October 2019.
Breadth should be read as a leading indicator.
Upwards movement today has support from rising market breadth. There is no new short term divergence.
VOLATILITY – INVERTED VIX CHART
WEEKLY CHART
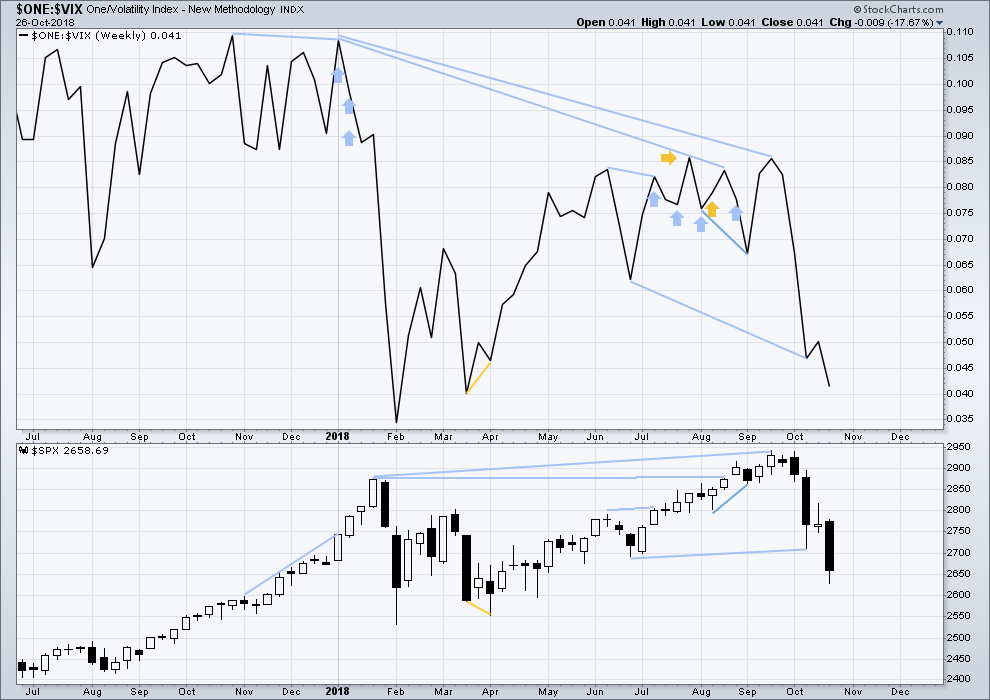
Click chart to enlarge. Chart courtesy of StockCharts.com. So that colour blind members are included, bearish signals
will be noted with blue and bullish signals with yellow.
The fall in price last week comes with a normal corresponding increase in volatility as inverted VIX also declines. There is no new divergence. Last noted mid term bearish divergence has now been resolved.
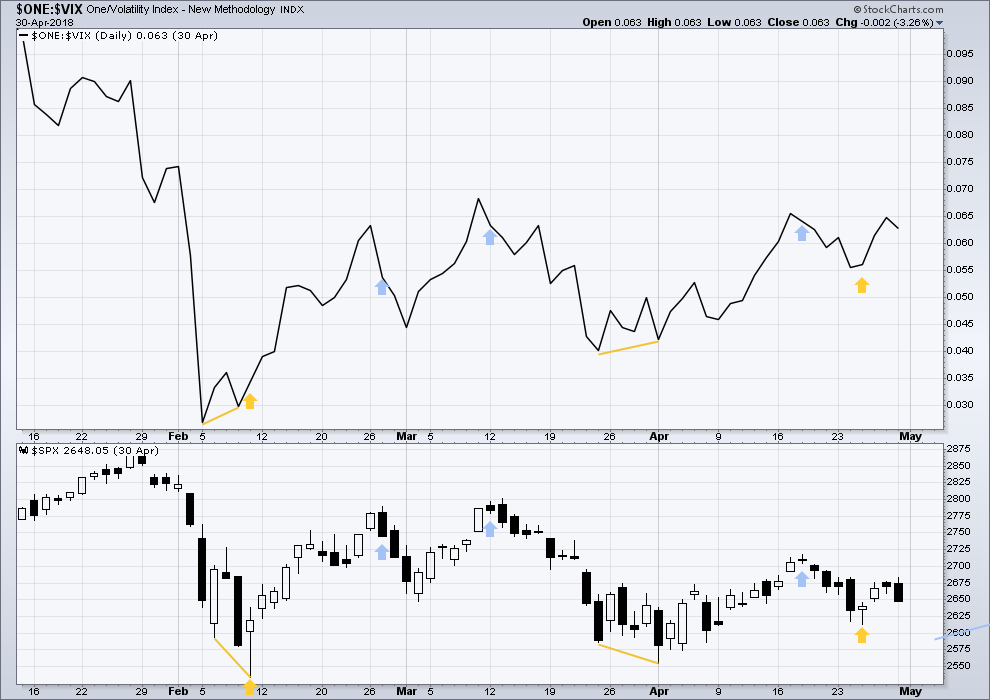
DAILY CHART
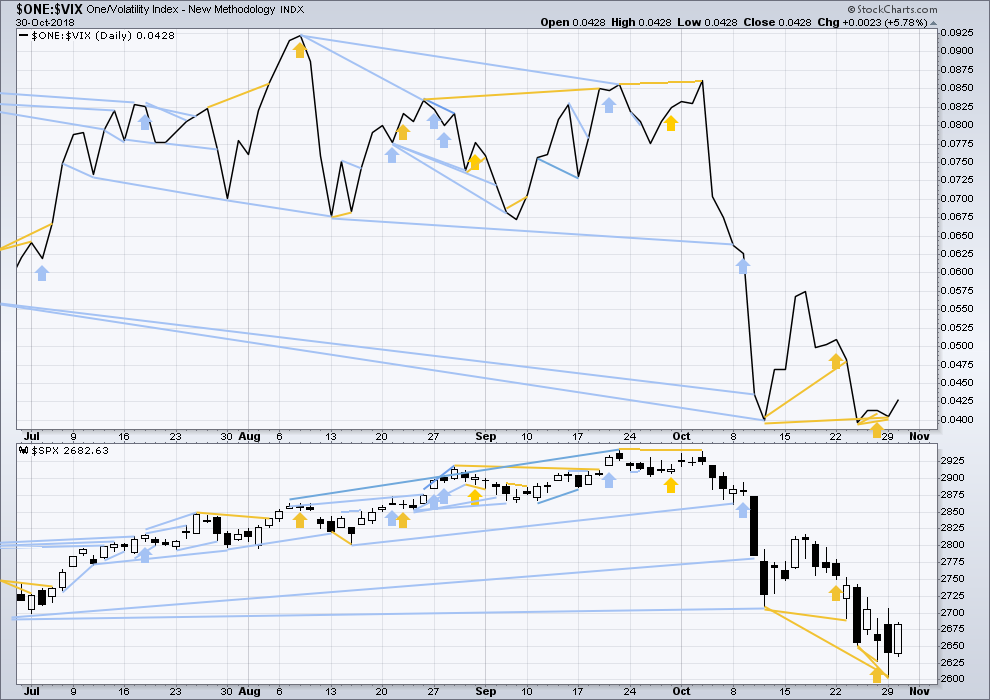
Click chart to enlarge. Chart courtesy of StockCharts.com. So that colour blind members are included, bearish signals
will be noted with blue and bullish signals with yellow.
Normally, volatility should decline as price moves higher and increase as price moves lower. This means that normally inverted VIX should move in the same direction as price.
Bullish divergence has now been followed by an upwards day. The divergence may be resolved here, or it may need more upwards movement to resolve it. Price today moved higher with a normal corresponding decline in VIX. There is no new divergence.
DOW THEORY
The following lows need to be exceeded for Dow Theory to confirm the end of the bull market and a change to a bear market:
DJIA: 23,344.52.
DJT: 9,806.79.
S&P500: 2,532.69.
Nasdaq: 6,630.67.
ANALYSIS OF INTERMEDIATE WAVE (4)
TECHNICAL ANALYSIS
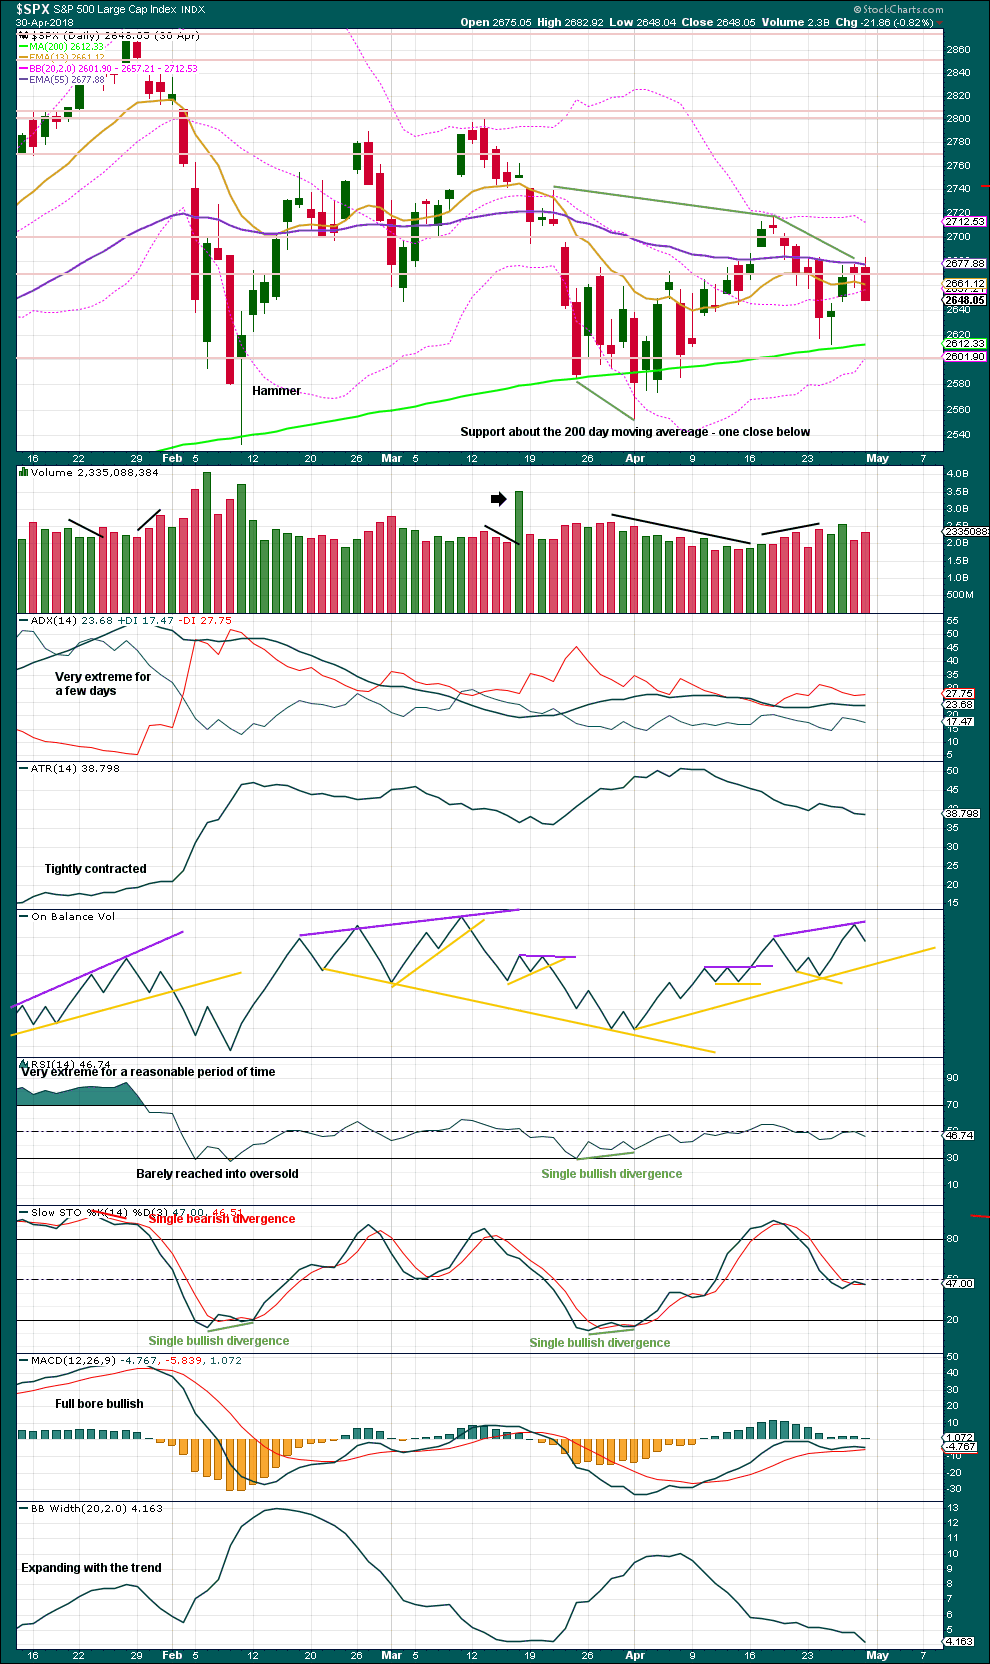
Click chart to enlarge. Chart courtesy of StockCharts.com.
Intermediate wave (4) was a large symmetrical triangle. The deepest wave was the first wave. At its low there was a clear candlestick reversal pattern and bullish divergence between price and Stochastics.
RSI barely managed to reach into oversold.
The current correction for primary wave 4 may behave differently, but there should be some similarities.
It is expected that primary wave 4 may be stronger than intermediate wave (4).
VIX
Click chart to enlarge. Chart courtesy of StockCharts.com.
This is a daily chart.
At the two major lows within intermediate wave (4), inverted VIX exhibited single short term bullish divergence.
At highs within intermediate wave (4), inverted VIX exhibited one single day bullish divergence with price.
AD LINE
Click chart to enlarge. Chart courtesy of StockCharts.com.
This is a daily chart.
At the two major lows within intermediate wave (4), there was bullish divergence between price and the AD line. At the two major highs within intermediate wave (4), there was each one instance of single day bearish divergence.
Published @ 07:11 p.m. EST.
—
Careful risk management protects your trading account(s).
Follow my two Golden Rules:
1. Always trade with stops.
2. Risk only 1-5% of equity on any one trade.
Updated main hourly chart:
A five up is now complete. I’m moving the degree of labelling within it down one, to see it as only minute i within minor A.
Minute ii may not move beyond the start of minute i. But it should be fairly shallow. Look now for support at the breakaway gap from today’s open, which is also about where the upper edge of the blue channel may provide support.
minute v and minor A already done and minor B down starting???? Possible. Or…this is a minuette ii down of the minute v up, and there’s a lot more to go to the upside of this initial minor A up of intermediate B up. Only more price will tell.
or maybe SPX is working through a flat for a minute 4 here, and the minute v up hasn’t launched yet.
SPX has a nice “look” so far….. but what about the RUT…. off the bottom looks like a 3,3,5 any comments?
You are correct even down to the 5 minute chart. The problem is that RUT made its low one day earlier than the SPX. RUT can and does often have a bit of a different count. But if it and other averages do not line up, it usually means a morphing / transition period for the wave count somewhere. All the major US equity averages are highly correlated so they cannot be out of alignment very long.
I think I’d like to hear Chief Lara chime in on this one.
What happens to the indexes as they approach the underside of their 200 day ma will be interesting.
I don’t have an EW count for RUT because I don’t have RUT data on any of the three data feeds I use.
I check it on StockCharts, but they don’t have volume data for it. So that’s a bit limiting.
Looking at StockCharts data I can count a nice five down to the last low for RUT. So now I’d be looking for a decent bounce, maybe up to the 0.618 Fibonacci ratio which is at 1,916.98.
That would see RUT move back above it’s 200 day MA. For this huge correction, it is possible it could fluctuate about the 200 day MA. It doesn’t have to stop when it finds resistance there.
I see SPX having just completed minute 4 of the minor A up. Minute 5 likely to end at the overhead fibos around 2744-47 (but don’t take my word for it…wait for a turn if it happens!). Then the minor B down comes. The lows of that minor B will be another nice spot to enter for a final bite out of the long side via the minor C up, before the big intermediate C down arrives.
As for RUT…I don’t have a count per se but I expect more upside over the next few days consistent with NDX and SPX. It probably tops and turns back down in advance of SPX’s starting up the intermediate C? Similar to a few weeks back, RUT signaled the arriving P4 by breaking down early.
Though if the minute v up here is the length of the minute i up, that lines up with a 78.6% around 2776. If price zooms by 2747.
currently a snail v
Off the bottom, looking at hourly candlesticks, see a short first wave up followed by an expanded flat. I’d label that 1,2.
Now to today’s high, label that a third wave.
It may now be within a fourth wave. Which may not move into first wave price territory below 1,501.30
Good time to check the volume profile for SPY. Sure enough, price is sitting on the HIGHEST PEAK of the entire A wave down (this is an hourly bar chart). There are smaller peaks overhead; expect those generally speaking to be higher potential turn and/or resting places as this B wave develops. Price hanging around in the volume valleys doesn’t happen much; it zooms through them, or into the and back again. Generally.
Kev and gents.
From a novice my brain tells me yes. But can we have the zig zags as Kevin eluded too before in the same trading session. Or does it depend on closing level
Thankyou again
Nino, from an Elliott Wave perspective, price is all that matters. So, intraday price matters and counts. But only for cash makets not extended or overnight trading.
All that being said, B waves are one of the most difficult trades to make because there are well over 20 different possibilities and the wave often morphs into something else. On top of all that, often times B waves are allowed to make new highs and lows without invalidating earlier highs and lows. Therefore, from my perspective if one is to trade B waves, they need to remain nimble and available to make trades all during the trading hours. I cannot achieve the latter, thus I try to stay away from B waves. So for right now, I am taking positions in different markets.
Have a great day everyone.
Thankyou Rodney. Thankyou Kevin
I count the A wave down from the SPX ATH at 18 days.
My take is a B wave is “most likely” to about 1/3 of that in time. So…6 days or so. Today is day 2. Oh, shock and awe…maybe this B wave comes to an end next Wednesday, the day after the election. Maybe.
Gold starting sliding sideways/down over the last week as the market bottomed. I exited a bull GLD spread near the top (but nowhere near full money) anticipating that gold would fall as the B wave went up. So far so good. I’ll be looking to reenter gold next week too.
I see interest rates on the rise again. Currently “helping” by driving finance up. But let me guess that that will (a) continue and (b) be a driver of the mode switch from B up to C down middle of next week when those rates get “too high” and R2K starts rolling over, following by…everything.
Intermediate (B) could of course be as quick as 6 days, but I am actually expecting it may take longer than that.
If it is very quick then primary wave 4 may be too brief. I’ll expect reasonable proportion for primary 4, so intermediate (B) may now be a time consuming sideways kind of correction.
I really am considering making a T-shirt that says “I hate B waves”. Yep.
If today closes anywhere near the present level 2720+, the Mcclellan Oscillator will issue its confirmation of the positive divergences over the past week. It does this by closing above zero. It indicates the B wave or counter trend rally is in progress.
2720-22 is strong resistance. A iv developing under it seems very possible.
Next up is a pair of fibo’s in the 2744-47 range. Hourly squeeze exited obviously. Bam! I’ll be quite surprised if SPX extends past 2747 before initiating a iv of this v wave A up.
Lara thank you for the superb guidance through that A down. It was hairy at the end, and you nailed the start of the B up to the day. Well done!
Thanks Kevin, but I think I got it wrong about three days in a row? I’m not happy with that.
It was really hard to find this low. That bullish divergence appeared, then price kept going down, more bullish divergence, long lower candlestick wicks… all led me to think the low was in a few days ago. I was not happy with my analysis this last week.
2800 out of the question gents ?
For the top of this overall B wave, the 61.8% at 2821 is the most likely top (but of course not guaranteed). Lots of up and down between here and there, since the complete structure up will be a zigzag and this action is still just the A of that zigzag.
Thanks Kevin. Wish it was that more simple. Straight up lol
It’s like life Nino. Never simple!!!
You can make it simple if you want. Lara’s target for the B up is that 61.8% retrace to about 2821. You can just trade “to” that target area, and ride out the bumps between “here and there”. Just don’t expect a straight elevator ride up. That said…trying to watch, count, and anticipate the EW structure at the hourly level (with sneak peaks at the 5 minute as needed to help) is extremely educational and ultimately, will help you refine your entries and exits.
Good advice Kevin. Thanks big man
The “OM” is toast! He should hang it up.
Was it not true long ago?
Yes it was!
New Interim Report out… Now says crash is not needed for his bear to play out… move down without crash and to bottom Nov 7th.
Bearish pundits are always right. Eventually. So eventually, they always point to a strong bearish move and say “I was right”. I’m confident whoever you are referring to will be crowing about their call when the C wave down hits.
Gotta love that channel break!
Yes indeed. Especially if you are long. Good call Peter.
not looking a brilliant strong minute 3 but then I suppose it is a correction?
First …. Boom!