
A new low indicated further downwards movement. The target at 2,612 was not met.
Summary: A new high above 2,722.20 and a breakout of the best fit channel would indicate a low is in place. At that stage, a multi week bounce may be expected to continue towards about 2,878 and likely higher.
A new low below 2,629.16 would indicate more downwards movement. The target is now at 2,544.
A primary degree correction should last several weeks and should show up on the weekly and monthly charts. Primary wave 4 may total a Fibonacci 8, 13 or 21 weeks. Look for very strong support about the lower edge of the teal trend channel on the monthly chart.
Primary wave 4 should be expected to exhibit reasonable strength. This is the last multi week to multi month consolidation in this ageing bull market, and it may now begin to take on some characteristics of the bear market waiting in the wings.
The final target for this bull market to end remains at 3,616, which may be met in October 2019.
New updates to this analysis are in bold.
The biggest picture, Grand Super Cycle analysis, is here.
Last published monthly chart is here, video is here.
ELLIOTT WAVE COUNT
WEEKLY CHART
Click chart to enlarge.
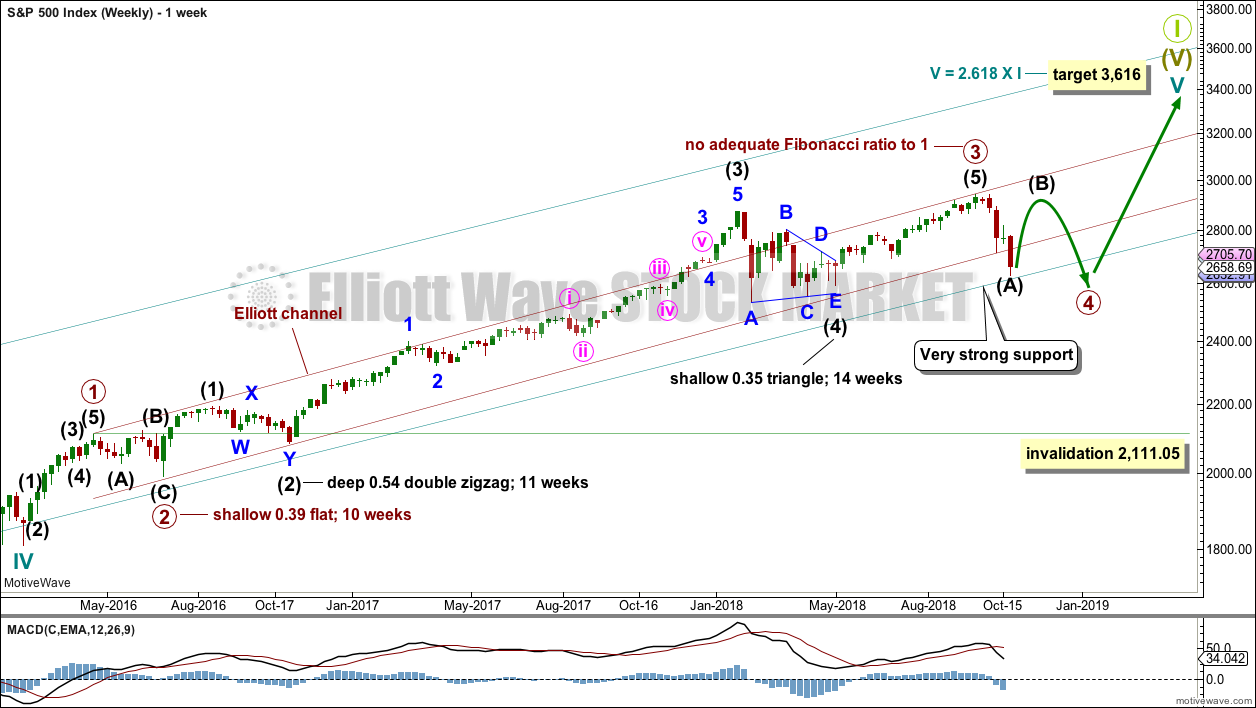
Cycle wave V must complete as a five structure, which should look clear at the weekly chart level and also now at the monthly chart level. It may only be an impulse or ending diagonal. It is clear it is an impulse.
Within cycle wave V, the third waves at all degrees may only subdivide as impulses.
Within primary wave 3, there is perfect alternation and excellent proportion between intermediate waves (2) and (4).
The channel is now drawn about primary degree waves. The first trend line is drawn from the ends of primary waves 1 to 3, then a parallel copy is placed upon the low of primary wave 2. The overshoot of the upper edge of this channel by the end of intermediate wave (3) looks typical. For the S&P, its third waves are usually the strongest portion of an impulse; they often exhibit enough strength to overshoot channels.
Primary wave 4 now has an overshoot on the lower edge of the channel. This is acceptable; fourth waves are not always neatly contained within channels drawn using this technique.
Now that primary wave 4 has broken out of the narrow maroon channel, it may find very strong support about the lower edge of the teal channel. This channel is copied over from the monthly chart and contains the entire bull market since its beginning in March 2009. While Super Cycle wave (V) is incomplete, this channel should not be breached.
Primary wave 4 may not move into primary wave 1 price territory below 2,111.05.
When primary wave 4 may be complete, then the final target may be also calculated at primary degree. At that stage, the final target may widen to a small zone, or it may change.
At this stage, the expectation is for the final target to be met in October 2019. If price gets up to this target and either the structure is incomplete or price keeps rising through it, then a new higher target would be calculated.
DAILY CHART
Click chart to enlarge.
Primary wave 4 would most likely end somewhere within the price territory of the fourth wave of one lesser degree. Intermediate wave (4) has its price territory from 2,872.87 to 2,532.69. Within this range sit the 0.236 Fibonacci ratio at 2,717 and the 0.382 Fibonacci ratio at 2,578.
The 0.382 Fibonacci ratio would expect an overshoot of the teal channel. This may be too low; price may find support at the lower edge of the channel. However, as primary wave 4 should be expected to exhibit reasonable strength, it may be able to overshoot the channel and that would look reasonable. This possibility is now more seriously considered.
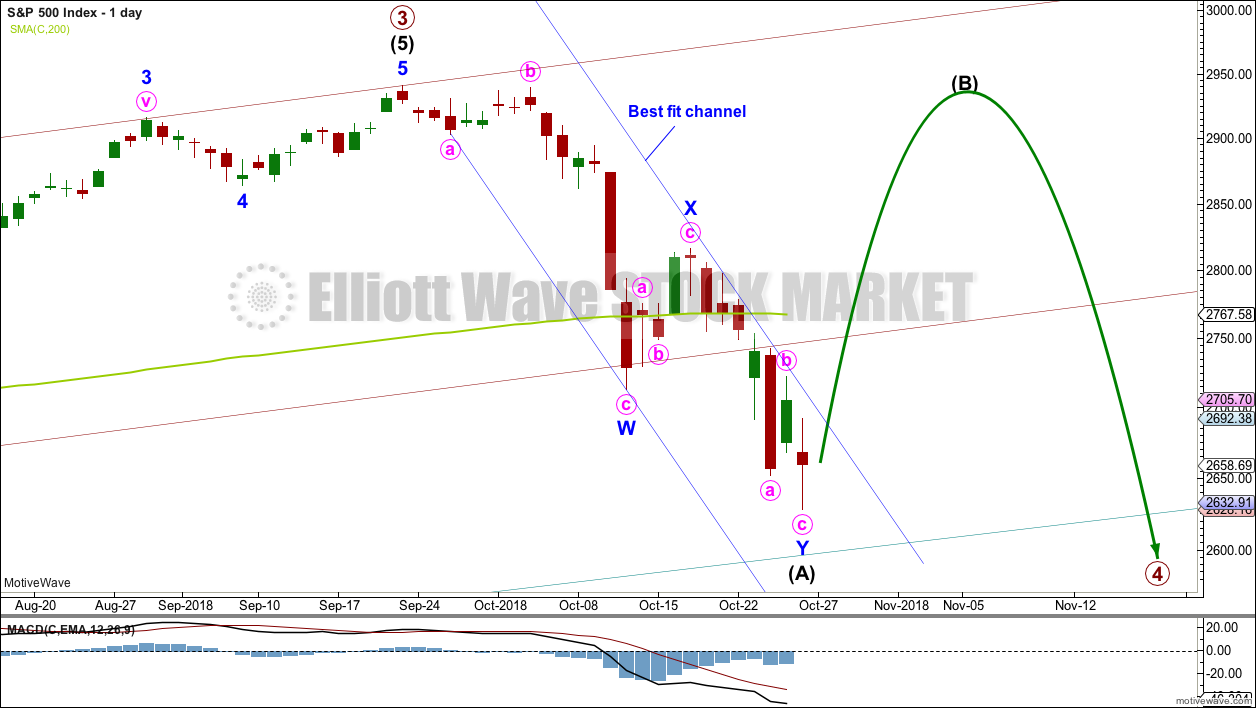
Primary wave 2 unfolded as a shallow regular flat correction lasting 10 weeks.
Intermediate wave (A) may now be a complete double zigzag. There is reasonable proportion within this wave count between minor waves W and Y.
Primary wave 4 may be subdividing as a flat or triangle. Because a flat would not offer alternation with the structure of primary wave 2, a triangle may be more likely.
When the first wave within a correction subdivides as a three, then the next wave is usually very deep. Intermediate wave (B) should be expected to be very deep in relation to intermediate wave (A); if primary wave 4 unfolds as an expanded flat or a running triangle, then it may make a new high above the start of intermediate wave (A). There is no upper invalidation point for this reason.
Primary wave 4 may not move into primary wave 1 price territory below 2,111.05.
HOURLY CHART
Click chart to enlarge.
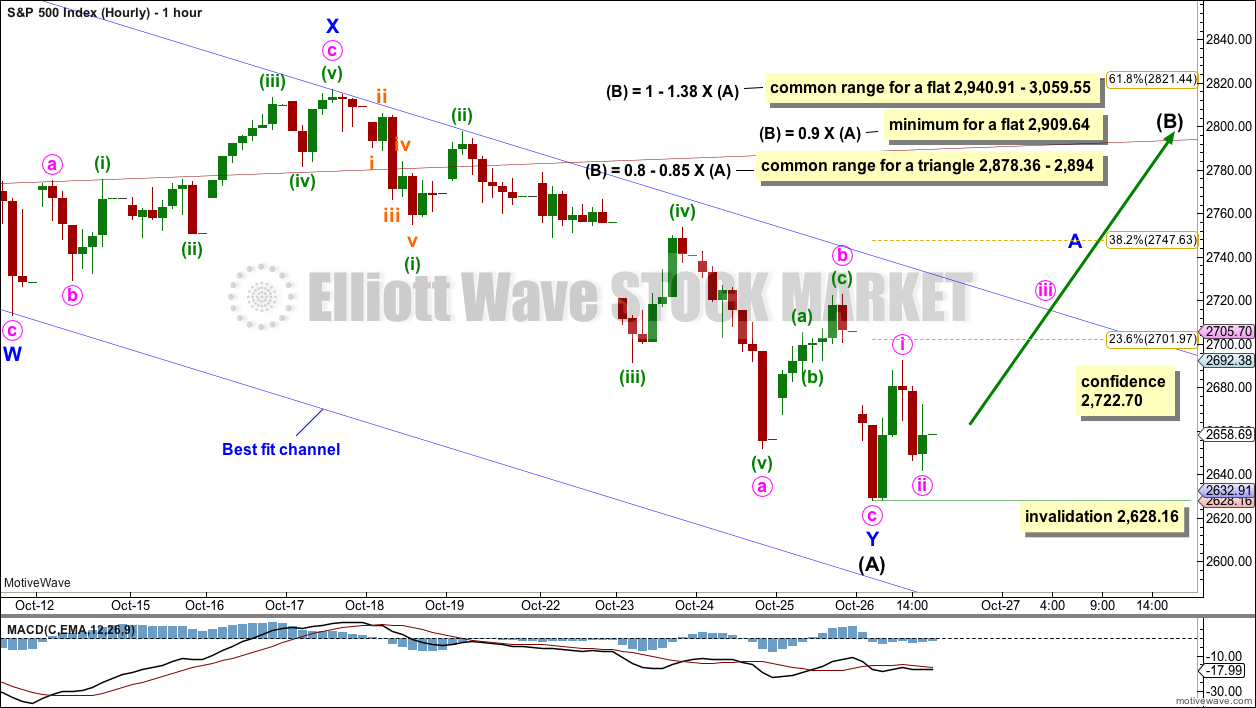
A new high above 2,722.70 by any amount at any time frame would be required for confidence that a low is in place. If price breaks out above the upper edge of the blue channel, that would provide additional confidence.
Intermediate wave (B) may be expected to last a few weeks and be very deep. No second wave correction within intermediate wave (B) may move beyond the start of its first wave below 2,628.16.
Intermediate wave (B) may unfold as one of more than 23 possible corrective structures. B waves exhibit the greatest variety in structure and price behaviour. They can be very complicated time consuming sideways corrections, or equally as likely they can be quick sharp zigzags.
ALTERNATE DAILY CHART
Click chart to enlarge.
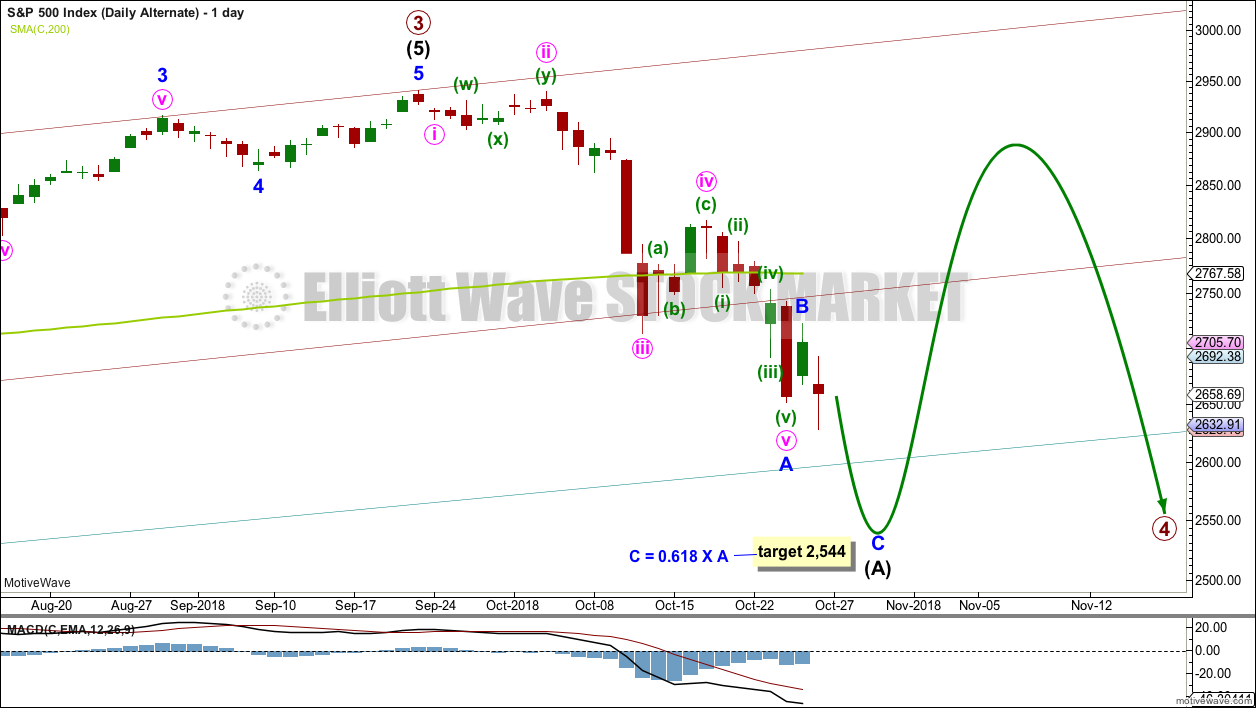
It is also possible that intermediate wave (A) may be incomplete. If it is incomplete, then it may be unfolding as a single zigzag. Minor wave C would be likely to move lower in order to have better proportion to minor wave A.
A target is given for minor wave C to end. This target would expect to see an overshoot of the teal channel. If the lower teal trend line is overshot, then it would be most likely to see price move back to within the channel quickly. It would be unlikely to see a full daily candlestick below the channel.
When intermediate wave (A) could be a complete zigzag, then thereafter intermediate wave (B) would be expected to be a very deep multi week correction, which may make a new high above the start of intermediate wave (A).
ALTERNATE HOURLY CHART
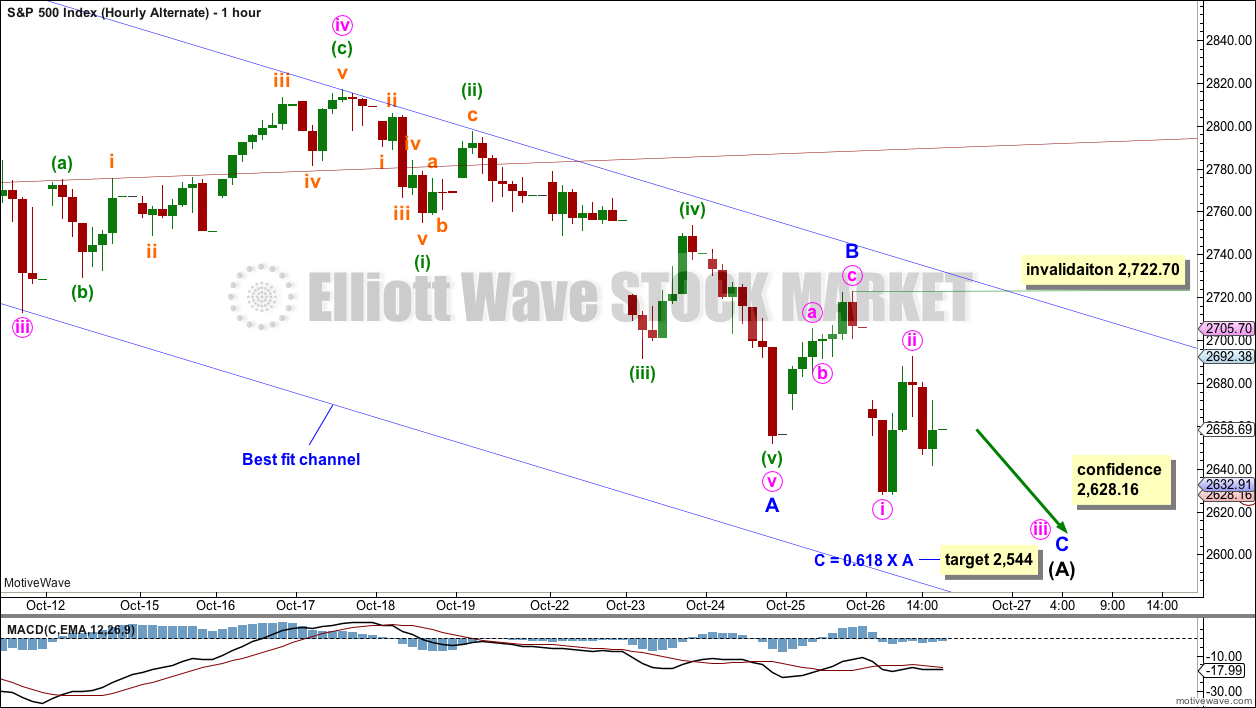
Click chart to enlarge.
If intermediate wave (A) is unfolding as a single zigzag, then minor wave C within it may be incomplete.
Within minor wave C, minute wave ii may not move beyond the start of minute wave i above 2,722.70.
TECHNICAL ANALYSIS
WEEKLY CHART
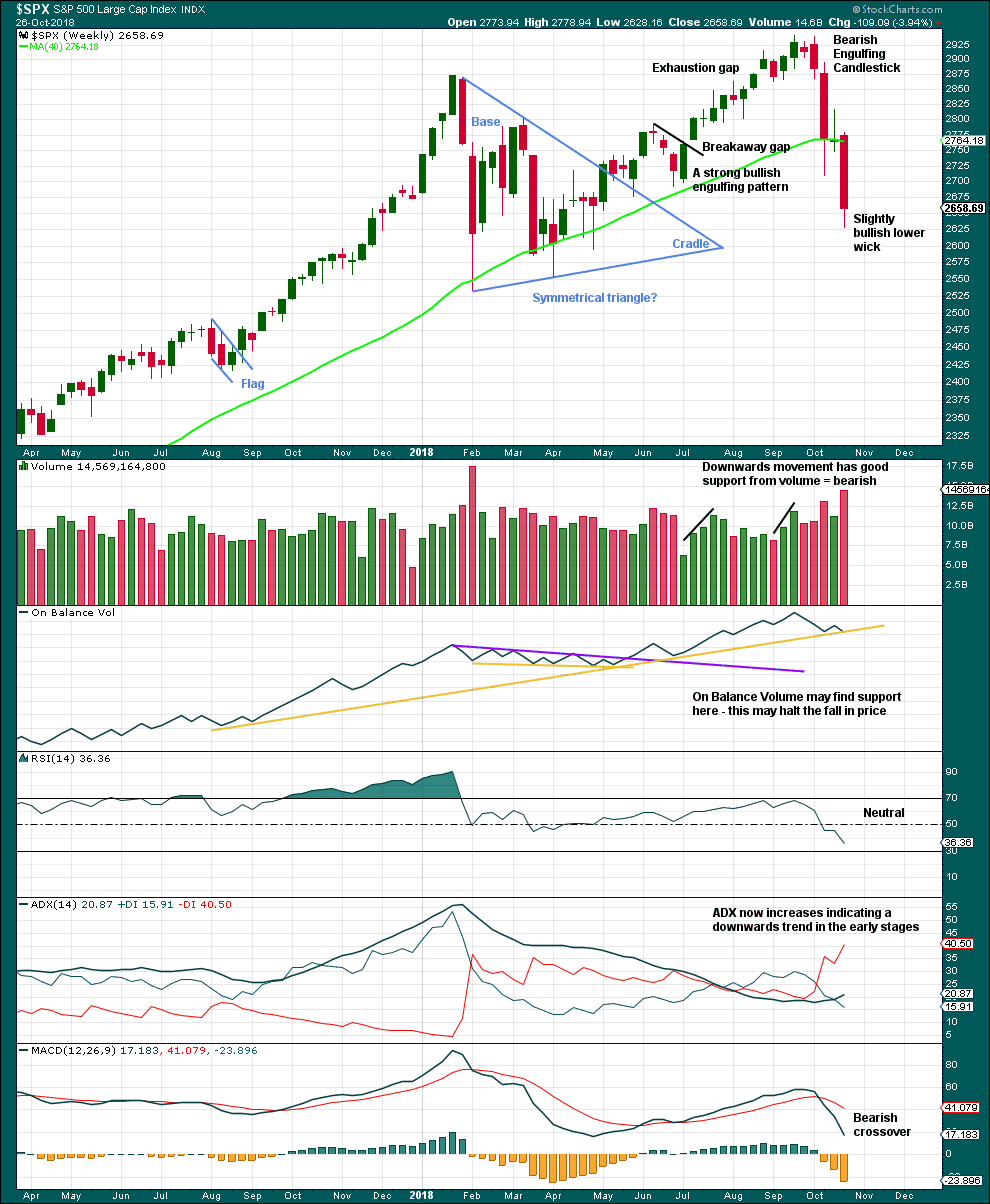
Click chart to enlarge. Chart courtesy of et=”_blank”>StockCharts.com.
Support for On Balance Volume along with a slightly longer candlestick wick looks slightly bullish. A low for the first downwards swing within a consolidation may be found here or very soon next week.
DAILY CHART
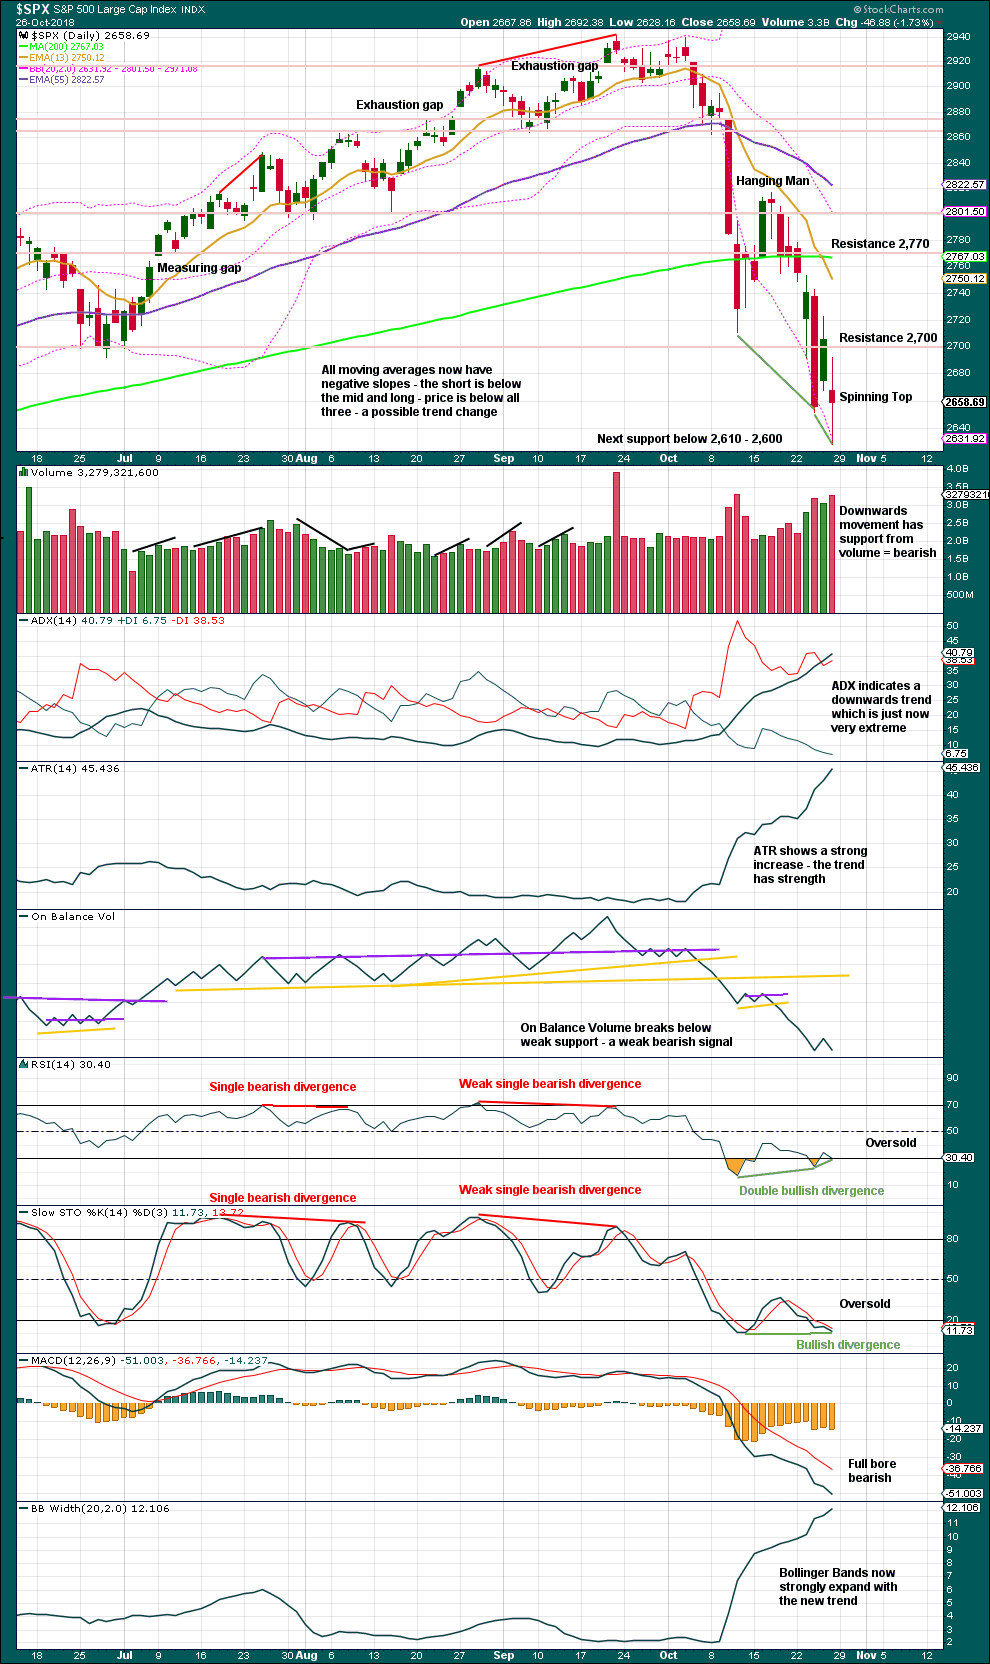
Click chart to enlarge. Chart courtesy of StockCharts.com.
The Spinning Top candlestick pattern puts the trend from bearish to neutral. On its own, it is not a reversal pattern.
With RSI now exhibiting double bullish divergence while oversold, it looks more likely that a low may now be in place. This offers reasonable support now to the main Elliott wave count.
BREADTH – AD LINE
WEEKLY CHART
Click chart to enlarge. Chart courtesy of StockCharts.com.
Falling price again has support from a decline in market breadth. Breadth is falling in line with price. There is no divergence either way.
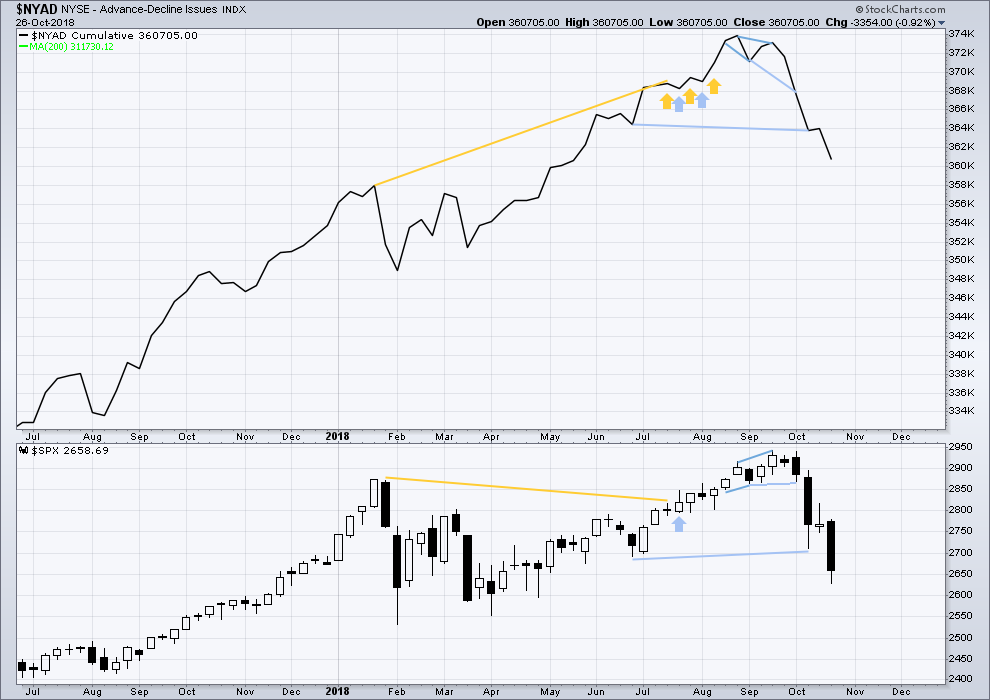
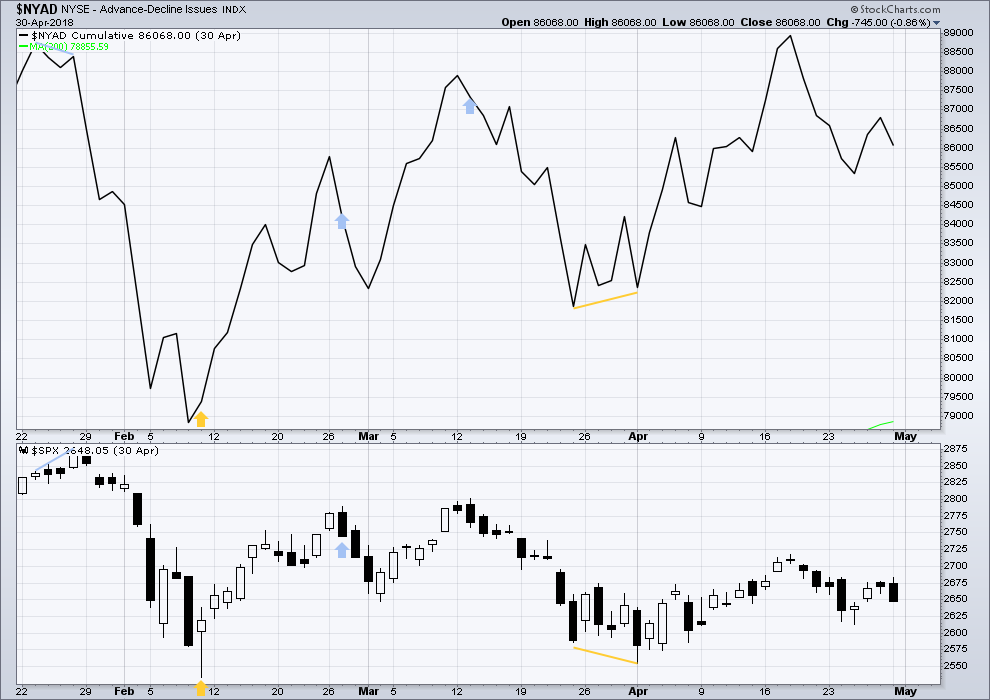
DAILY CHART
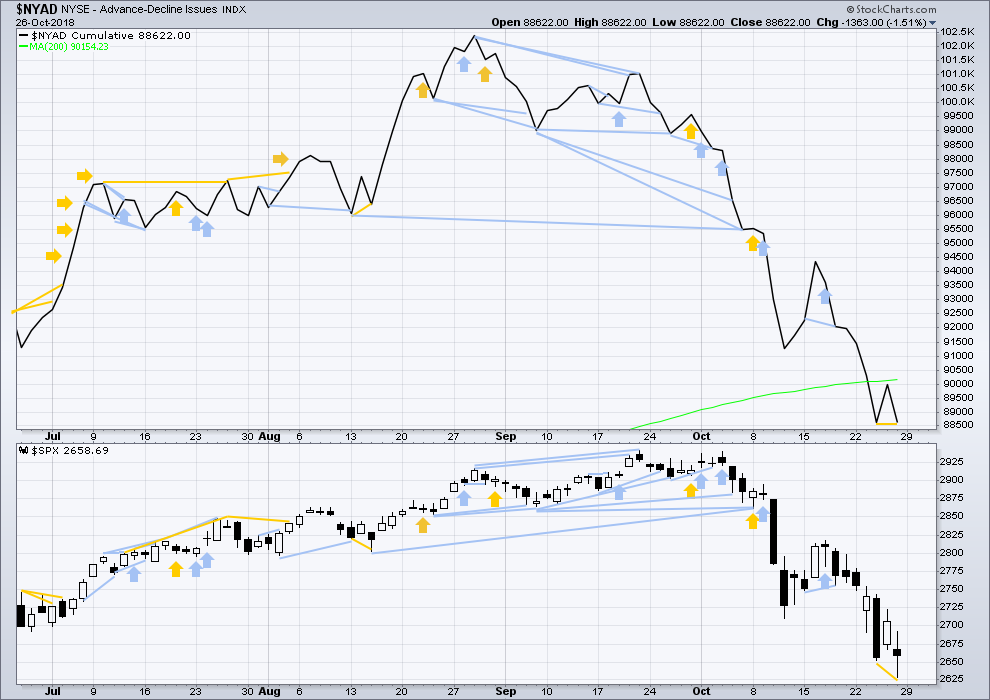
Click chart to enlarge. Chart courtesy of StockCharts.com.
There is normally 4-6 months divergence between price and market breadth prior to a full fledged bear market. This has been so for all major bear markets within the last 90 odd years. With no longer term divergence yet at this point, any decline in price should be expected to be a pullback within an ongoing bull market and not necessarily the start of a bear market. New all time highs from the AD line on the 29th of August means that the beginning of any bear market may be at the end of December 2018, but it may of course be a lot longer than that. My next expectation for the end of this bull market may now be October 2019.
Breadth should be read as a leading indicator.
Price has made a new short term swing low, but the AD line is flat. There may be bullish divergence here, but it is weak.
VOLATILITY – INVERTED VIX CHART
WEEKLY CHART
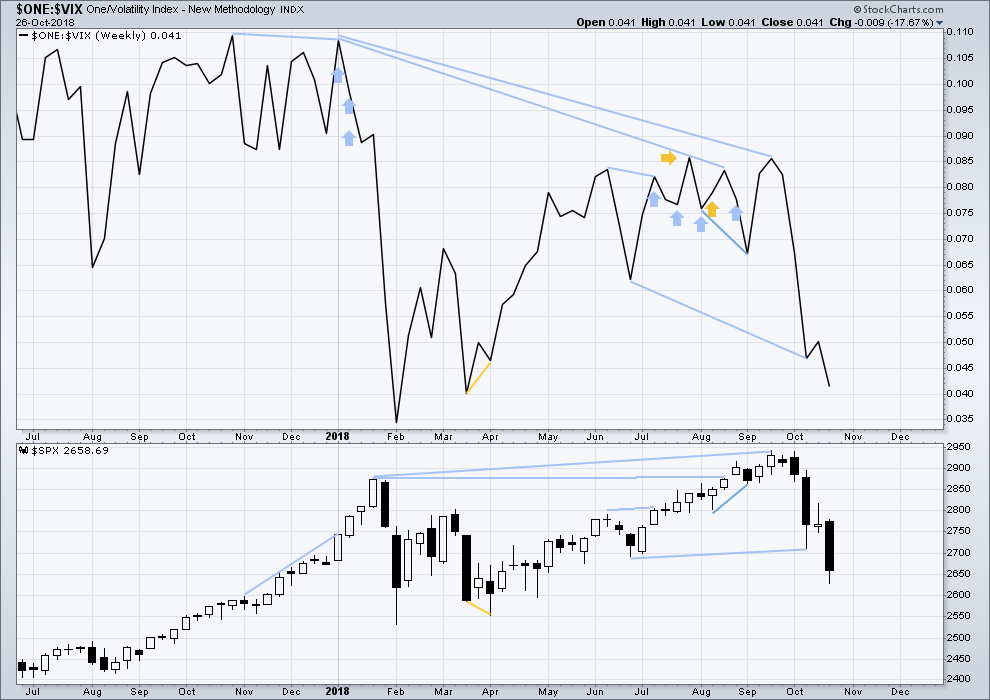
Click chart to enlarge. Chart courtesy of StockCharts.com. So that colour blind members are included, bearish signals
will be noted with blue and bullish signals with yellow.
The fall in price this week comes with a normal corresponding increase in volatility as inverted VIX also declines. There is no new divergence. Last noted mid term bearish divergence has now been resolved.
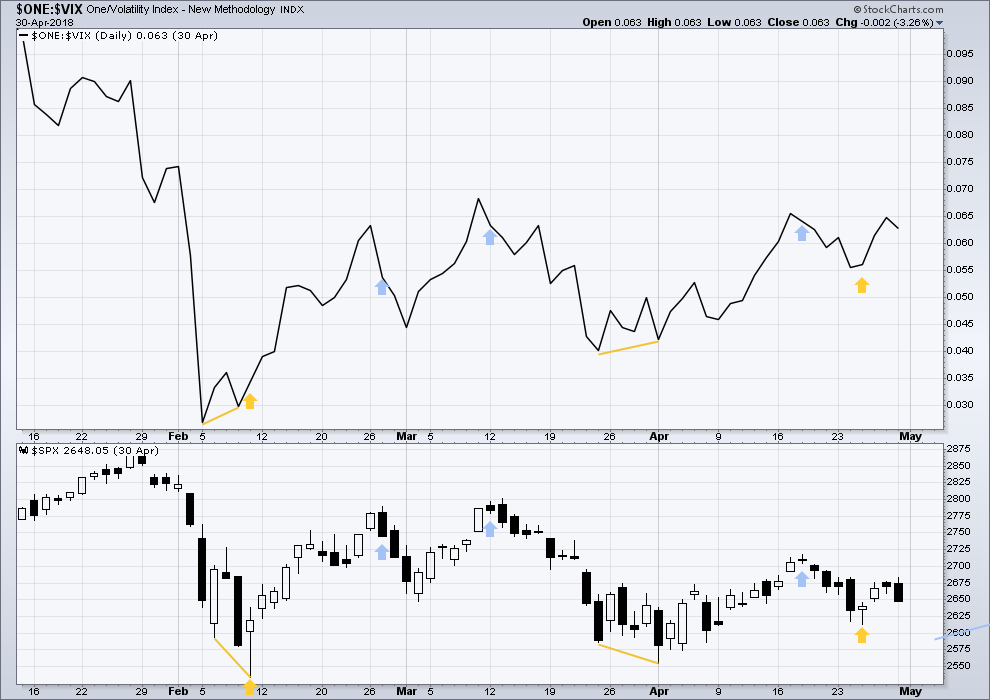
DAILY CHART
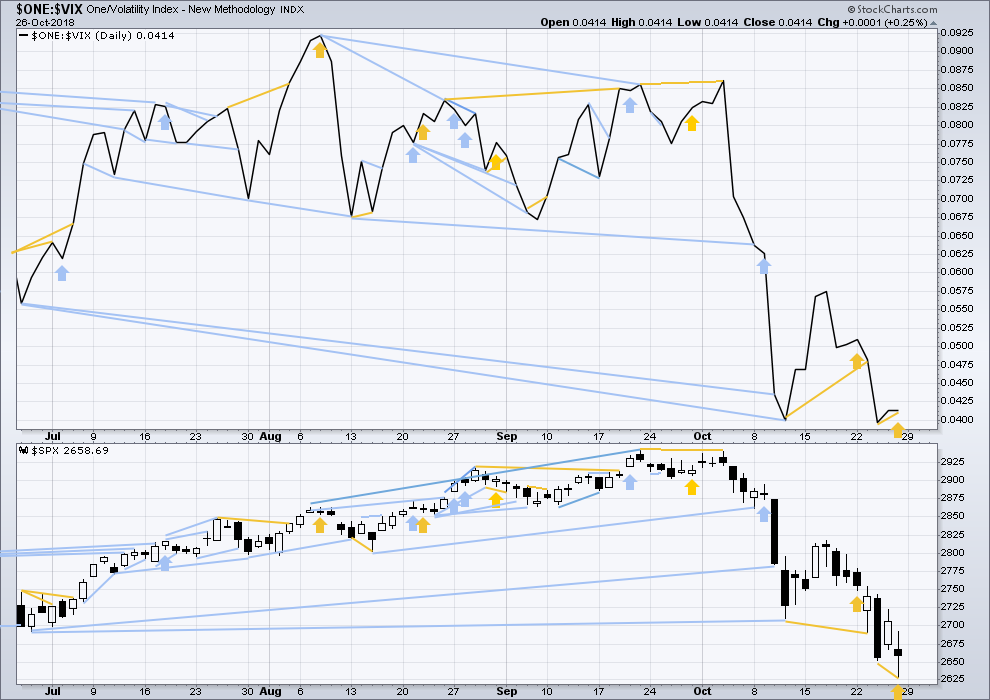
Click chart to enlarge. Chart courtesy of StockCharts.com. So that colour blind members are included, bearish signals
will be noted with blue and bullish signals with yellow.
Normally, volatility should decline as price moves higher and increase as price moves lower. This means that normally inverted VIX should move in the same direction as price.
There is now short term bullish divergence between lows in price and inverted VIX. There is also weak bullish single day divergence as price moved lower on Friday but inverted VIX was flat.
DOW THEORY
The following lows need to be exceeded for Dow Theory to confirm the end of the bull market and a change to a bear market:
DJIA: 23,344.52.
DJT: 9,806.79.
S&P500: 2,532.69.
Nasdaq: 6,630.67.
ANALYSIS OF INTERMEDIATE WAVE (4)
TECHNICAL ANALYSIS
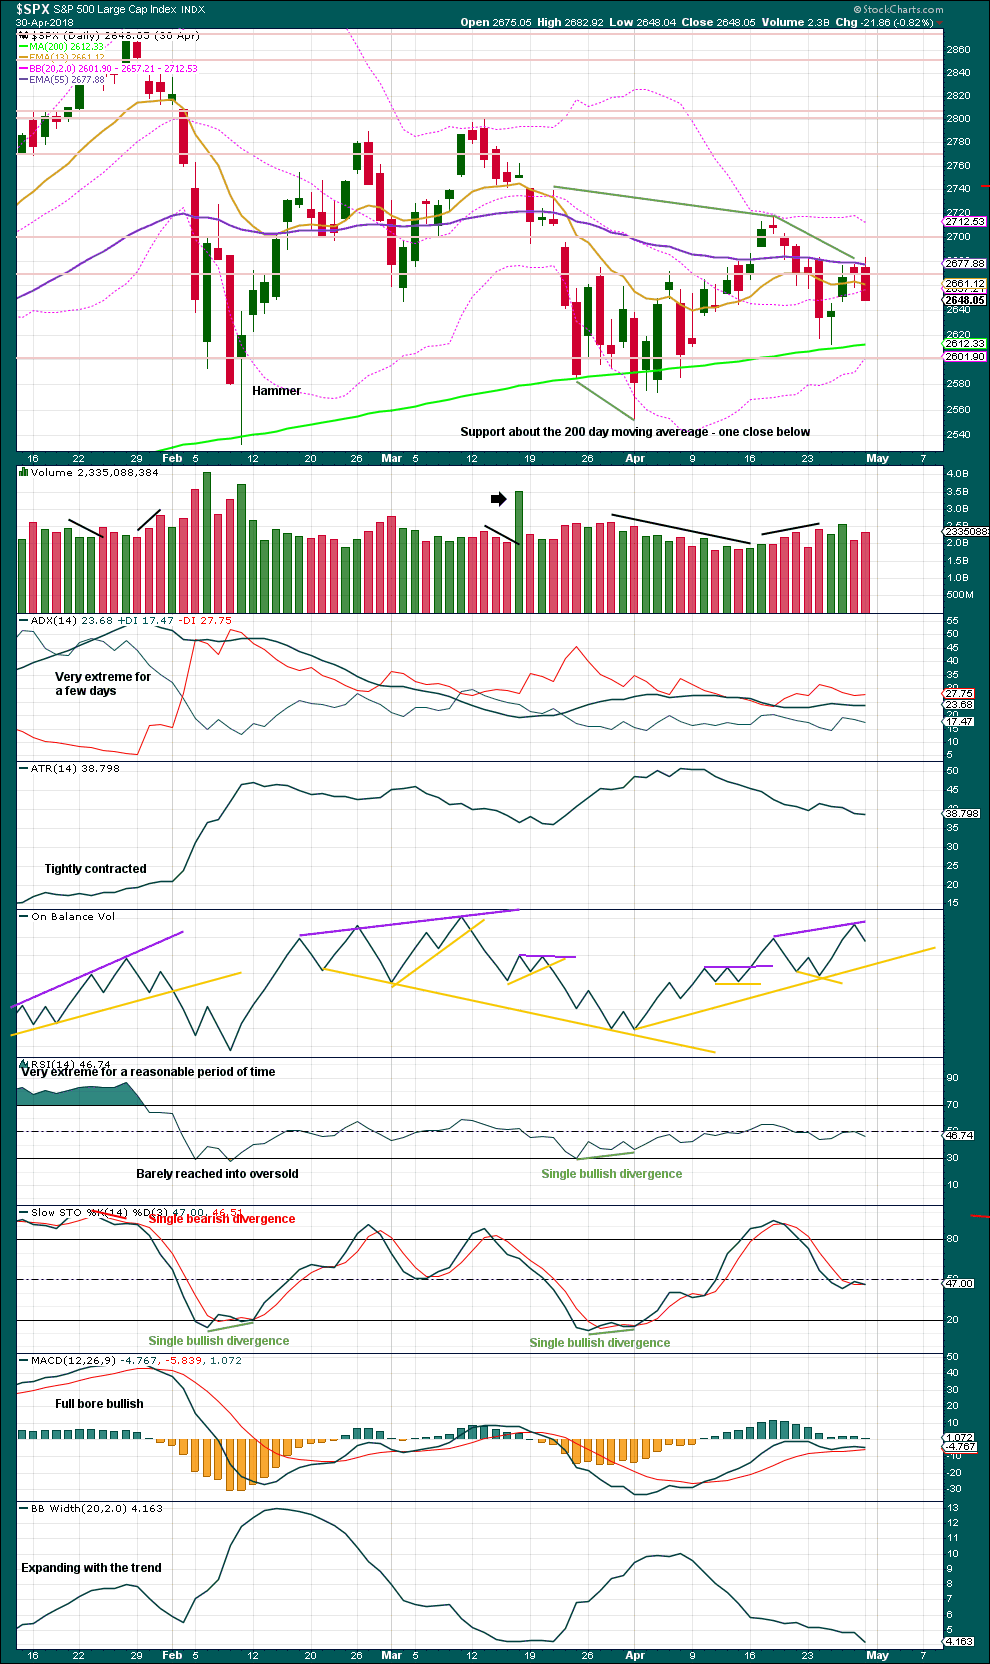
Click chart to enlarge. Chart courtesy of StockCharts.com.
Intermediate wave (4) was a large symmetrical triangle. The deepest wave was the first wave. At its low there was a clear candlestick reversal pattern and bullish divergence between price and Stochastics.
RSI barely managed to reach into oversold.
The current correction for primary wave 4 may behave differently, but there should be some similarities.
It is expected that primary wave 4 may be stronger than intermediate wave (4).
VIX
Click chart to enlarge. Chart courtesy of StockCharts.com.
This is a daily chart.
At the two major lows within intermediate wave (4), inverted VIX exhibited single short term bullish divergence.
At highs within intermediate wave (4), inverted VIX exhibited one single day bullish divergence with price.
AD LINE
Click chart to enlarge. Chart courtesy of StockCharts.com.
This is a daily chart.
At the two major lows within intermediate wave (4), there was bullish divergence between price and the AD line. At the two major highs within intermediate wave (4), there was each one instance of single day bearish divergence.
Published @ 12:41 a.m. EST on 27th October, 2018.
—
Careful risk management protects your trading account(s).
Follow my two Golden Rules:
1. Always trade with stops.
2. Risk only 1-5% of equity on any one trade.
What’s that saying? Oh yea, “tops are a process, bottoms are an event”.
Looks like a event to me.
That’s all she wrote…for now! 🙂
Anybody else going long here?
That is what margin calls look like, quickly and precisely followed by FED intervention
As we all expected…! 🙂
Actually swung long at 2610, probably means we get smashed tomorrow but we’ll see…..
We are playing it a bit more conservatively with a massive deployment of bull put spreads, while holding long calls from half of bear call spreads. Did you see the premiums on option contracts lately??!! We will jump on futures if they ramp overnight. Yikes!! 🙂
Yes indeed, did a few of those on DJIA and Nasdaq
We can now expect them to furiously ramp for all they are worth, but sadly for them, they cannot mend what is so clearly broken. After they have given it their best shot, I will be happily taking the other side of that trade…Lock and Load!! 🙂
ramp to 2720ish would look good to me
Curtis, earlier today or this weekend you asked, “Any recommendations for other helpful Twitter accounts to follow?”
I can’t say that anything comes to mind. But I do follow Chris Ciovacco’s weekly you tube analysis. I think he is one of the best available especially for longer term.
Thank you, Rodney.
My 50% long position has been closed at a break even. Will now wait for target of 2544 to try again. I am guessing a new low below 2628 is coming soon.
Updated main hourly chart:
Minute ii may be continuing as a very deep expanded flat.
A new low by any amount at any time frame would invalidate this count in favour of the alternate.
Alternate hourly chart updated:
If this wave count has confidence with a new low today, then expect an increase in downwards momentum as a low degree third wave continues down.
And now we have invalidation of the main count, and confidence in the alternate.
I’m going to look at one more way to label intermediate (A) down…. coming in a moment….
Okay, so I tried looking at minor B continuing as a barrier triangle, but the b-d trend line would have a downwards slope so I’m discarding that idea.
What if minor B is continuing as a combination? It fits as a zigzag – X – expanded flat.
If this idea is correct, then minor B could complete and be followed by one final relatively short minor C to new lows, and then that could be it for intermediate (A).
Another bloodbath in the monsters of tech (FAANGM stocks). Amzn down 6.3%, NFLX down 4.8%, the least hammered is AAPL at “only” 1.1%. Equal weighted ticker down 3.2%. Overall, the equal weighted ticker I have is down 15% now from the high about 5 weeks ago.
Probably not a bad idea to cash in any remaining short trades at the end of the day.
Have a great evening all!
On the 5 minute SPX chart, I am currently counting a pair of nested 1-2’s off the low. Of course, it equally counts as an a-b-c corrective pattern. If SPX breaks below 2641.82. then the nest pair of 1-2’s count will be invalidated and Verne’s call for today will most likely be right on. Which means I will need to trade extended hours if I want another try at catching the falling knife. Today and tomorrow should be decisive one way or the other.
This morning I raised the stops on my 50% long position to break even.
Here is another possibility
Could be, but your iv looks seriously out of proportion to your ii. Your first idea — nested 1-2’s — seems more likely to me the moment.
We are in a fourth wave…likely a fourth of a fifth…..
Yes. Instead if (1)-(2) it could be a-b-c up to today’s high of 2706 and now we are starting the bigger wave 5 down. In fact, the idea of one more new low is looking better as the day proceeds.
Yes. Canceling STB long.
One rather bullish data point: finance is on fire last friday and today. XLF up 2.6% today!! Interest rates back into “rising” mode (though in the middle of a large range). And I see every single spider sector fund up today at this point.
They will likely complete the move down into the close, and start the real retrace in overnight futures. It is the perfect scheme to keep bull and bear alike befuddled. Yep, that is the way they think….
I’m looking for the McClellan Oscillator to close above zero today. If that happens it will give a confirmation of the earlier positive divergence signal we received last week. Right now at the open it is just below zero. This indicator has moved to strongly bullish.
SPX is now above the high for Friday suggesting bullish strength.
The SPX gap from Thursday of last week has been closed. It is no longer considered a breakaway gap. Rather, it can be considered an exhaustion gap.
Come on folks! I am still the only one here who thinks the Intermediate A of Primary 4 is in?
I’m with ya pardner, I’m getting (short term) long here for sure, some outright calls, some sales of puts, some vertical spreads. It’s bottom just above the 78.6% of the A down of the intermediate 4, and given plenty of “up” signals for me.
Here’s my view of the landscape above. I agree with Verne that a very likely target for a turn is the 61.8% of the whole move which (shock and awe re: fractal market structure!) is very very closet to the top of the “B of the A wave”. 2818-2821 zone.
Maybe I should have listened a bit more to my assessment from last week: “probably some backing/filling here between the lows and the down trend line overhead”. Indeed.
Not quite yet.
One more interim low before the larger B or second.
Let us know if/when the action today changes your outlook. It’s already sealed mine. Generally up now for 3-10 days is what I expect, roughly. BUT it may be EXTREMELY volatile.
It appears that the C wave down is setting up perfectly to start up the day after the election. Which would not be shocking in the slightest.
2670ish?
We need to take out 2628.16…
Thank you!
😉
I got this bouncing to 2720ish tomorrow.
Probably a bit higher….
If it turns out to be B wave, we could not exclude an expanded flat, and talk about banksters throwing a monkey wrench….!! 🙂
Thank you for the link below, Rodney. Someone else mentioned Twitter here the other day. Any recommendations for other helpful Twitter accounts to follow?
Some interesting tweets at the following link. I tried to save and post as an image. But was unsuccessful.
https://twitter.com/ukarlewitz?ref_src=twsrc%5Egoogle%7Ctwcamp%5Eserp%7Ctwgr%5Eauthor
Hi Rodney: I read the tweets and they are interesting… but I am not sure what of the point you’re trying to make as it relates to the market. Is it the one specific tweet on SPX history?
The one quote that stuck out for me is this:
“The set up for higher prices, at least before a significantly lower low, appears strong. This is not a certainty, but it is a high probability.”
Just support for the bullish case and my long position.
Also the comparison to Feb 2009, 1963 and April 1970 is noteoworthy.
We could be some kind of smaller triangle ahead of a final move down to complete the current decline, which should be followed by a 62% retrace of the entire move down in a larger “B” or second wave upwards. The following C or 3 down will be this year’s best money-maker… 🙂
Thanks
Thanks Lara. I don’t know how you do it day in – day out, week in – week out. So steady, concise and well thought out. As I said this week, I am grateful for EWSM. Have a great weekend and take care of the all my little Kiwi friends.
Thanks Rodney! I am still volunteering at Marunui Conservation, looking after the Kiwi birds there. They’re nesting, and chicks should be hatching shortly. A very exciting time of the year!
First!!!
Fast!
Fabulous.
Andrewlee, you may pick up your first place award at the contestants booth.
Drat!! I’ll blame a world series baseball game for going 18 innings (and then the bums winning, double drat!) leading to sleeping in (also much needed after 4 days of up at 5:45am!). And into the slot from out of nowhere rushes Andrewlee, outpacing even the reliable Rodney.
Looking forward already to the start of the fresh race on Monday. Weeeee!!!! Isn’t volatility wunnerful?