
An inside day is inconclusive.
Two Elliott wave counts are provided for members today.
Summary: It looks somewhat more likely that the first big wave down within primary wave 4 could be over at yesterday’s low. A multi week bounce may have begun today. Look for resistance at the lower edge of the maroon channel.
If price makes a new low below 2,651.89, then expect it to fall to a target at 2,612, which is just above support about 2,610 to 2,600.
A primary degree correction should last several weeks and should show up on the weekly and monthly charts. Primary wave 4 may total a Fibonacci 8, 13 or 21 weeks. Look for very strong support about the lower edge of the teal trend channel on the monthly chart.
Primary wave 4 should be expected to exhibit reasonable strength. This is the last multi week to multi month consolidation in this ageing bull market, and it may now begin to take on some characteristics of the bear market waiting in the wings.
The final target for this bull market to end remains at 3,616, which may be met in October 2019.
New updates to this analysis are in bold.
The biggest picture, Grand Super Cycle analysis, is here.
Last published monthly chart is here, video is here.
ELLIOTT WAVE COUNT
WEEKLY CHART
Click chart to enlarge.
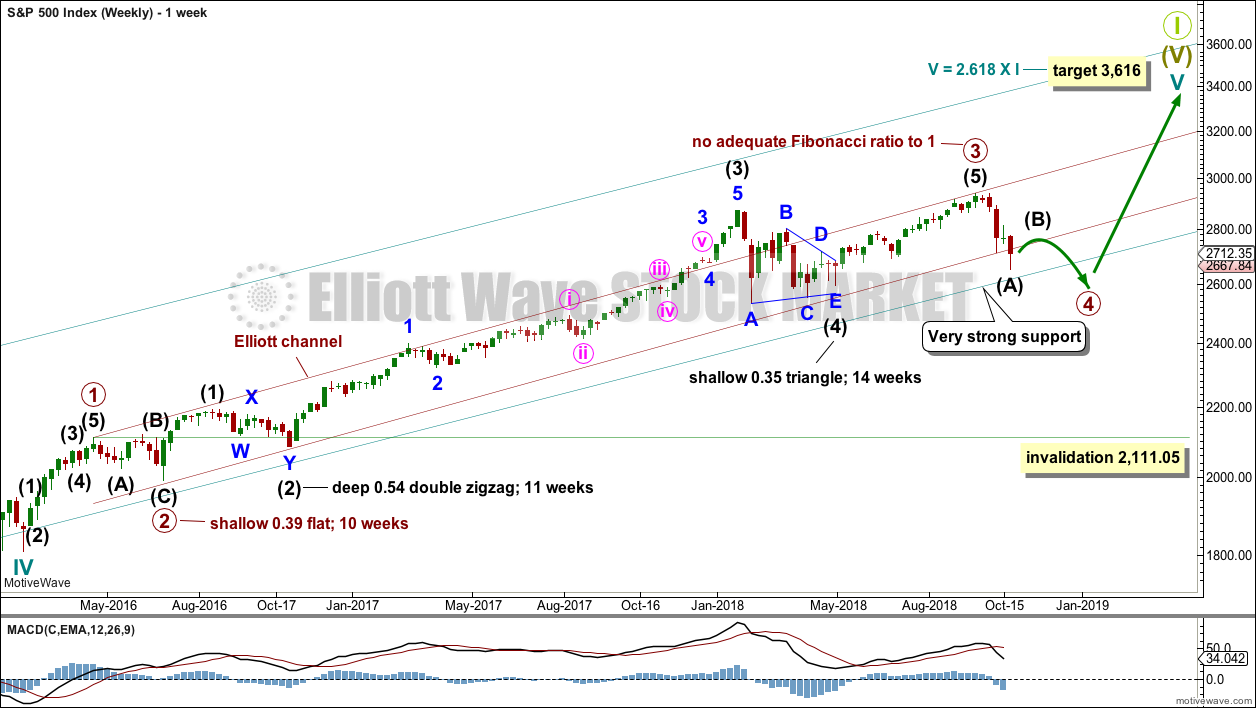
Cycle wave V must complete as a five structure, which should look clear at the weekly chart level and also now at the monthly chart level. It may only be an impulse or ending diagonal. It is clear it is an impulse.
Within cycle wave V, the third waves at all degrees may only subdivide as impulses.
Within primary wave 3, there is perfect alternation and excellent proportion between intermediate waves (2) and (4).
The channel is now drawn about primary degree waves. The first trend line is drawn from the ends of primary waves 1 to 3, then a parallel copy is placed upon the low of primary wave 2. The overshoot of the upper edge of this channel by the end of intermediate wave (3) looks typical. For the S&P, its third waves are usually the strongest portion of an impulse; they often exhibit enough strength to overshoot channels.
Primary wave 4 now has an overshoot on the lower edge of the channel. This is acceptable; fourth waves are not always neatly contained within channels drawn using this technique.
If primary wave 4 breaks out of the narrow maroon channel, then it may find very strong support about the lower edge of the teal channel. This channel is copied over from the monthly chart and contains the entire bull market since its beginning in March 2009. While Super Cycle wave (V) is incomplete, this channel should not be breached.
Primary wave 4 may not move into primary wave 1 price territory below 2,111.05.
When primary wave 4 may be complete, then the final target may be also calculated at primary degree. At that stage, the final target may widen to a small zone, or it may change.
At this stage, the expectation is for the final target to be met in October 2019. If price gets up to this target and either the structure is incomplete or price keeps rising through it, then a new higher target would be calculated.
DAILY CHART
Click chart to enlarge.
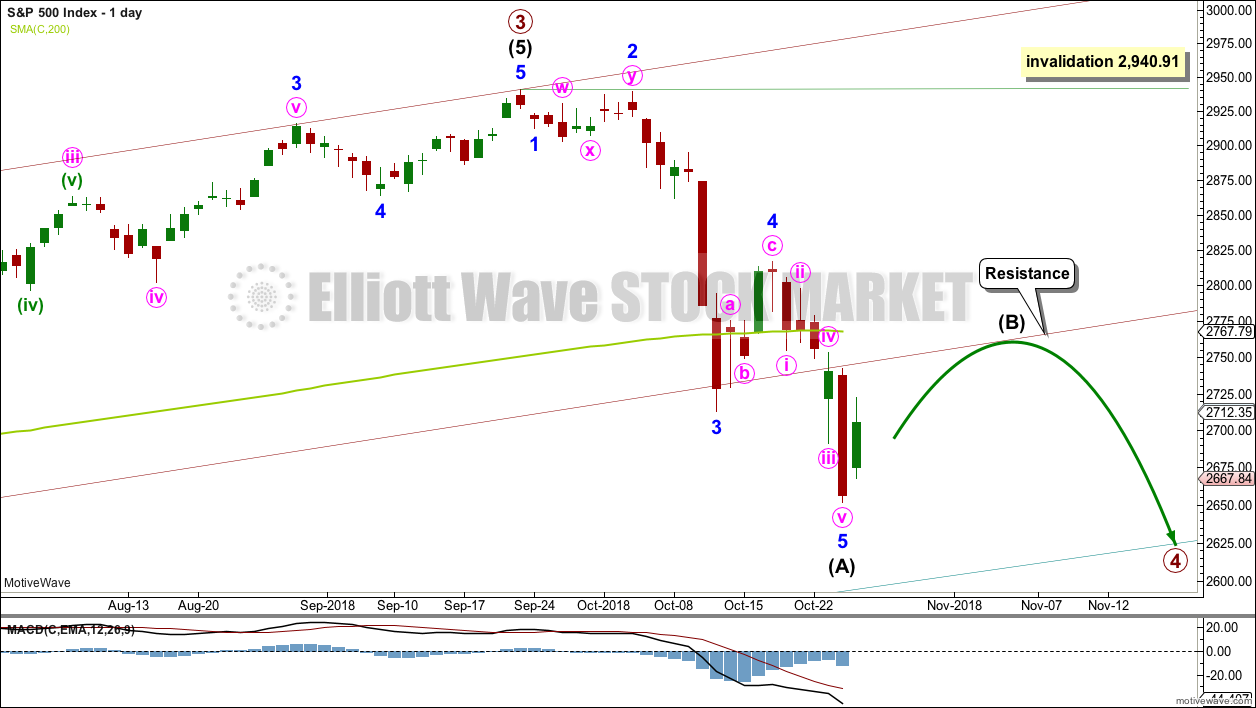
Primary wave 4 would most likely end somewhere within the price territory of the fourth wave of one lesser degree. Intermediate wave (4) has its price territory from 2,872.87 to 2,532.69. Within this range sit the 0.236 Fibonacci ratio at 2,717 and the 0.382 Fibonacci ratio at 2,578.
The 0.382 Fibonacci ratio would expect an overshoot of the teal channel. This may be too low; price may find support at the lower edge of the channel. However, as primary wave 4 should be expected to exhibit reasonable strength, it may be able to overshoot the channel and that would look reasonable. This possibility is now more seriously considered.
Primary wave 2 unfolded as a shallow regular flat correction lasting 10 weeks.
Intermediate wave (A) may now be a complete five wave impulse.
There is still reasonable proportion between minor waves 2 and 4 within this wave count. There is alternation between the deep 0.96 combination of minor wave 2 and the shallow 0.46 zigzag of minor wave 4.
Intermediate wave (A) has now moved well below the lower edge of the maroon channel, which is copied over from the weekly chart. Intermediate wave (B) may bounce up to test resistance there.
Intermediate wave (B) may not move beyond the start of intermediate wave (A) above 2,940.91.
Primary wave 4 may not move into primary wave 1 price territory below 2,111.05.
HOURLY CHART
Click chart to enlarge.
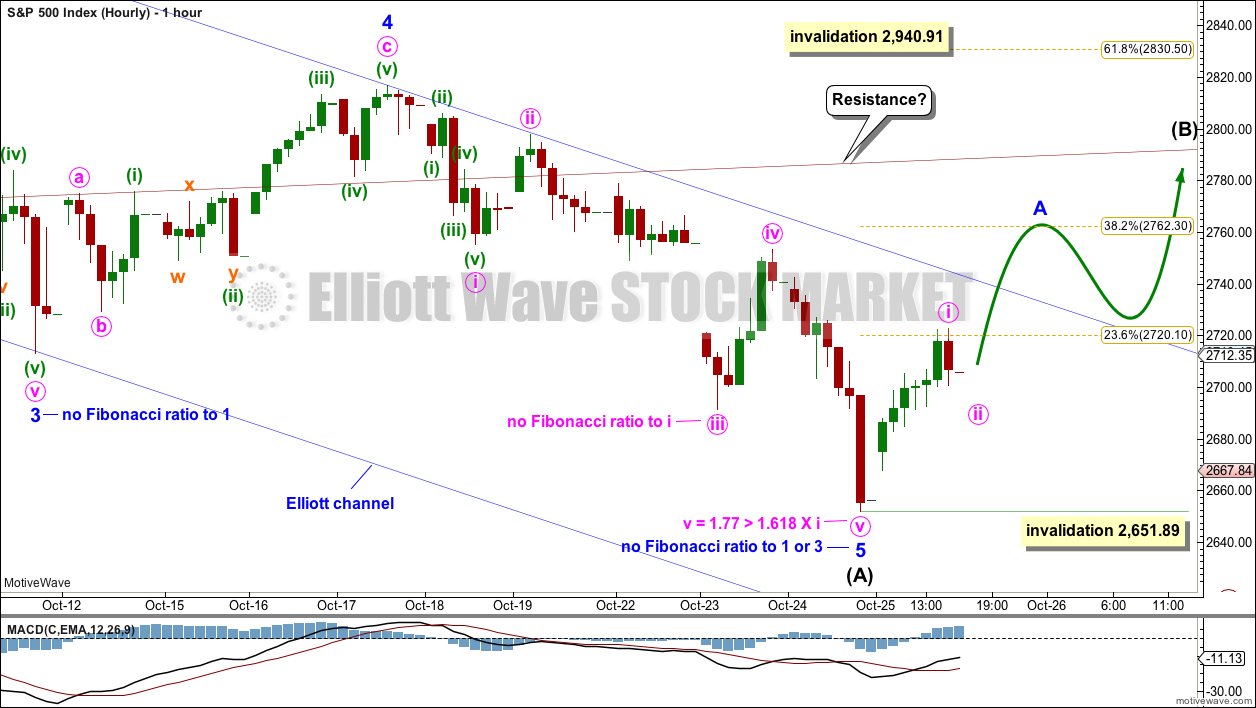
Intermediate wave (A) may be a complete five wave impulse. The blue channel is drawn using Elliott’s second technique: The first trend line is drawn from the ends of minor waves 2 to 4, then a parallel copy is placed upon the end of minor wave 3. Minor wave 5 may have ended mid way within the channel.
If intermediate wave (A) is now complete, then intermediate wave (B) should begin as a multi week bounce. It may find resistance about the lower edge of the maroon channel. If it moves back above the maroon trend line, then the next target for intermediate wave (B) would be the 0.618 Fibonacci ratio of intermediate wave (A) at 2,830.50.
If intermediate wave (A) has subdivided as a five, then primary wave 4 would be unfolding as a zigzag. This would offer best structural alternation with the flat correction of primary wave 2.
Intermediate wave (B) may not move beyond the start of intermediate wave (A) above 2,940.91.
Intermediate wave (B) may unfold as one of more than 23 possible corrective structures. B waves exhibit the greatest variety in structure and price behaviour. They can be very complicated time consuming sideways corrections, or equally as likely they can be quick sharp zigzags.
ALTERNATE DAILY CHART
Click chart to enlarge.
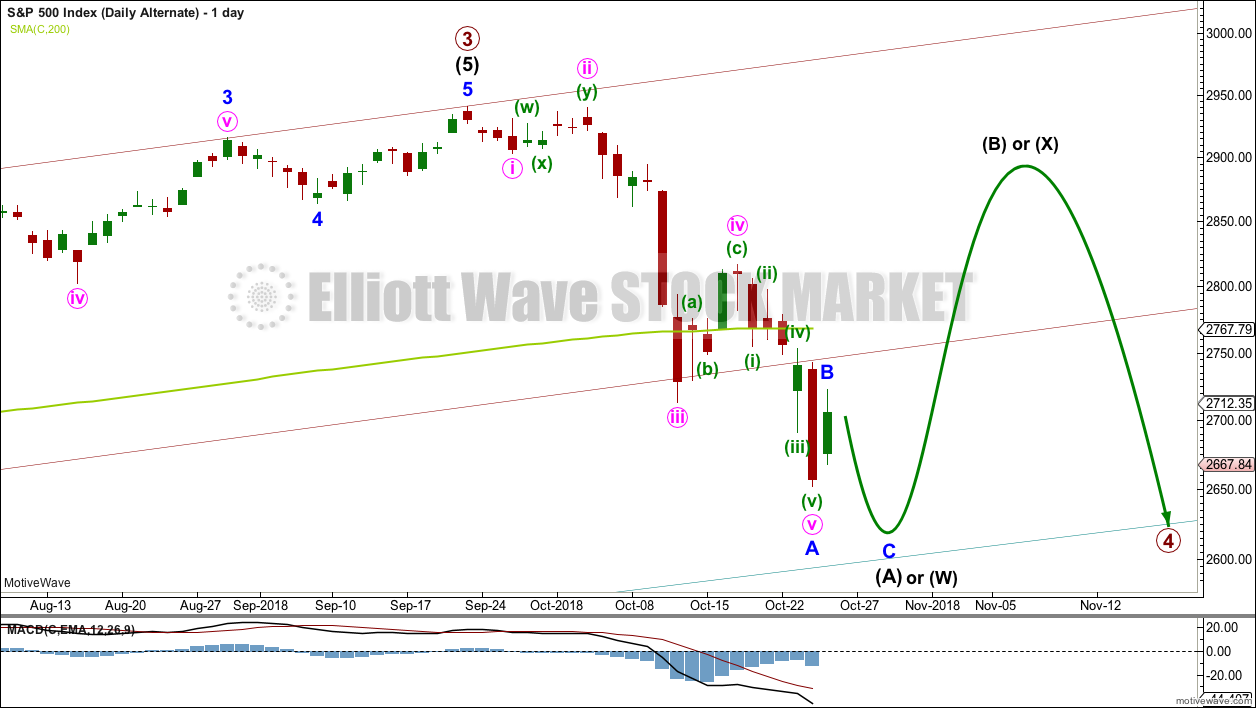
If the degree of labelling within the now complete five down is all moved down one degree, it is possible to see that intermediate wave (A) may be an incomplete zigzag.
Zigzags subdivide 5-3-5. The first five down may be minor wave A. The small upwards bounce today may be minor wave B. Minor wave C could take price strongly lower tomorrow.
If intermediate wave (A) subdivides as a zigzag, then primary wave 4 may unfold as a flat or triangle. A triangle would still offer reasonable structural alternation with the flat correction of primary wave 2.
If a zigzag unfolds lower for the first wave within primary wave 4, then it may be labelled intermediate wave (W) (the first zigzag in a double zigzag or double combination).
When the first wave within a correction subdivides as a three, the following wave for intermediate wave (B) or (X) would most likely be very deep and may make a new high. There can be no upper invalidation point for this reason.
ALTERNATE HOURLY CHART
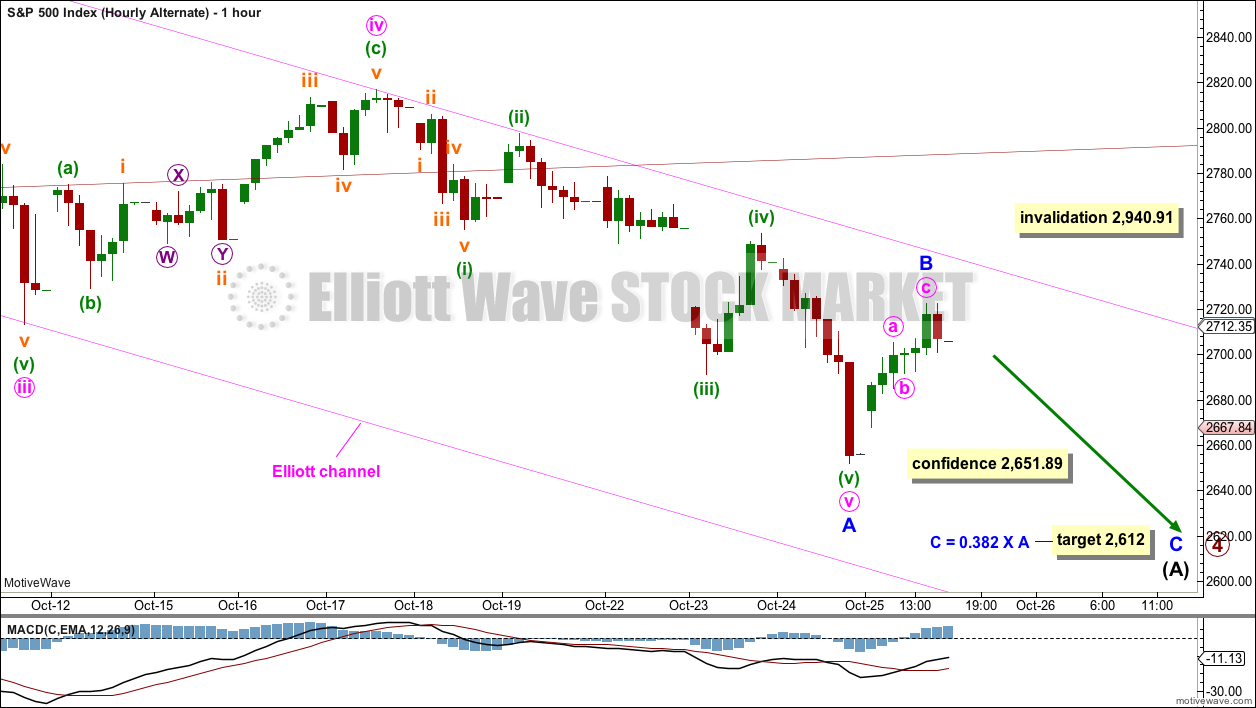
Click chart to enlarge.
The degree of labelling to the last low is all moved down one degree. This impulse may be only minor wave A within a zigzag for intermediate wave (A).
Minor wave B could be over as a quick sharp zigzag at today’s high, remaining within the pink Elliott channel. It may also continue sideways or higher.
If minor wave B is over at today’s high, a target is calculated for minor wave C; the target coincides with a strong area of support.
TECHNICAL ANALYSIS
WEEKLY CHART
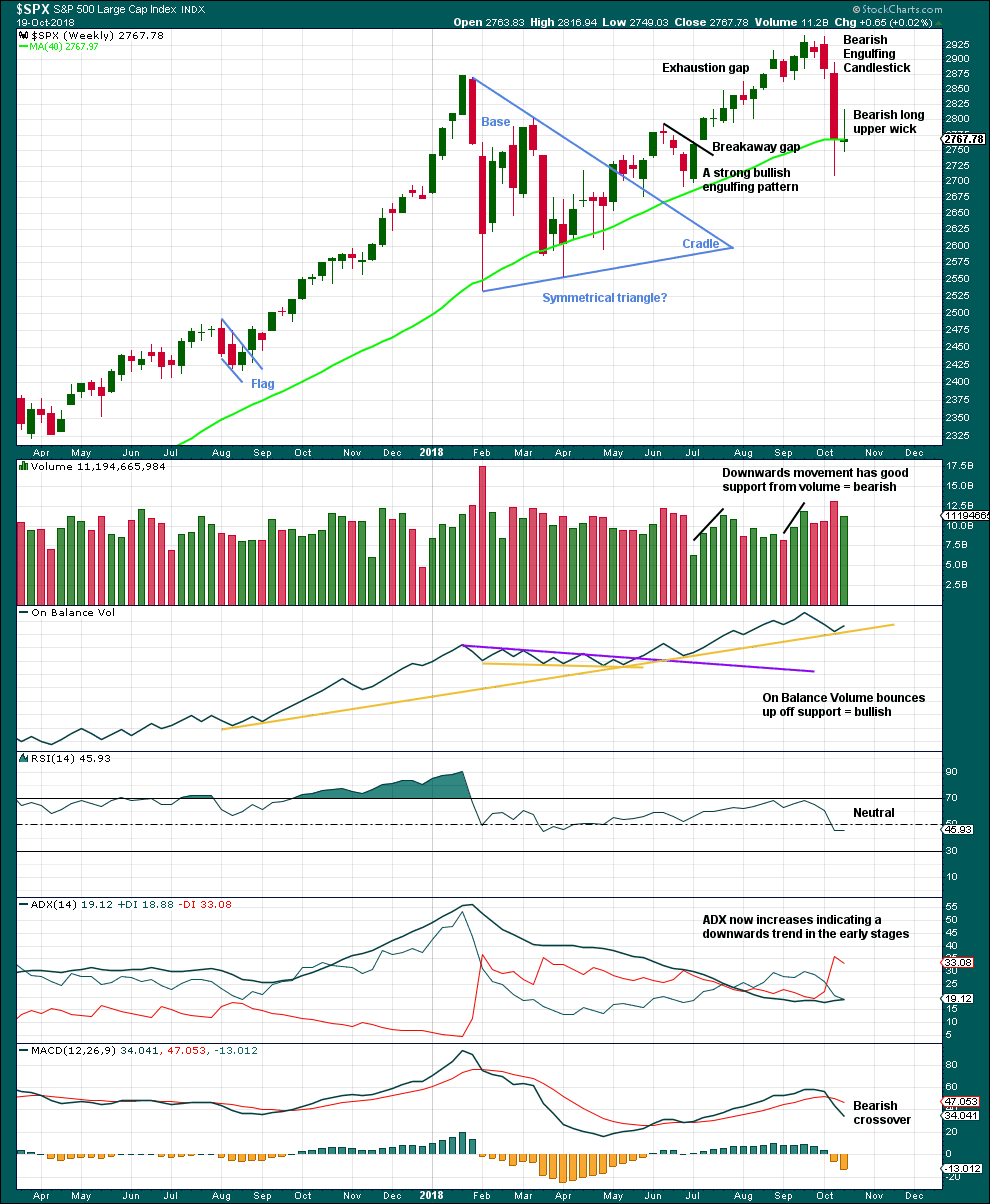
Click chart to enlarge. Chart courtesy of StockCharts.com.
The bearish long upper wick on the last weekly candlestick is contradicted by a bullish signal from On Balance Volume. Downwards movement here may be limited as On Balance Volume may find support with one more downwards week.
DAILY CHART
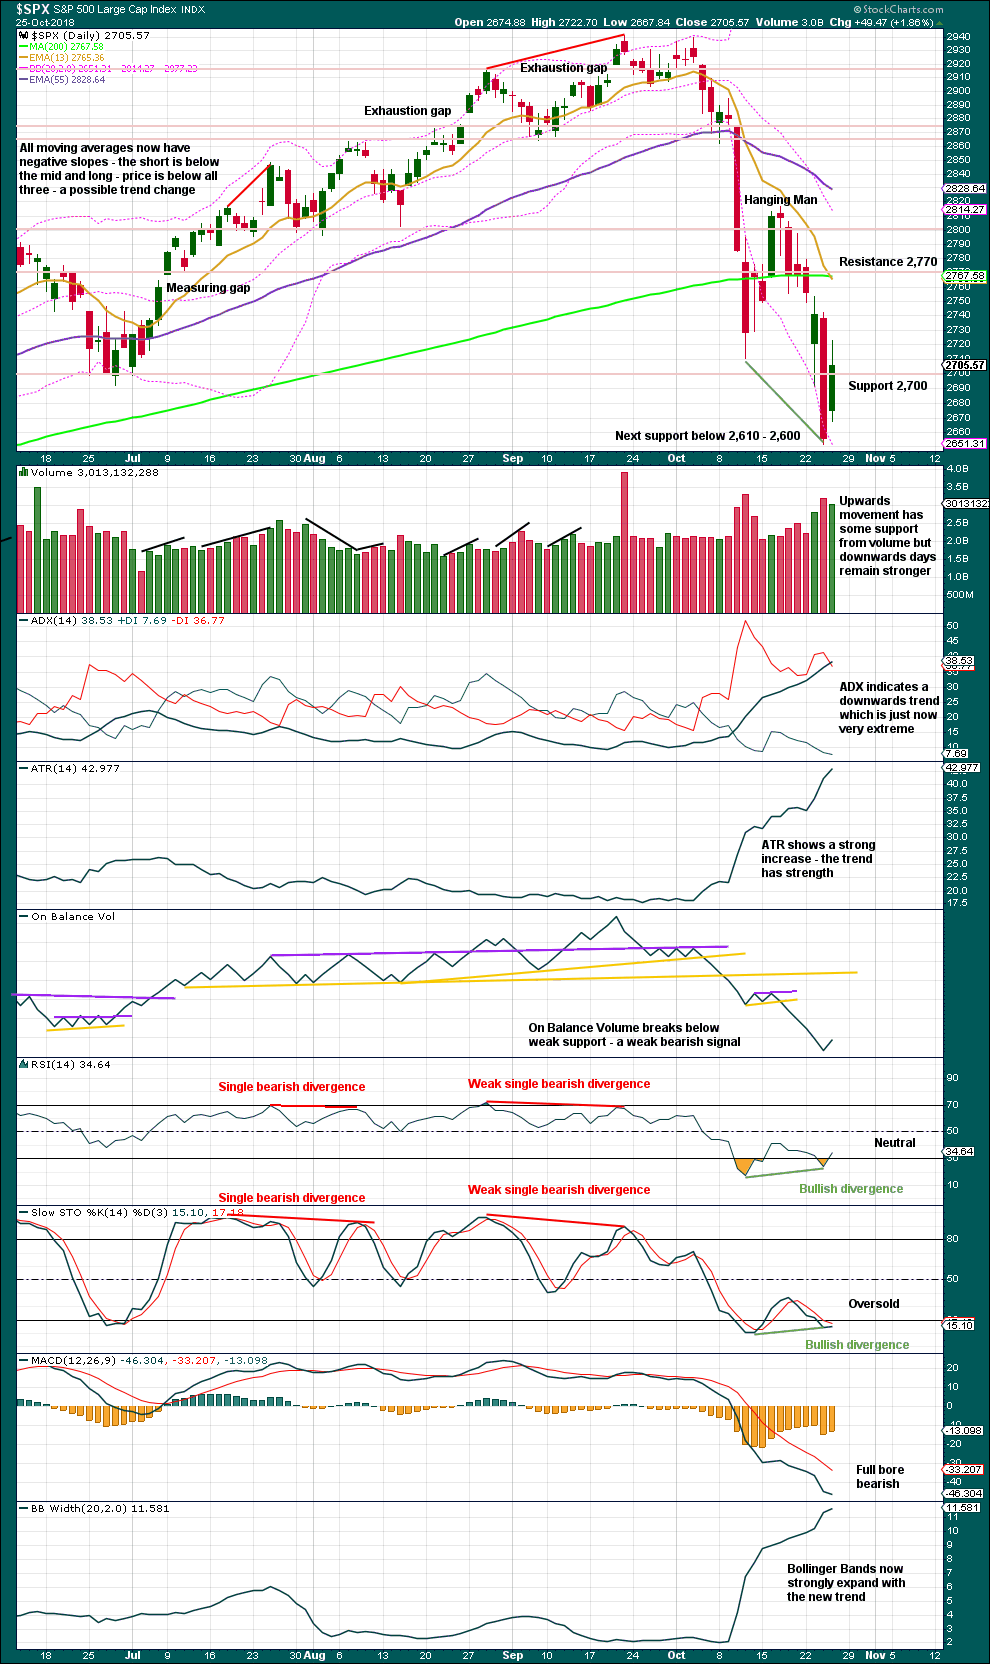
Click chart to enlarge. Chart courtesy of StockCharts.com.
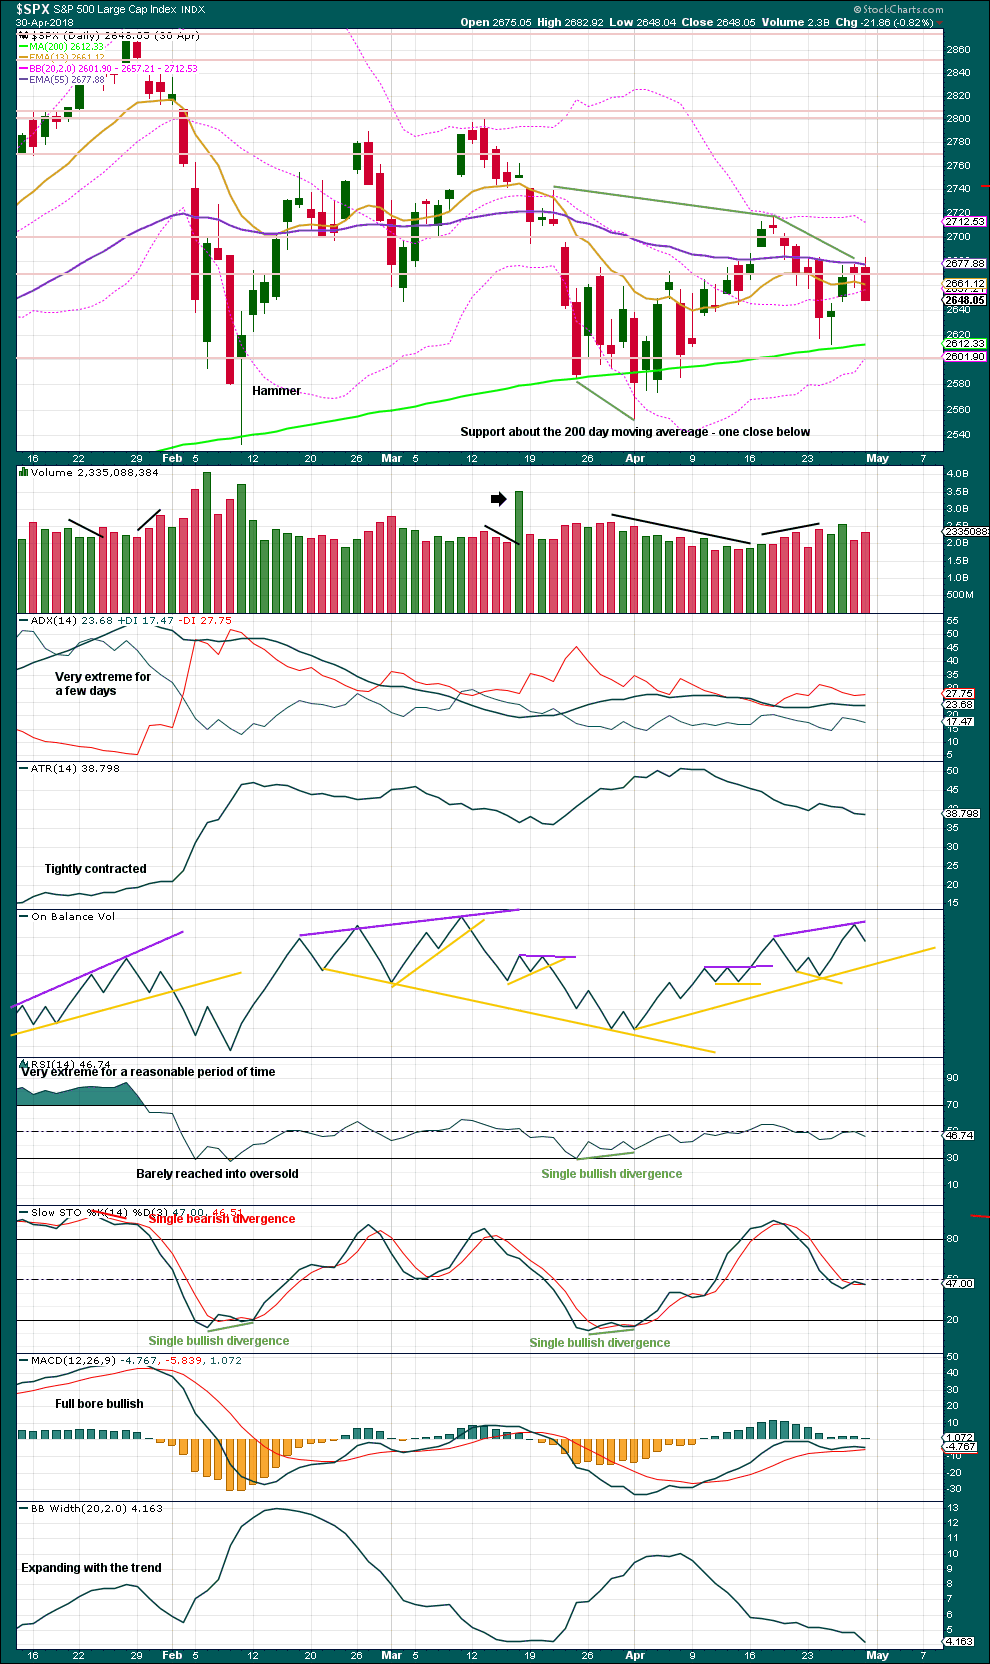
While volume today is reasonably strong, it is not as strong as the prior downwards day. The short term volume profile remains overall bearish.
There is still bullish divergence between price and RSI while RSI is oversold. This is often (not always) a good indicator of a low in place. This supports the main Elliott wave count.
ADX today reaches very extreme; the ADX line is now above both directional lines and above 35. When ADX reaches very extreme, then we should look out for reversal signals.
However, there is no long lower wick at the last low nor a candlestick reversal pattern. This does not mean that a low may not be in place; at this time, it just means that there is no reversal signal.
BREADTH – AD LINE
WEEKLY CHART
Click chart to enlarge. Chart courtesy of StockCharts.com.
When primary wave 3 comes to an end, it may be valuable to watch the AD line at the weekly time frame as well as the daily.
The AD line has made a slight new low below the prior swing low of the week beginning 25th June, but price has not. This mid term divergence is bearish, but it is weak.
Upwards movement within last week has support from a slight increase in the AD line. There is no new short term divergence.
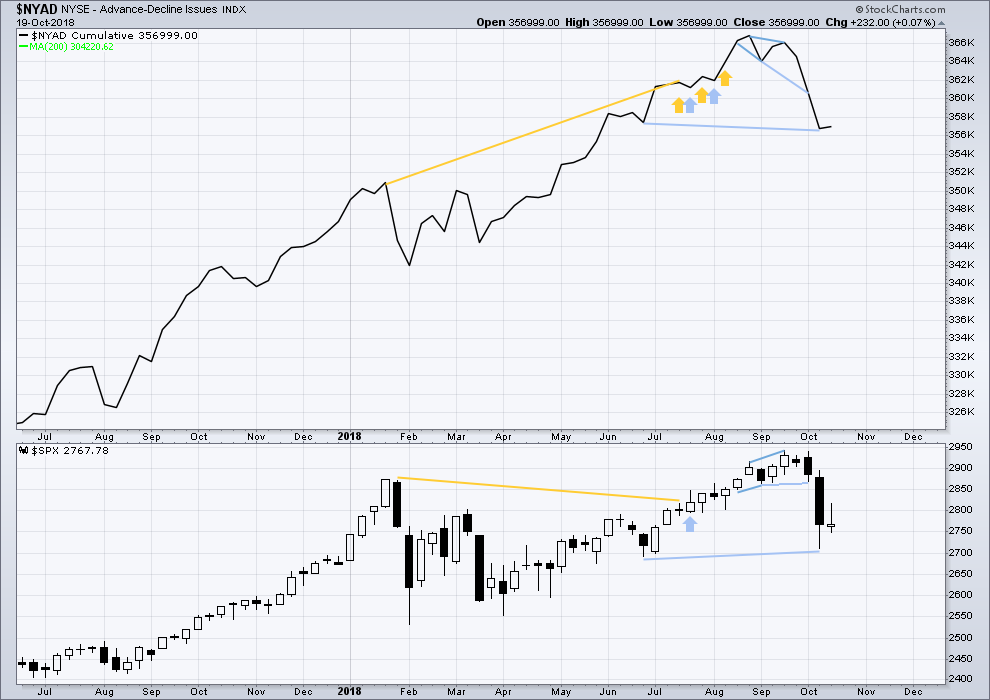
DAILY CHART
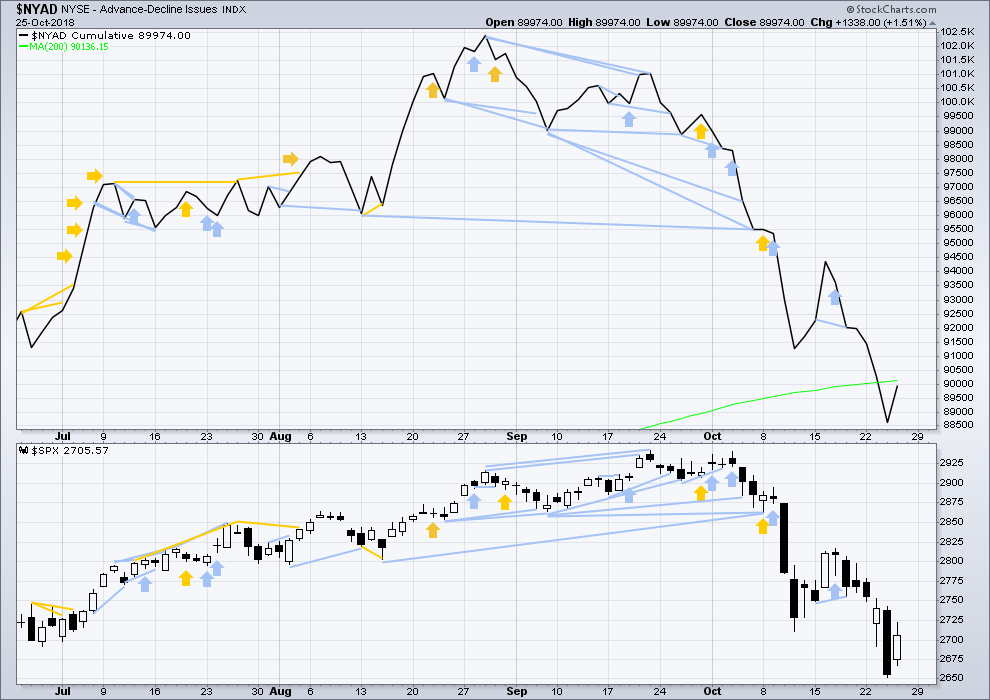
Click chart to enlarge. Chart courtesy of StockCharts.com.
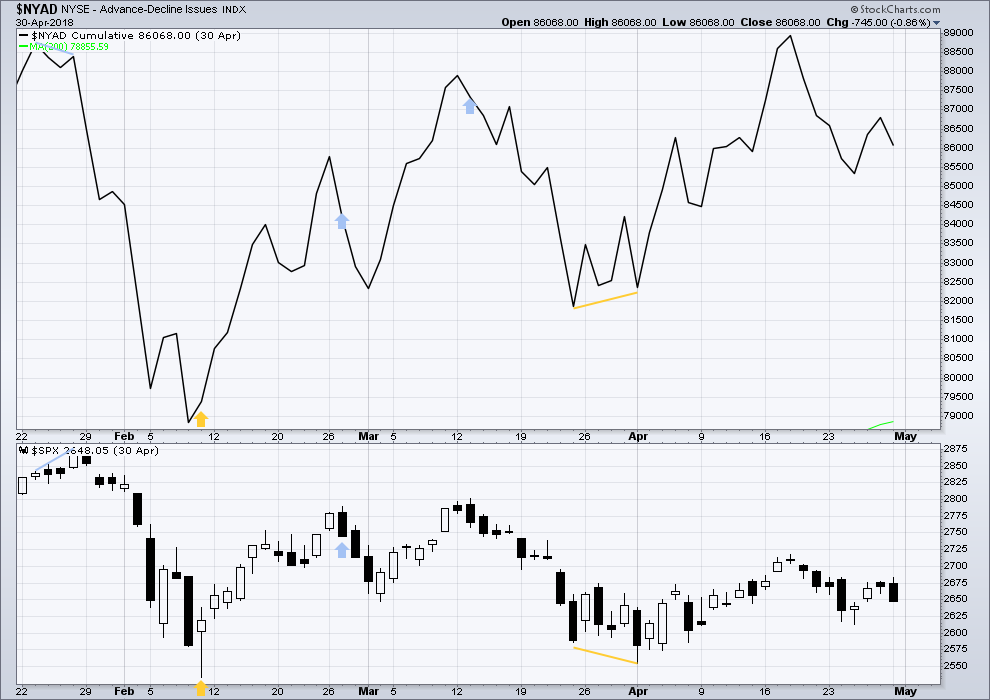
There is normally 4-6 months divergence between price and market breadth prior to a full fledged bear market. This has been so for all major bear markets within the last 90 odd years. With no longer term divergence yet at this point, any decline in price should be expected to be a pullback within an ongoing bull market and not necessarily the start of a bear market. New all time highs from the AD line on the 29th of August means that the beginning of any bear market may be at the end of December 2018, but it may of course be a lot longer than that. My next expectation for the end of this bull market may now be October 2019.
Breadth should be read as a leading indicator.
The AD line has made a new low below the prior low of the 15th of October, but price has not. This divergence is short term and bearish; it is reasonable, but it is not very strong. This supports the first two Elliott wave counts.
Downwards movement has support from falling market breadth. There is no bullish divergence between price and the AD line to signal a low in place. That does not mean a low may not be in place; at this time, it just means there is no signal indicated by the AD line.
VOLATILITY – INVERTED VIX CHART
WEEKLY CHART
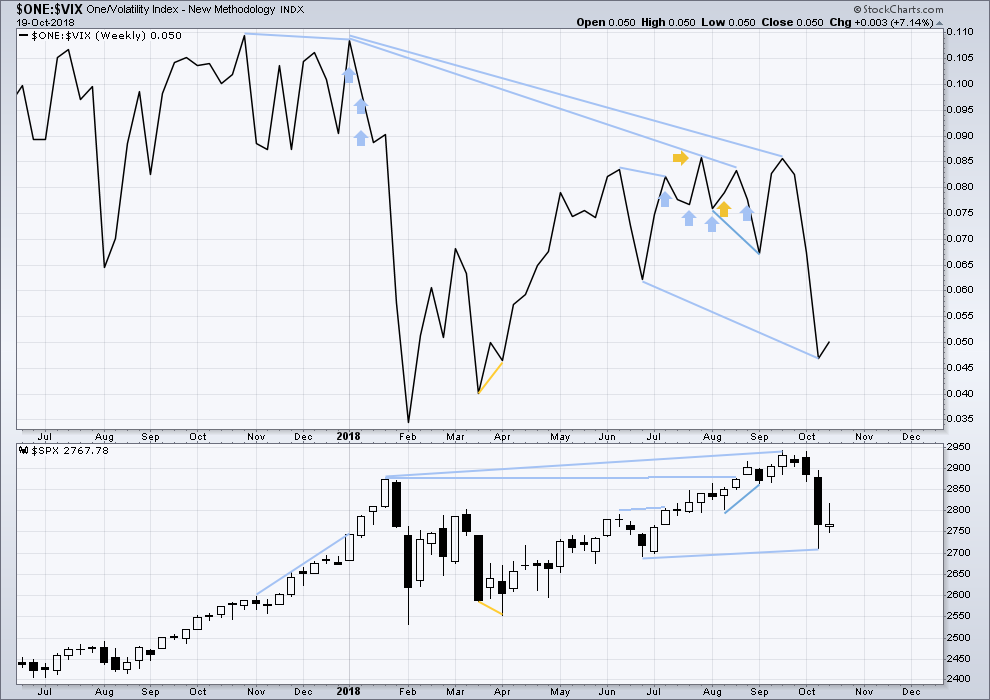
Click chart to enlarge. Chart courtesy of StockCharts.com. So that colour blind members are included, bearish signals
will be noted with blue and bullish signals with yellow.
Primary wave 4 has now arrived and is showing reasonable strength. There is continuing mid term bearish divergence with inverted VIX making a new low below the prior swing low of the week beginning 25th June, but price has not yet made a corresponding new low.
As primary wave 4 continues this weekly chart may offer a bullish signal at its end.
Last week completed an inside week with the balance of volume upwards and a green weekly candlestick. A small upwards movement from inverted VIX offers no new short term divergence.
DAILY CHART
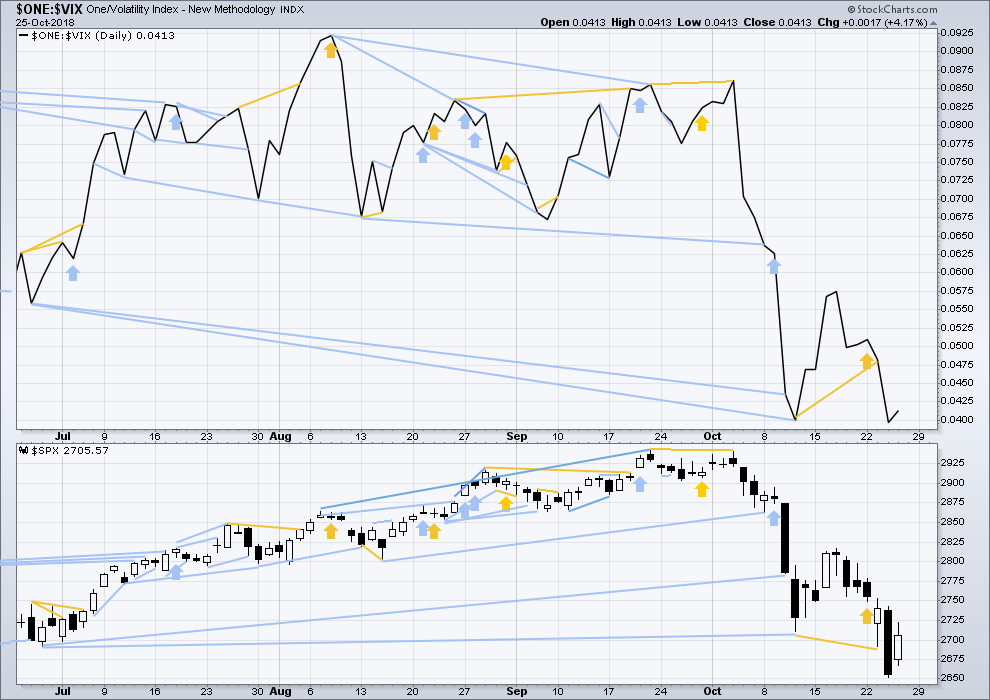
Click chart to enlarge. Chart courtesy of StockCharts.com. So that colour blind members are included, bearish signals
will be noted with blue and bullish signals with yellow.
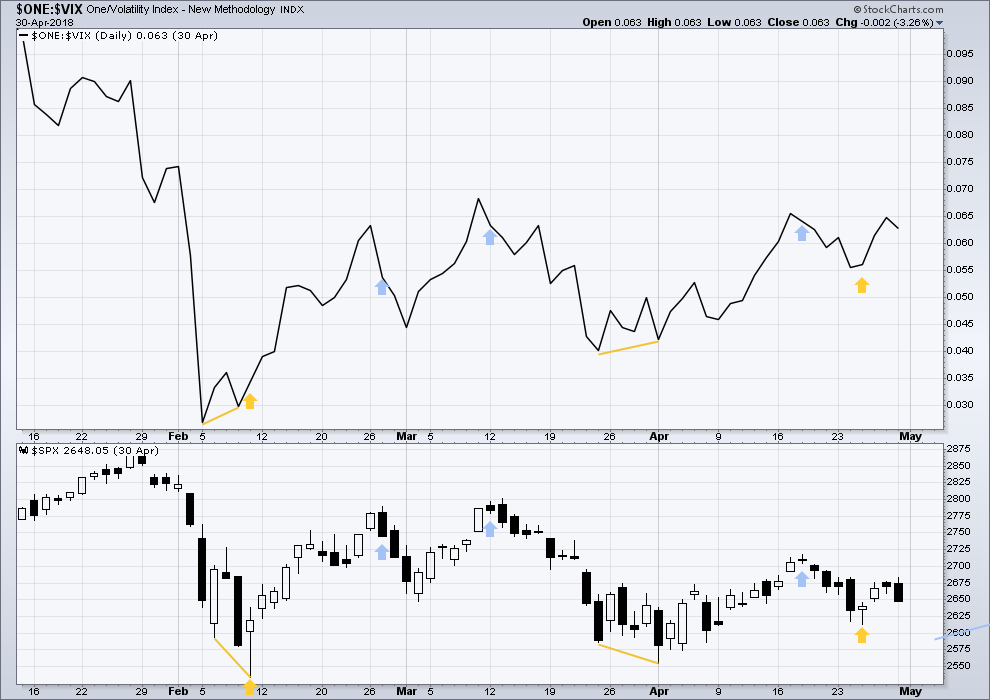
Normally, volatility should decline as price moves higher and increase as price moves lower. This means that normally inverted VIX should move in the same direction as price.
There is no bullish divergence between price and inverted VIX at the last two swing lows.
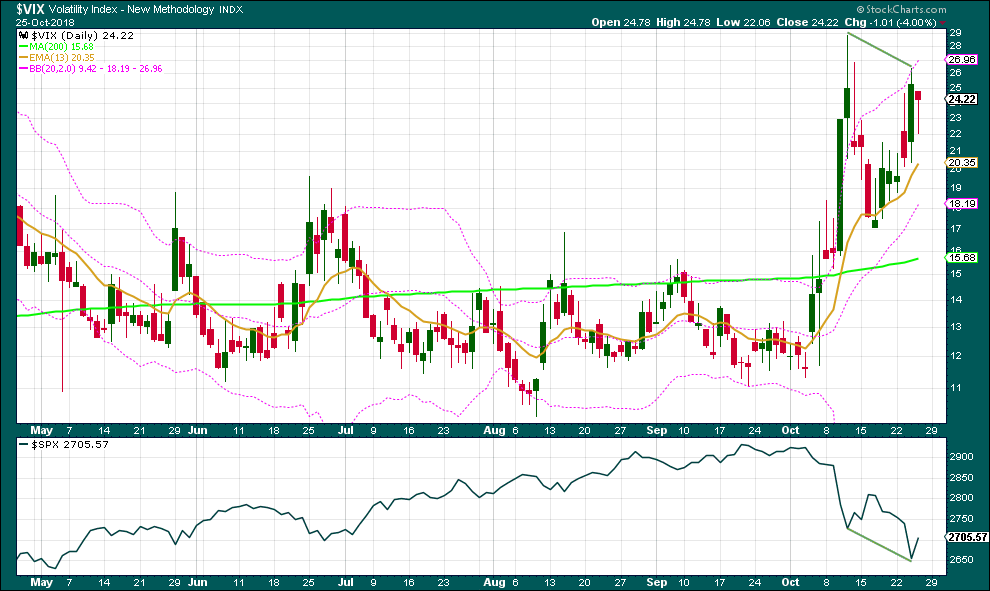
Click chart to enlarge. Chart courtesy of StockCharts.com.
However, there is bullish divergence on a VIX candlesticks chart: VIX made a slightly lower high yesterday, but price made a lower low. This offers slight support to the main Elliott wave count.
DOW THEORY
The following lows need to be exceeded for Dow Theory to confirm the end of the bull market and a change to a bear market:
DJIA: 23,344.52.
DJT: 9,806.79.
S&P500: 2,532.69.
Nasdaq: 6,630.67.
ANALYSIS OF INTERMEDIATE WAVE (4)
TECHNICAL ANALYSIS
Click chart to enlarge. Chart courtesy of StockCharts.com.
Intermediate wave (4) was a large symmetrical triangle. The deepest wave was the first wave. At its low there was a clear candlestick reversal pattern and bullish divergence between price and Stochastics.
RSI barely managed to reach into oversold.
The current correction for primary wave 4 may behave differently, but there should be some similarities.
It is expected that primary wave 4 may be stronger than intermediate wave (4).
VIX
Click chart to enlarge. Chart courtesy of StockCharts.com.
This is a daily chart.
At the two major lows within intermediate wave (4), inverted VIX exhibited single short term bullish divergence.
At highs within intermediate wave (4), inverted VIX exhibited one single day bullish divergence with price.
AD LINE
Click chart to enlarge. Chart courtesy of StockCharts.com.
This is a daily chart.
At the two major lows within intermediate wave (4), there was bullish divergence between price and the AD line. At the two major highs within intermediate wave (4), there was each one instance of single day bearish divergence.
Published @ 08:40 p.m. EST.
—
Careful risk management protects your trading account(s).
Follow my two Golden Rules:
1. Always trade with stops.
2. Risk only 1-5% of equity on any one trade.
My favorite comment on the day,
Only the (intelligently) paranoid survive.
And the big winner today is…
TSLA!!! Up 3.8%.
Hilarious. Smell the smoke? That’s the money they are burning…just today! And tomorrow and tomorrow and tomorrow…
Next wave count. Daily chart:
It’s possible that a zigzag may now be complete. This was presented as the alternate in this analysis above. Now it’s labelled a main count, but I am going to be neutral and not assign probability until the session is closed and we can see volume data.
If a zigzag is complete then it may be intermediate (A). There is no Fibonacci ratio between minor waves A and C, and minor wave C is rather short. This is acceptable, but not the most common look for a zigzag.
Hourly chart:
If the zigzag is complete then price should have found a low.
One more flush might do it.
For this idea I could also move the degree of labelling within minor C down one; the low today may be only minute i within an impulse to continue lower for minor C.
Verne,
This is quite comical based on your thoughts from yesterday.
WS is definitely trying to make you think twice, maybe three times over the weekend.
Gotta love those banksters! 🙂
SPX did not fill the gap. The inverse head & shoulder pattern is busted. Bears are wrestling back control. If it doesn’t hold here, I will be stopped out and looking for that Guiness. Well, maybe not with the change in meds today! See, the new rule might be important, no trades on the day of change of meds. ha ha.
I note that too, the gap remains open. That’s bearish at least for the short term.
LOL your comment about meds makes me laugh. And makes me think of my smart a** teenager I have….
The other morning I’m standing at my coffee machine still sleepy, I comment to him “I feel like I’m missing something this morning….”
And quick as he answers:
“your meds?”
And then makes a very quick exit from the kitchen upon risk of harm from a decaffeinated mum….
New alternate wave count:
This may become the main count after data for this session is finalised.
Daily chart.
A double zigzag unfolding lower may be nearing completion. Look for support about 2,600
This count has better proportions than the next one I’ll post above.
Hourly chart.
So far the target is simply an area of support. I need a little more time to play with Fibonacci ratios to determine a possible Elliott wave target.
Today’s downwards movement looks strong. I’d expect it to continue towards new lows and only halt when it finds support.
Minuette (ii) may not move beyond the start of minuette wave (i) above 2,722.56. This is the price point now which shall differentiate the two wave counts, a new high above this point now will strongly indicate the low is in.
Also, while price remains within the channel there is no trend channel confirmation of a trend change. We need to see a breach out of this channel to see an indication that the low is in.
I do NOT find the NDX chart comforting re: a low of some type is in. The NDX low at 6748 is in no-man’s land. And while possible…the probability of that is no where near as high as a turn on top of/near a major fibo level. The trusty 78.6% is below, as is a 1.27% extension. Don’t be surprised if NDX goes down to one of these to finally bottom early next week.
Can someone explain to me the whether divergence between price and VIX is bullish or bearish? I see Lara most often refer to it as bullish, i.e. volatility failing to break the previous high while price makes a new low. But then I see comments here from Verne and others saying that the low should bring a “capitulation” spike in VIX that breaks the previous high.
I note that the action in early February saw SPX hit lows in price while volatility failed to break the previous high.
If price goes to new highs but the VIX fails to make new lows…that bearish.
If price goes to new lows but the VIX fails to make new highs…that bullish.
Generally speaking, conceptually, your mileage may vary, and…always keep in mind what VIX really is. Merely a measure of the price of SPX options with expiry about a month out, both puts and calls. I find it more value myself not a market timing tool, but as a means of getting maximal leverage out of my trades by choosing the right type of “option weapon”. When VIX high and likely to move back down…I want to be a seller of options to get the advantage of falling option prices. And vice versa.
What Kevin said.
The underlying concept is this:
Normally when markets rise, they do so with declining volatility.
Normally when markets fall, they do so with increasing volatility.
VIX is used as a measure of volatility for the S&P500.
So normally when the S&P500 goes up, VIX goes down.
Normally when the S&P500 goes down, VIX goes up.
So far, so good and reasonably simple. I hope.
And so if the S&P500 makes new lows, it should do so alongside VIX making new highs. Because while price for S&P goes down, VIX should go up.
Which means that if the S&P makes new lows and VIX does not make a corresponding new high, that the fall in price for the S&P has not come with a normal corresponding increase in VIX. There is weakness in volatility, which is bullish.
Does that make sense?
Of course, the reverse is supposed to be true for a bull market.
VIX divergence CAN be bullish under normal circumstances. One could reasonably assume that the failure of VIX to notch a new high as the market puts in a new low
would signal bullish divergence.
We however, are in anything BUT “normal” circumstances.
Any one who has been following volatility in fact is keenly aware that there have in fact been some extremely abnormal things going on in that sphere.
We may have had something of a paradigm shift.
The steady rise in VIX does not seem to me to be based on true market fear.
Despite the substantial fall we have so far seen in the markets, complacency reigns. There has certainly been no capitulation spike that so typically accompanies a selling climax.
Why then does VIX continue to rise, displaying a series of bullish flags on the way up?
I think there might just be two things going on.
First, it could be the stealth unwind of the massive short vol trade endemic in these STILL bloated markets.
Second, I think an accumulation of long vol positions by “smart money” has been underway for some time now.
You can see why if this is true, the implications are quite ominous. It implies that the the real fear induced move in VIX is still ahead! Stay Frosty!
If we have a LD for a first wave down, this could be the B wave of the fifth wave ZZ, and C down ahead. Just a thought…
SPX 5 minute chart shows an inverse head and shoulders. Projection is to 2700+. That would be very close to filling this morning’s gap and creating a bullish long lower wick hammer candlestick. There is lots of time left. Just something to watch. This market is still very volatile and the immediate trend is downwards.
A quick chart
From a “B wave started yes or no?” perspective, my key two indicators will be breaking the sharpest down trend line on the hourly, followed by the downtrend line on the daily. An in doing so, breaking the prior hourly swing high (from Thursday). At that point I think it will be on…however, it’s a B wave! It’s likely to be a choppy ugly mess. Also, I won’t at all be surprised if said breakage doesn’t happen right away, but instead there’s backing and filling below those trend lines but above the lows today.
Ah, B wave. Hence the half position approach for me today. It is like changing the direction of a ship. You can see it but it takes time to confirm it.
BTW, if we close green for the day, it would be another small piece of evidence of the low being in.
Here’s a funny thought: I should make a rule of never making a trade on the day of a medication change! But truly, the doc upped my meds as suspected and I am starting to feel a bit better.
Again, European close very suspect.
IMHO, capitulation comes Monday.
245 low on SPY and 254 close.
Good luck!
If this is a double zz, then I guess it could climb to 2750ish.
NFLX has moved from 420 to 300. I’m selling puts about 3 weeks out at 270…It’s just NOT going that low!! If it is…okay I’ll take it and sell if later at 300!!
Thankfully I took short term profits just before the peak and drop…think I’ll wait to see what Monday brings before considering selling NFLX puts again!
2621.7 is a 78.6 (of the A wave down of the Jan/Feb intermediate 4) and a high potential turn price zone.
if that falls, 2600, which put this entire sell off from the high at exactly the length of the intermediate 4 A wave down as well as a critical roundie.
This first BIG move down of this Primary 4 is now showing true PRIMARY muscle! A few days ago…it just seemed a little too wimpy still.
Close enough to the big 78.6% for gov’t work, and for me.
Geez, could today end up as the Oops day of Oops days? A close in the body of yesterday’s daily bar? That would be an INSANE reversal…
When I mentioned SPX 2600 a few days / weeks back, I suspect most thought I was going insane. But here we are.
The McClellan Oscillator is an end of day piece of data. But at this point we again have a positive divergence with the Oct. 11th low and the low two days ago at 2651.89. If it holds, next week could be see a strong up move that has some staying power. Look for a run of the shorts!
I have taken my first long position in my short term account. 50% long.
Guinness all around on me everybody!
We closed one of our most spectacular trading weeks ever!!!
Best of luck and every success to all on the forum!!
Awesome! I’m going to substitute Anchor Steam (I support my local SF breweries). I’ll send you my bill…
Haha, yes indeed gents. Went flat about 30minutes ago, Happy Friday!!!
I am far from a VIX expert or even amateur. But it looks to me like VIX is not confirming this new low as it is below its high of 10/11 at 28.84.
You are correct…and it is ominous…!!!! 🙂
Does that mean you’re looking for a bottom here Verne?
It might happen on Monday instead. I could be wrong, but it does not look like any sort of capitulation selling as those are usually unmistakable…
The confidence point for the Alternate count is 2651.89 or the previous low for this correction. We did not quite get there., yet. Basically, we gapped down to it and the bulls are making a stand. I do not think it will hold.
The support fibo’s below. 2621.7 at 78.6 stands out to me, if this cluster price is now now fails.
Busted! The Alternate count is a go so far. Looking for lows from 2635 down to 2600. This could be the time to get long.
Anyone for catching a falling knife that has a razor’s edge?
Lots of interesting set ups. AMZN bouncing off a major 61.8% at 1618.
Here is another interesting statistic that has come my way. Two days ago, the SPX had closed down six days in a row. Every time that has happened in the last ten years, a lower low occurred 80% of the time.
The bulls had better hope we get a VIX capitulation wick today.
If we do not, it’s going to be a very bloody Monday!
Have a great week-end everyone ( you too Joeseph). 🙂
If talking to me… Still looking for the final washout before Lara’s next long-term move up to ~ 3600ish!
But, I am looking for it intra-day and NOT overnight! Only the Banksters play in the overnight in size.
BTW: I have no problem with you Vern… never did. It’s okay to disagree at times, most of the time we are on the same page. Most of the time however you all are way too short-term for me.
Have a great weekend to all.
RUT monthly. Look out below. Looks like multi-month (or more) bear market start to me. Dashed lines are symmetric projections of prior 2 largest corrections on chart.
The fact that it is the largest candle stick on the chart is significant. It may be that as SPX makes a new ATH, RUT will not.
Exactly Rodney. Also, we need to be objective about Lara’s 3600 zone target. That if the final P5 reaches “nominal” size. We all know fifth wave can be shorties though, even in rare cases, truncated. And in this market, something looking like the Mother of All Double Tops to end the GCS would be just about perfect in my book. Long ways away but just thinking ahead. I wouldn’t be surprised to see 3000 or so in Oct 2019…and then the start of the biggest bear market in history. 3600…just doesn’t seem consistent to me with that RUT monthly, but hey, who knows.
I am beginning to look for signs and counts that THE top may be in. I know that is not in line with Lara’s count at all. But I want to have some preparation in case we have seen the end of this bull run for a few years. If 2600-2500 does not hold, we could be looking at 2100. Yikes! I just don’t like posting about it much here giving people the wrong impression. But I have to admit, the last three weeks while not totally surprising have seen a significant move down. The one thing I am still looking for before THE top is a public buying mania. We have not seen a blow off top.
Gotta think about ALL the alternatives, I’m with ya.
Only the (intelligently) paranoid survive.
🙂 🙂 🙂
I think we get an interim low tomorrow…we close short leg of bear call credit spreads and ride the bounce higher…we hope! 🙂