Downwards movement was again expected for the new week, which is what has happened.
Three Elliott wave counts remain valid. The first two have a higher probability.
Summary: For the short term, next week may see more downwards movement to a new low. The target is at 2,698, which is just below support about 2,700; if that gives way, then about 2,677.
After this next wave down, a multi week bounce may develop.
A primary degree correction should last several weeks and should show up on the weekly and monthly charts. Primary wave 4 may total a Fibonacci 8, 13 or 21 weeks. Look for very strong support about the lower edge of the teal trend channel on the monthly chart.
Primary wave 4 should be expected to exhibit reasonable strength. This is the last multi week to multi month consolidation in this ageing bull market, and it may now begin to take on some characteristics of the bear market waiting in the wings.
The final target for this bull market to end remains at 3,616, which may be met in October 2019.
New updates to this analysis are in bold.
The biggest picture, Grand Super Cycle analysis, is here.
Last published monthly chart is here, video is here.
ELLIOTT WAVE COUNT
WEEKLY CHART
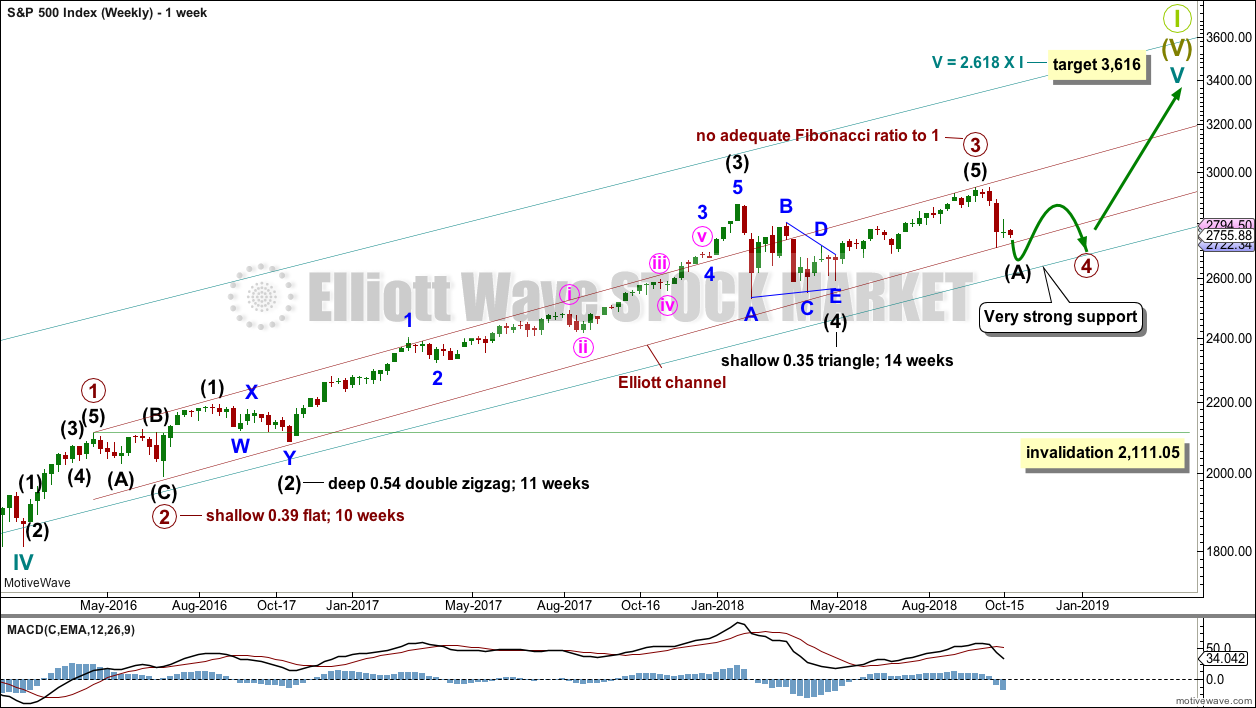
Cycle wave V must complete as a five structure, which should look clear at the weekly chart level and also now at the monthly chart level. It may only be an impulse or ending diagonal. It is clear it is an impulse.
Within cycle wave V, the third waves at all degrees may only subdivide as impulses.
Within primary wave 3, there is perfect alternation and excellent proportion between intermediate waves (2) and (4).
The channel is now drawn about primary degree waves. The first trend line is drawn from the ends of primary waves 1 to 3, then a parallel copy is placed upon the low of primary wave 2. Primary wave 4 may find support about the lower edge of this maroon channel. At the end of the first downwards wave within primary wave 4, that is exactly where price bounced up. The overshoot of the upper edge of this channel by the end of intermediate wave (3) looks typical. For the S&P, its third waves are usually the strongest portion of an impulse; they often exhibit enough strength to overshoot channels.
Fourth waves do not always end within channels drawn using this technique. If primary wave 4 breaks out of the narrow maroon channel, then it may find very strong support about the lower edge of the teal channel. This channel is copied over from the monthly chart and contains the entire bull market since its beginning in March 2009. While Super Cycle wave (V) is incomplete, this channel should not be breached.
Primary wave 4 may not move into primary wave 1 price territory below 2,111.05.
When primary wave 4 may be complete, then the final target may be also calculated at primary degree. At that stage, the final target may widen to a small zone, or it may change.
At this stage, the expectation is for the final target to be met in October 2019. If price gets up to this target and either the structure is incomplete or price keeps rising through it, then a new higher target would be calculated.
DAILY CHART
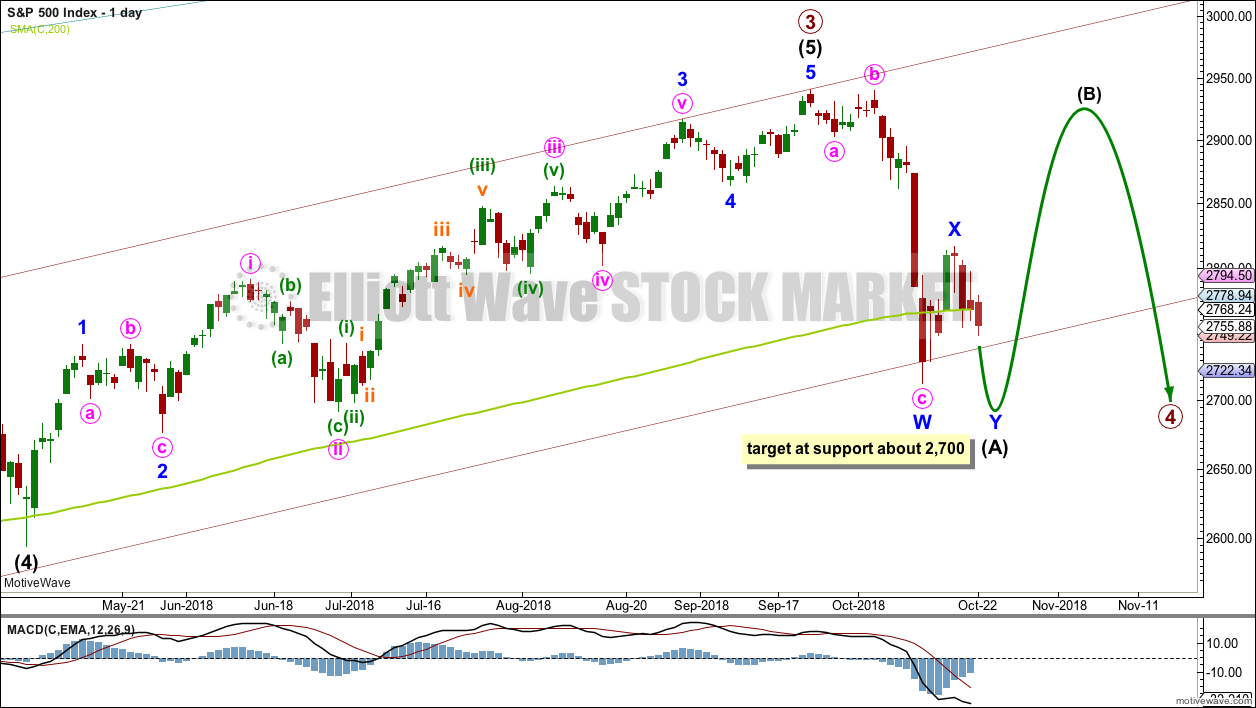
Primary wave 4 would most likely end somewhere within the price territory of the fourth wave of one lesser degree. Intermediate wave (4) has its price territory from 2,872.87 to 2,532.69. Within this range sit the 0.236 Fibonacci ratio at 2,717 and the 0.382 Fibonacci ratio at 2,578.
The 0.382 Fibonacci ratio would expect an overshoot of the teal channel. This may be too low; price may find support at the lower edge of the channel. However, as primary wave 4 should be expected to exhibit reasonable strength, it may be able to overshoot the channel and that would look reasonable.
Primary wave 2 unfolded as a shallow regular flat correction lasting 10 weeks.
Primary wave 4 may have begun with a zigzag downwards. This is labelled as the first zigzag in a possible double zigzag downwards for intermediate wave (A).
If intermediate wave (A) unfolds as a double zigzag, then primary wave 4 may be unfolding as either a flat or a triangle. A double zigzag may not be labelled as intermediate wave (W) because the maximum number of corrective structures is three, and to label multiples within multiples increases the maximum beyond three and violates an Elliott wave rule.
If primary wave 4 is unfolding as a flat correction, then intermediate wave (A) may be a double zigzag. Primary wave B may then bounce higher to retrace a minimum 0.9 length of primary wave A, and may make a new high above the start of primary wave A as in an expanded flat correction.
If primary wave 4 is unfolding as a triangle, then intermediate wave (A) may be a double zigzag. Primary wave B would have no minimum required length, and would most commonly be about 0.8 to 0.85 the length of primary wave A.
Primary wave 4 may not move into primary wave 1 price territory below 2,111.05.
HOURLY CHART
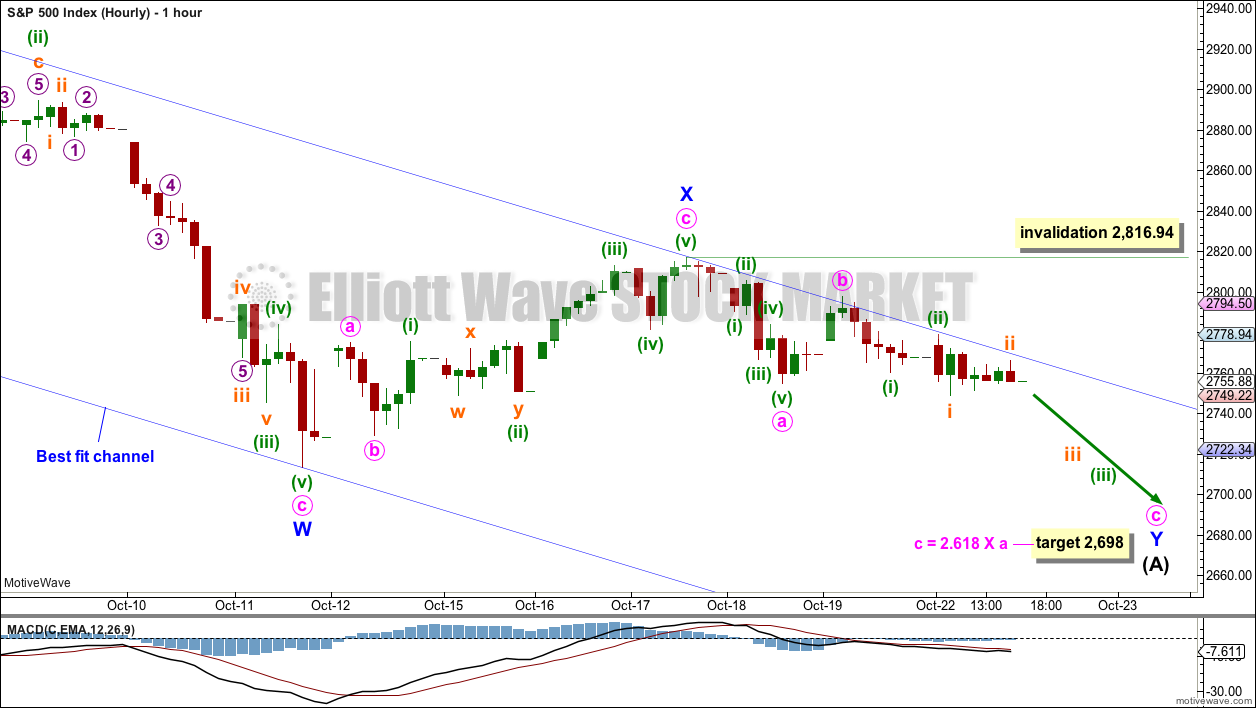
Intermediate wave (A) may be an incomplete double zigzag. The fist zigzag in the double may be complete, labelled minor wave W. The double may now be joined by a completed three in the opposite direction, a zigzag labelled minor wave X.
Double zigzags should have a strong slope against the prior trend, downwards in this case, and to achieve a strong slope their X waves are normally brief and shallow. The second zigzag in a double has the purpose of deepening the correction when the first zigzag does not move price deep enough. A target is calculated for minor wave Y to end using a common Fibonacci ratio between minute waves a and c. This target is very close to support about 2,700.
Within minor wave Y, minute waves a and b may now be complete. Within minute wave c, there may now be two overlapping first and second waves complete. This wave count now expects to see an increase in downwards momentum in the next very few days, possibly tomorrow.
Within minor wave Y, if it continues any further, then minute wave b may not move beyond the start of minute wave a at 2,816.94.
ALTERNATE DAILY CHART
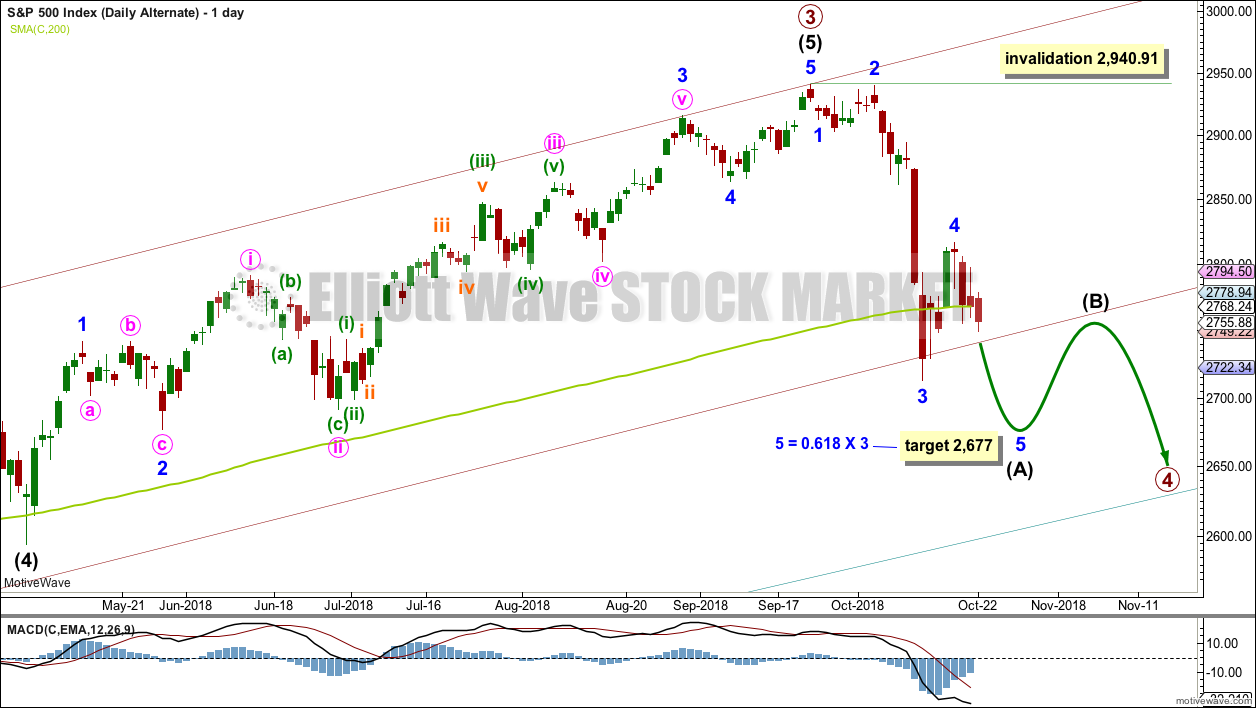
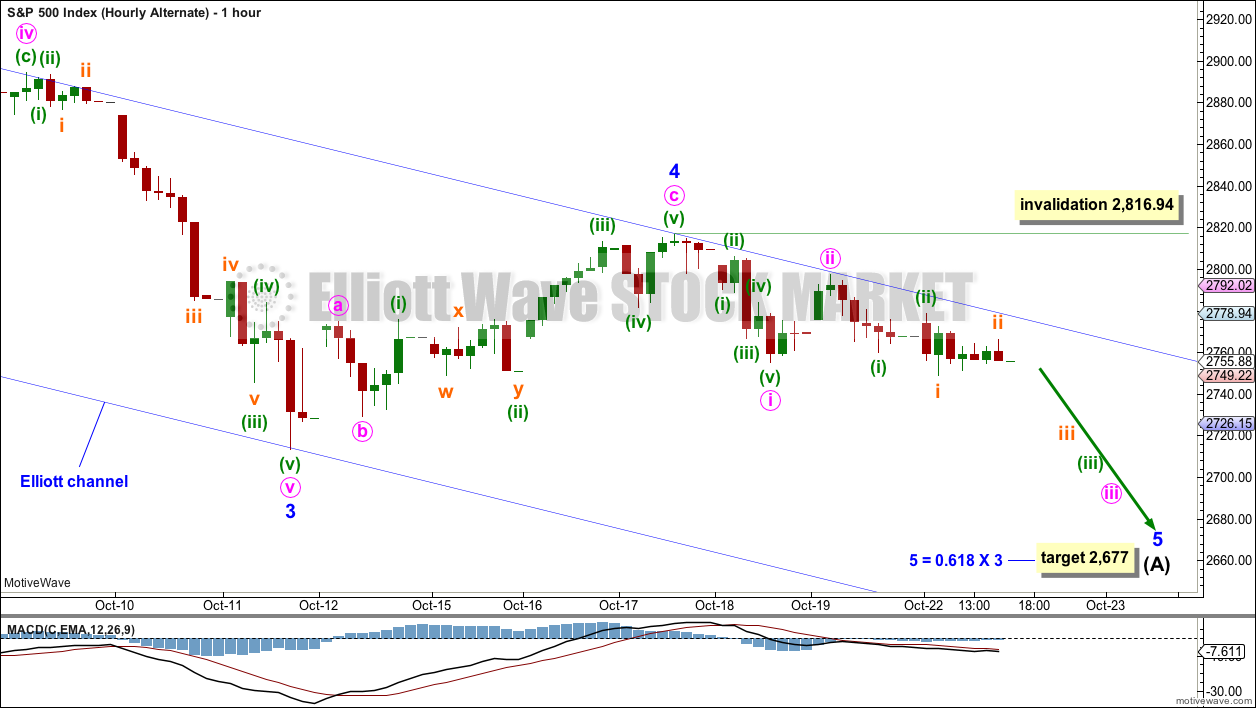
It is also possible to see intermediate wave (A) as an incomplete five wave structure.
There is now reasonably good proportion between minor waves 2 and 4 within this wave count. Additionally, there is alternation between the deep 0.96 combination of minor wave 2 and the shallow 0.46 zigzag of minor wave 4.
There is no adequate Fibonacci ratio between minor waves 3 and 1. This makes it more likely that minor wave 5 may exhibit a Fibonacci ratio to either of minor waves 3 or 1. Because minor wave 1 was very short, a Fibonacci ratio to minor wave 3 here looks slightly more likely.
If intermediate wave (A) ends with closing below the lower edge of the maroon channel, which is copied over from the weekly chart, then intermediate wave (B) may bounce up to test resistance there.
Intermediate wave (B) may not move beyond the start of intermediate wave (A) above 2,940.91.
ALTERNATE HOURLY CHART
The channel is redrawn about this possible impulse downwards using Elliott’s second technique. Draw the first trend line from the ends of minor waves 2 to 4, then place a parallel copy on the end of minor wave 3.
Minor wave 5 may end either midway within the channel or about the lower edge if the target is inadequate.
Within minor wave 5, minute wave ii may not move beyond the start of minute wave i above 2,816.94.
SECOND ALTERNATE DAILY CHART
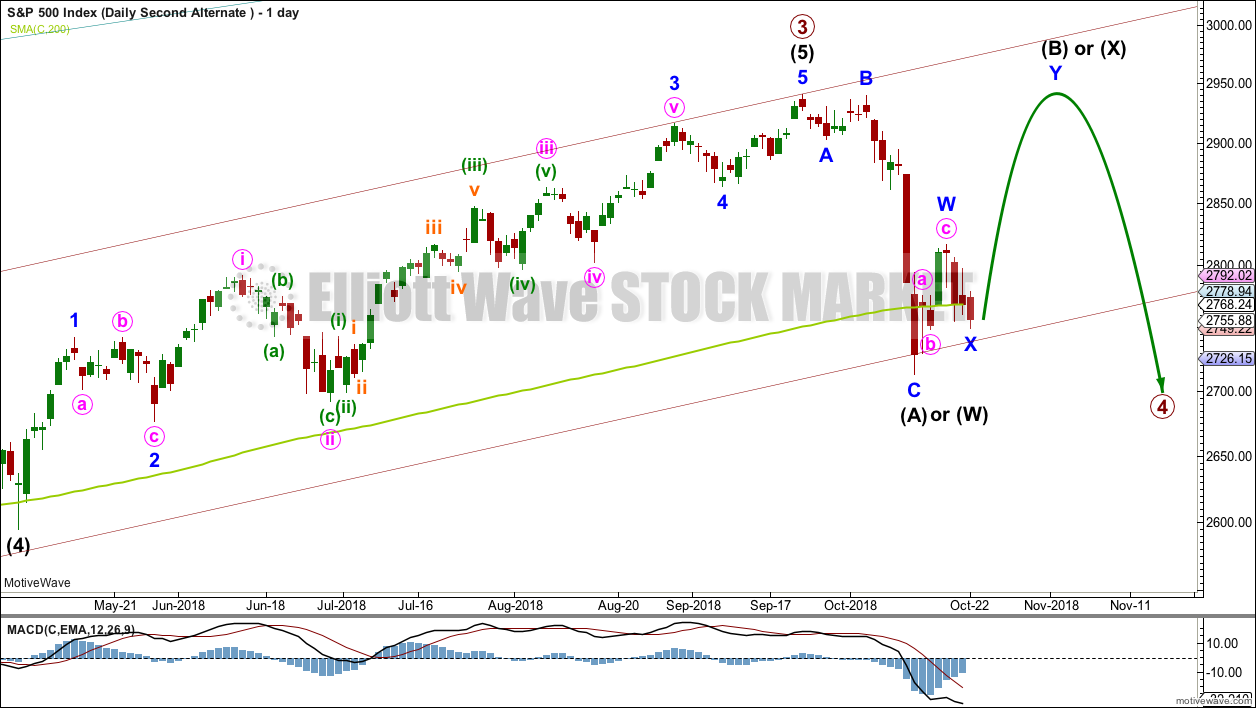
It is also possible to still see intermediate wave (A) as a complete zigzag. The bounce may continue for intermediate wave (B).
If intermediate wave (A) is a zigzag, then primary wave 4 may be unfolding as a flat or triangle.
The zigzag may also be labelled intermediate wave (W), because primary wave 4 may be unfolding as a double combination with the first structure a zigzag and the second structure most likely a flat.
While waves W, Y and Z within combinations must only subdivide as single corrective structures, X waves may subdivide as any corrective structure including multiples (although this is uncommon). X waves are not counted in the maximum number of allowable corrective structures which is three.
SECOND ALTERNATE HOURLY CHART
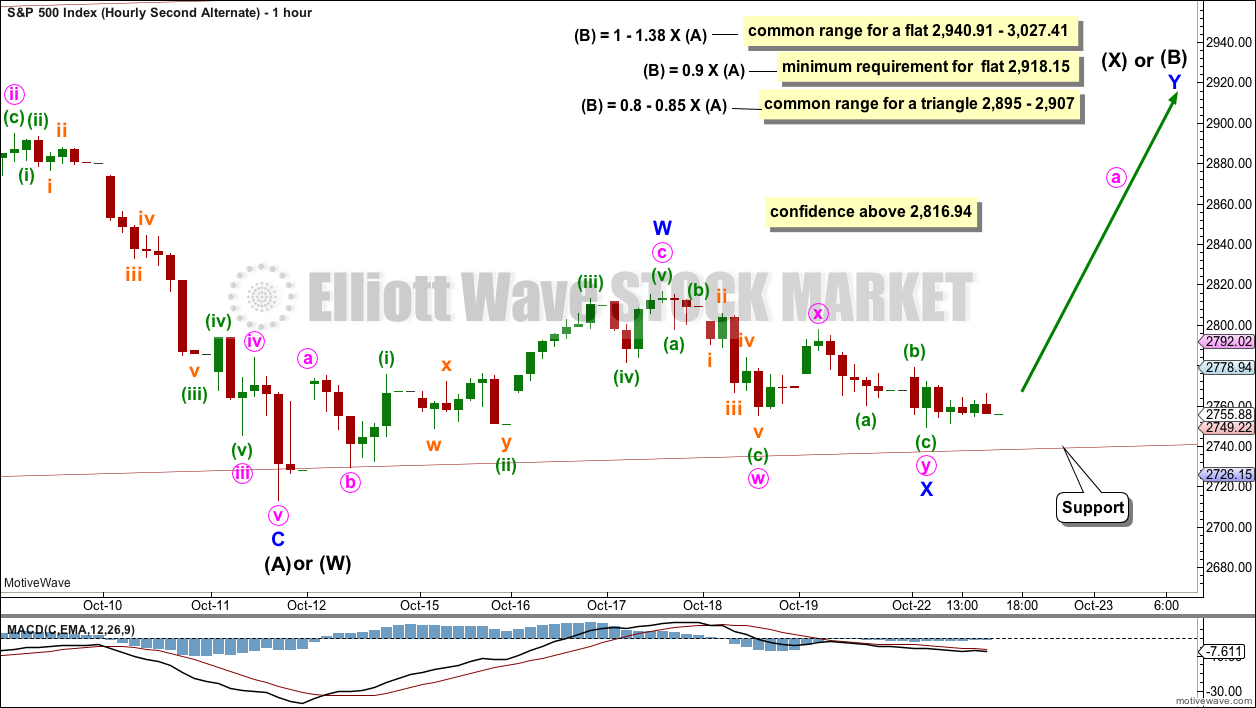
If intermediate wave (A) or (W) is a complete zigzag, then intermediate wave (B) or (X) would be expected to be a very high bounce.
The minimum requirement for intermediate wave (B) within a flat correction is for it to retrace 0.9 of intermediate wave (A).
There is no minimum requirement for the length of intermediate wave (B) within a triangle.
There is no minimum requirement nor maximum limit of intermediate wave (X) within a double combination.
This alternate wave count expects that intermediate wave (A) or (W) found support at the lower edge of the maroon channel. If primary wave 4 continues as a triangle, then support at that line may hold.
A new high above 2,816.94 by any amount at any time frame would add some confidence to this alternate wave count. At that stage, a continuation of a deep bounce would be most likely.
Minor wave X is today relabelled as a possible double zigzag, which may find support about the maroon trend line. While X waves may be any corrective structure, including a multiple, this is uncommon and further reduces the probability of this wave count today.
TECHNICAL ANALYSIS
WEEKLY CHART
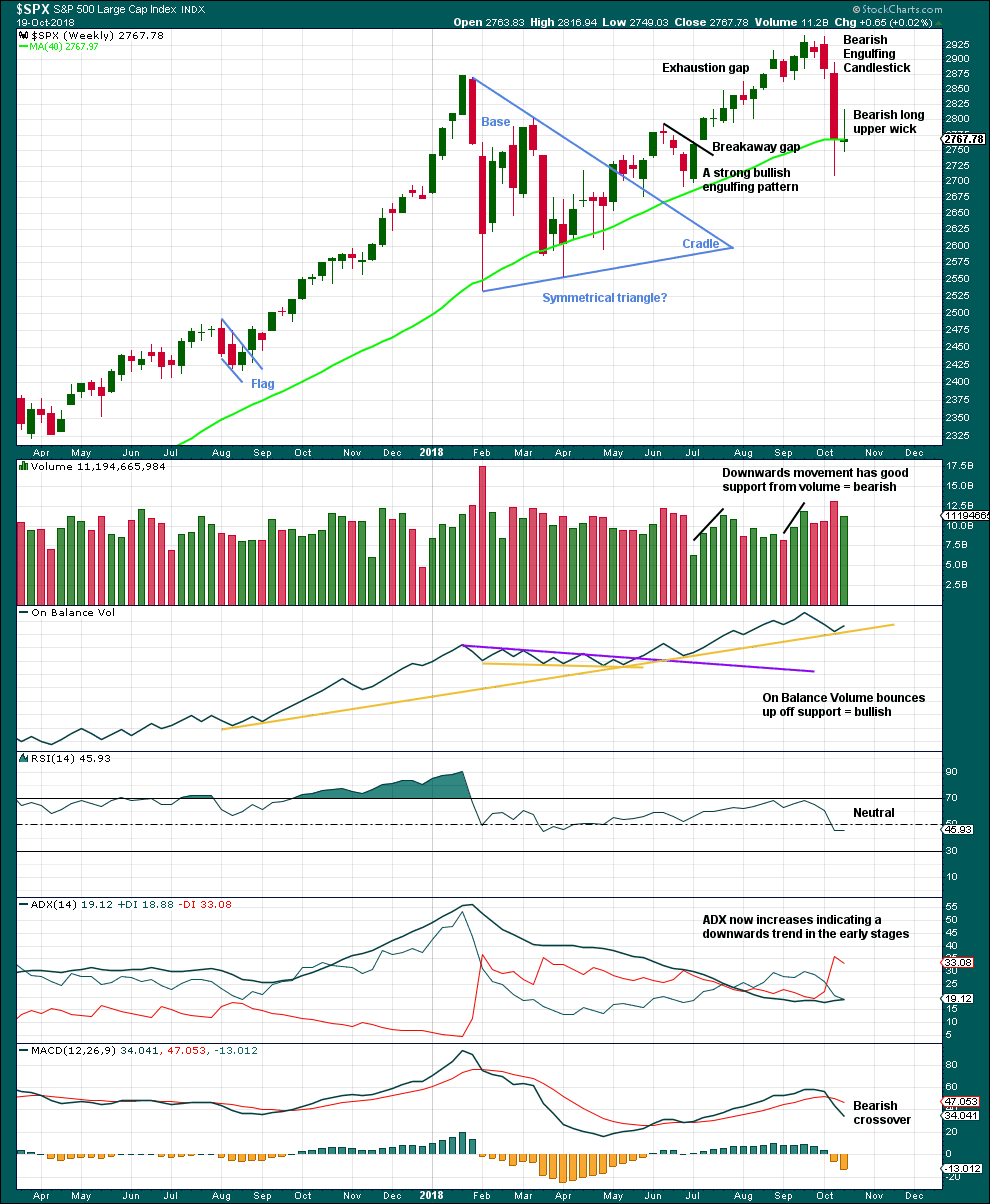
Click chart to enlarge. Chart courtesy of StockCharts.com.
The bearish long upper wick on the last weekly candlestick is contradicted by a bullish signal from On Balance Volume. Downwards movement here may be limited as On Balance Volume may find support with one more downwards week.
DAILY CHART

Click chart to enlarge. Chart courtesy of StockCharts.com.
On Balance Volume is now very bearish. A new low below 2,710.51 looks increasingly likely here.
Look out for support below, at about 2,700.
BREADTH – AD LINE
WEEKLY CHART
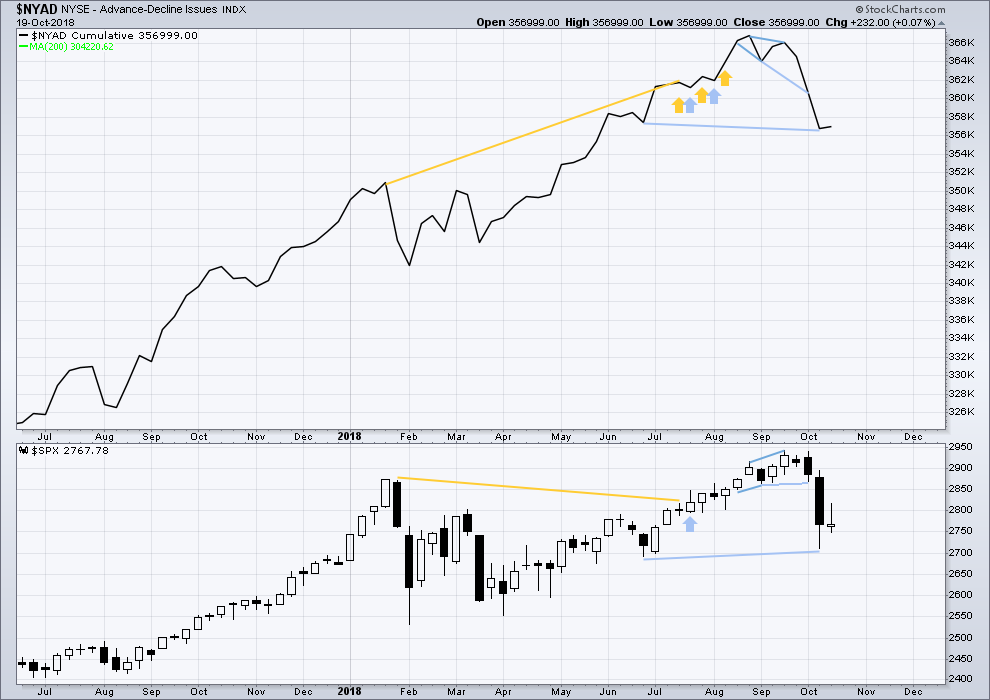
Click chart to enlarge. Chart courtesy of StockCharts.com.
When primary wave 3 comes to an end, it may be valuable to watch the AD line at the weekly time frame as well as the daily.
The AD line has made a slight new low below the prior swing low of the week beginning 25th June, but price has not. This mid term divergence is bearish, but it is weak.
Upwards movement within last week has support from a slight increase in the AD line. There is no new short term divergence.
DAILY CHART
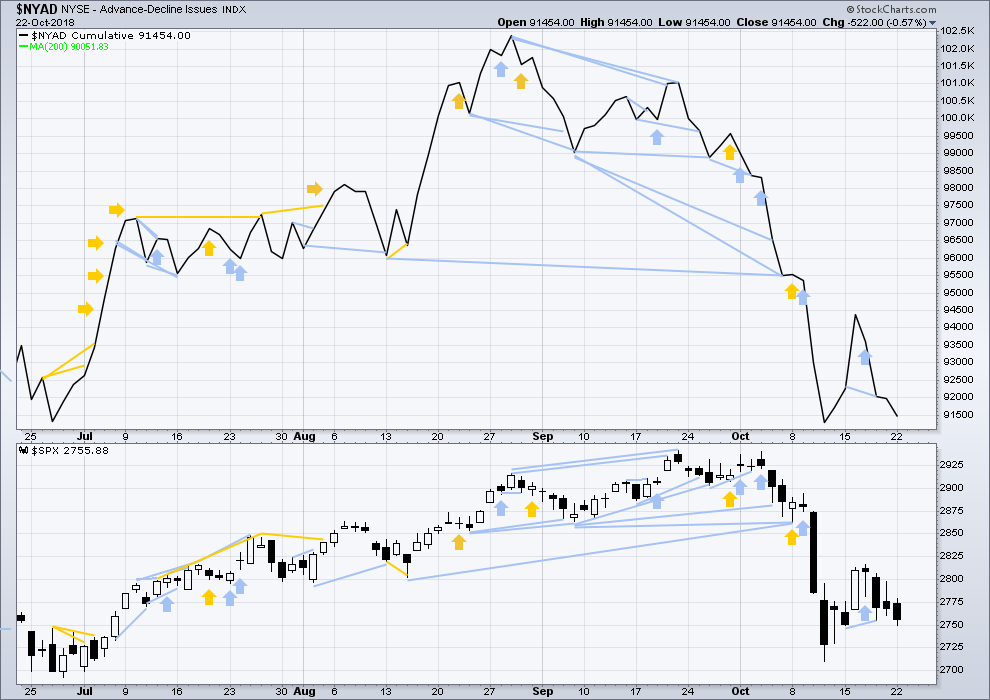
Click chart to enlarge. Chart courtesy of StockCharts.com.
There is normally 4-6 months divergence between price and market breadth prior to a full fledged bear market. This has been so for all major bear markets within the last 90 odd years. With no longer term divergence yet at this point, any decline in price should be expected to be a pullback within an ongoing bull market and not necessarily the start of a bear market. New all time highs from the AD line on the 29th of August means that the beginning of any bear market may be at the end of December 2018, but it may of course be a lot longer than that. My next expectation for the end of this bull market may now be October 2019.
Breadth should be read as a leading indicator.
The AD line has made a new low below the prior low of the 15th of October, but price has not. This divergence is short term and bearish; it is reasonable, but it is not very strong. This supports the first two Elliott wave counts.
Downwards movement during Monday’s session has support from a decline in market breadth. This is bearish.
Both of mid and small caps continue to move lower today. Downwards movement has some support from market breadth. This looks bearish for the short term, and a new low below the last small swing low looks most likely here.
VOLATILITY – INVERTED VIX CHART
WEEKLY CHART
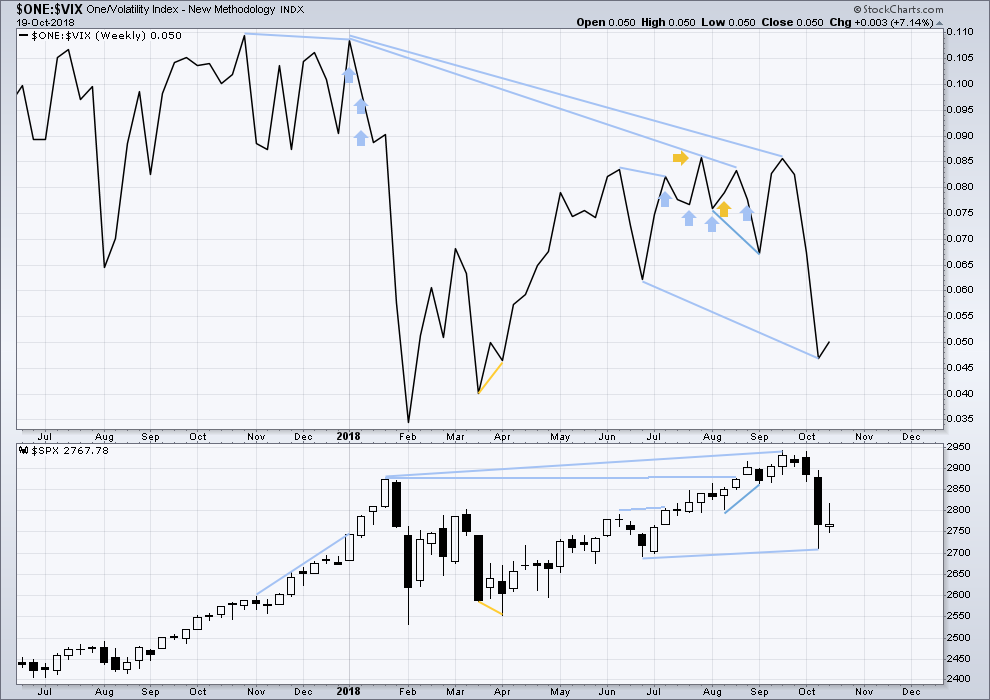
Click chart to enlarge. Chart courtesy of StockCharts.com. So that colour blind members are included, bearish signals
will be noted with blue and bullish signals with yellow.
Primary wave 4 has now arrived and is showing reasonable strength. There is continuing mid term bearish divergence with inverted VIX making a new low below the prior swing low of the week beginning 25th June, but price has not yet made a corresponding new low.
As primary wave 4 continues this weekly chart may offer a bullish signal at its end.
Last week completed an inside week with the balance of volume upwards and a green weekly candlestick. A small upwards movement from inverted VIX offers no new short term divergence.
DAILY CHART
Click chart to enlarge. Chart courtesy of StockCharts.com. So that colour blind members are included, bearish signals
will be noted with blue and bullish signals with yellow.
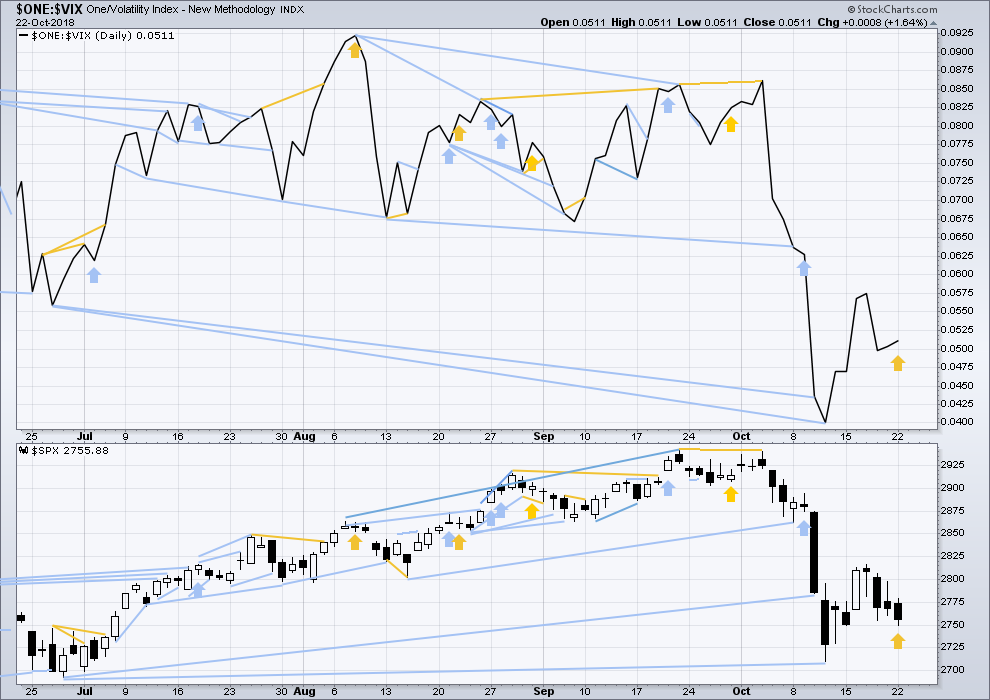
Normally, volatility should decline as price moves higher and increase as price moves lower. This means that normally inverted VIX should move in the same direction as price.
For Monday price moved lower, but inverted VIX has moved higher. Downwards movement during Monday’s session does not have support from declining VIX. This divergence is bullish for the short term. It may either support the second alternate wave count, or it may indicate that downwards movement here is limited.
DOW THEORY
The following lows need to be exceeded for Dow Theory to confirm the end of the bull market and a change to a bear market:
DJIA: 23,344.52.
DJT: 9,806.79.
S&P500: 2,532.69.
Nasdaq: 6,630.67.
ANALYSIS OF INTERMEDIATE WAVE (4)
TECHNICAL ANALYSIS
Click chart to enlarge. Chart courtesy of StockCharts.com.
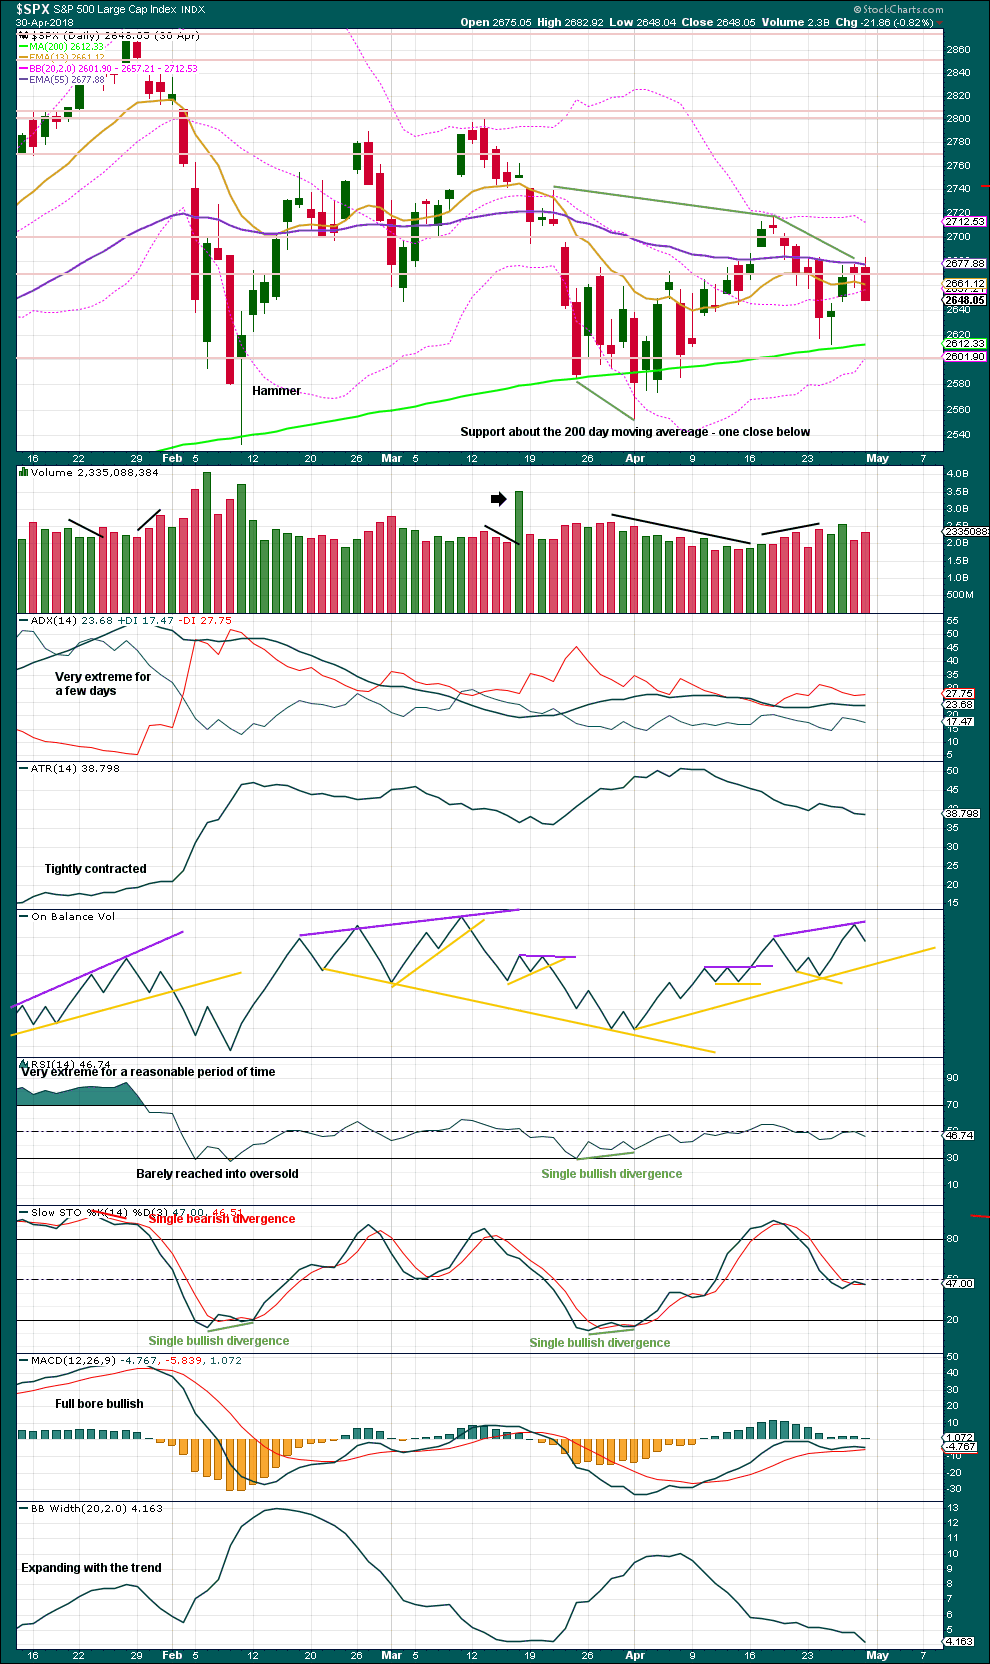
Intermediate wave (4) was a large symmetrical triangle. The deepest wave was the first wave. At its low there was a clear candlestick reversal pattern and bullish divergence between price and Stochastics.
RSI barely managed to reach into oversold.
The current correction for primary wave 4 may behave differently, but there should be some similarities.
It is expected that primary wave 4 may be stronger than intermediate wave (4).
VIX
Click chart to enlarge. Chart courtesy of StockCharts.com.
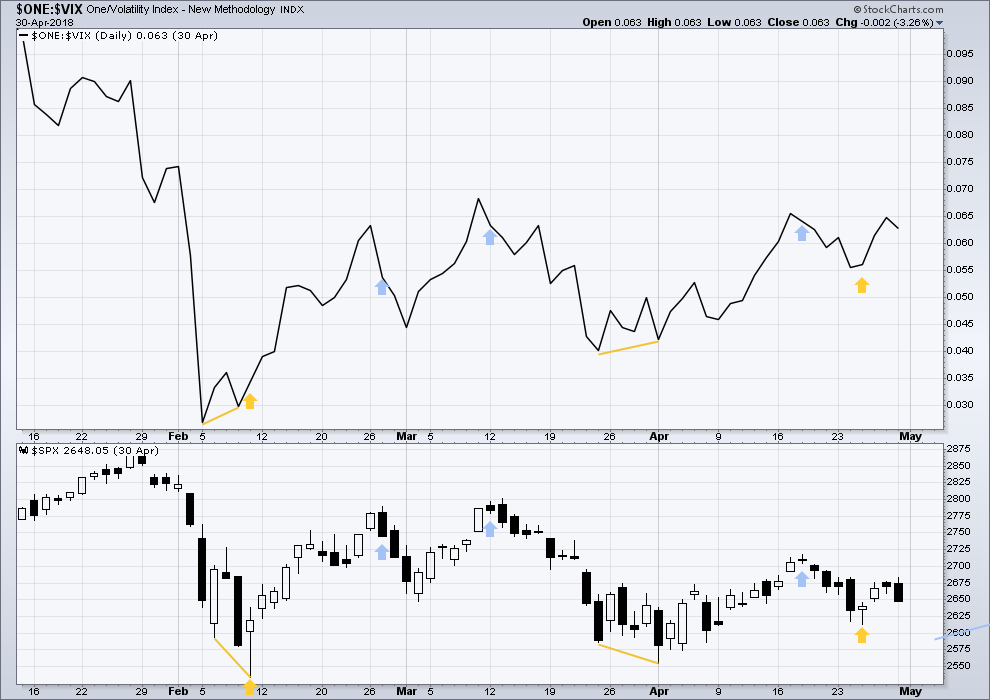
This is a daily chart.
At the two major lows within intermediate wave (4), inverted VIX exhibited single short term bullish divergence.
At highs within intermediate wave (4), inverted VIX exhibited one single day bullish divergence with price.
AD LINE
Click chart to enlarge. Chart courtesy of StockCharts.com.
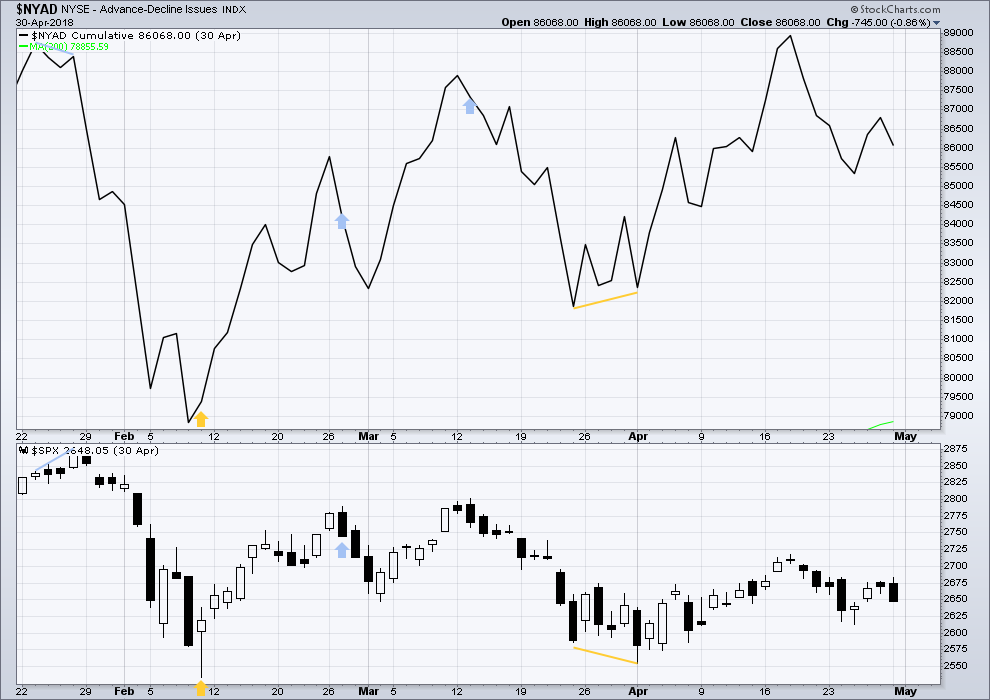
This is a daily chart.
At the two major lows within intermediate wave (4), there was bullish divergence between price and the AD line. At the two major highs within intermediate wave (4), there was each one instance of single day bearish divergence.
Published @ 06:07 p.m. EST.
—
Careful risk management protects your trading account(s).
Follow my two Golden Rules:
1. Always trade with stops.
2. Risk only 1-5% of equity on any one trade.

Massive hammer on the daily
but perhaps not by the close…the turn back down at 2754 is “in”. If and how long it holds we will see.
I expect that at today’s low there may be:
a long lower candlestick wick
bullish divergence with price and either of RSI, Stochastics, On Balance Volume or the AD line
a single day bullish divergence between price and the AD line
two or more of the above would give me confidence that intermediate (B) has begun.
Minor Y can be seen as a complete zigzag if minute b is a triangle. It doesn’t have the best look, but it fits and meets all EW rules.
first, lets see if price can break out of the blue channel today. look out for resistance there first.
Added to SPY in $269’s and have $271 avg now. Also collected a few $300 December 2019 calls.
All in all, game plan coming together.
Your game plan is to take profit at the top of the B wave…or to take profit at the top of the upcoming primary 5 up? Or perhaps both? I’m curious and if you prefer not to address it that’s okay: what are you going to do if SPX this week drops down to 2620? Hold? At what point would you stop out…or will you? For me, these are the hard questions re: positional trades. It’s easy to scale in…but what to do when it moves against? BTW, I have in the dim past (2015 I think) scaled in 1/2 million $$ into a position myself. I never stopped it. At one point I was down $270k (my avg was $36, it went to $17). I ended up exiting TOO EARLY when I was “only” down $10k and I felt “really good” about it, obviously. Had I held another 9 months I’d would have profited by $400k. Had I sold at or close to the XIV top of about $130, well, I don’t think I’d be trading today!!! (This was XIV.) I can kind of laugh about it now. Kind of. Best of luck in your plan!!
think we’ve definitely turned up for the B.
Missed out so far. Have to get in later.
SPX hourly. I anticipate a possible turn at the 38% (2740.2), and if it turns and gives sell triggers, I will on on it.
scribbling on that 38% now. If it keeps pushing up, I’m expecting a turn back down below (or “at”) the low from yesterday, 2849.4…if it passes that, “I don’t know”, but eventually…it’s gonna turn back down.
2754.8 is the 50% and also is just about the low of the iii down of the c down of Y down. So if my view of c down is correct…it “should” turn before that price. I’m often wrong…
Hi Kevin.
You were bang on with that 2690 retracement.
Lara eludes to a multi week bounce. Are we there yet
I don’t know. I’m sure will address that in her daily update. All I “know” (strongly suspect) is that this overall P4 isn’t done re: hitting it’s ultimate low. How long until the selling ramps up again I can’t say.
I do note that after rising here, SPX turned back down, went to exactly 61.8% retrace level of the move up (2700.7)…and turned back up again. Sometimes it’s just like clockwork.
Been staring at Lara’s hourly main. So price is in a Y down. Should have an abc down structure. She shows an a-b as complete, so this is the c. The c should be a 5 wave structure. I do NOT see a complete 5 wave structure for the c at this point on the hourly. Looks kind of like to me that price is now in a iv of that overall 5 wave down move. In which case price should NOT completely fill the gap and infringe on the bottom of the prior i down, and the peak of the current move up…could be a good place for a tactical short (tactical because once this Y completes, a Big B up should follow for weeks…). Anyone got a different view? My EW skills…highly questionable, lol!!! Like 99% of all EW practitioners, I’ve realized. Which is why I’m here, ‘cuz Lara is MONEY.
Lara is MONEY!
Several days ago, I mentioned that oftentimes when a breakout of a triangle occurs, some time later, the market returns to the level of the apex / crux of the triangle. For SPX that level is approximately 2640 plus or minus depending how you draw your triangle trend lines. If we make it that far down, look for support.
The overall sell from the recent ATH is now “only” at -8.4% (or thereabouts). The intermediate 4 was -11%.
I think a P4 “should” be larger, and my general expectation is that it will go quite a ways deeper, to end up at somewhere in the -11% to -18% range, and clearly show itself as a PRIMARY correction vs. a lessor correction. Of course that is not “required”. We have a tumultuous world situation that shows no sign of abating soon; I think that supports a lower prices to come hypthesis. And I look forward to Lara’s take tonight, for sure, to add clarity to the current wave count and what we might expect next. Fun city!
Here’s SPX hourly showing the two targets I established several weeks ago. First one I’m going to say “success”. Second one…I still think price hits it over the next few weeks, maybe much sooner. I reserve the right to change my outlook at any moment though, lol!!!
We have an intraday lower low. Now I am looking for the positive divergences I mentioned yesterday (AD line, NYMO, MACD, etc.) It would be nice if SPX and VIX close outside their lower and upper daily BB respectively. We are nearing a good long position with weeks to the upside for completion. I am getting itchy. But patience is a virtue right here especially because we could go much lower today and in the next couple of days.
I love your strategic thinking Rodney, please do keep sharing it!
I’ve got a lot of analysis to do later. My general sense going into it is that we’ve got a lot more P4 to go, including moving significantly lower “now” or later. So keep looking for those divergences! I expect this P4 to get into a more drawn out corrective structure before we see them, but eyes wide open!
Thanks Kevin. Only the close counts in the McClellan Oscillator (NYMO). But, at this point of the day, it appears we will have a positive divergence. When this happens the market does not always turn on a dime. We often see a lower low with another positive divergence a few days later. Since NYMO is uses moving averages of the AD line, the same can be said for it.
While I think Primary 4 has many weeks to go before completion, and it may morph into other EW or TA patterns, it may be that we will soon see the first sustainable rally within it. That is what I want to trade on the long side. Thereafter, it would be great to catch another wave down to the SPX 2500’s.
BTW, for full disclosure, I am also following the oil market now. It looks like a good long setup is upon us in the next few days. Lara has great analysis in that market as well.
assuming hard selling on open, 2690 is a significant 61.8% and one place to look for a turn.
In RUT I’m watching for a possible hit/turn on a 78.6% (of Feb-Sept swing up) at around 1503. Then there’s the 100% below way down at 1436 but that certainly won’t be today.
SPX is squatting on that 61.8%, but RUT pushed through the 78.6% and NDX made a little turn in no man’s land. I’m suspicious that all adds up to “more down coming soon today”.
or not, pretty strong bounces now off both the SPX and RUT fibos I cited. Probably just “backing and filling” (in an upward direction) to finish out the day I expect, but it’s also very possible a strong wave of selling could hit this market a bit later today.
Is it material yet? -453 from 25294 = 0.0179
NAH!
Look for an entry long sometime this week! We needed a wash out!
I must say I’m enjoying Kevin and Verne’s frequent posts for direction. Rodney had a comment yesterday saying this leg down (end of intermediate A) maybe between 2660 and 2700. Any other guesstimates from others?
I have a feeling the intermediate B up will be strong and swift. Gotta be prepared for that and start a position on the last leg down for y’all Nd of A…
I said late yesterday at the end of the trading session, “this market feels like it’s about to sell off 100 points” or something to that effect. 50+ down now and falling…
My target from a while back for the P4 low was 2680. Don’t see any reason to change that at the moment.
Oops my mistake. My lowest target was 2600-2625 area. I’ll review and reassess a bit later when everything calms down (which may not happen today, lol!!).
The headfakes are getting a little ridiculous. Options market makers seem determined to run as many stops as possible in both directions to shake everyone out and bleed theta/vega. We have gone absolutely nowhere since the initial plunge on 10/10. Unless you’re trading the intraday swings perfectly there is not much room for profit in this environment. I prefer to make longer timeframe moves but I’m getting worried they’ll keep this market in no man’s land for months. Anyone going for weekly swings has their work cut out for them.
Well the market doesn’t usually just go straight up or down. There will always be countertrend corrections, and some can be swift and strong like the 3% move up we had last week…
Your mid and long term accounts should already be short.
A few weeks ago I posted about the importance of getting positioned ahead of primary degree turns to maximize profits from the impending trend change, which in this case was clearly signaled. At that time we loaded long and mid term accounts with VXX 30 strike calls, DIA 270 strike puts, and SPY 290 strike puts, all with December expiration. We were prepared to be underwater temporarily.
You are right about short term whipsaw and this is typical of bear market price action. The market closed last Friday at essentially the same level it did a week prior, yet active traders churned out multiple double and triple digit gains as volatility was high.
Here is a tip for trading bear markets. Some of the most spectacular counter-trend rallies are seen during bear markets. Always hold a few calls in your trading account during the down-trend. This insurance/hedge pays for itself owing to the violent counter-trend rallies. More impotantly, when your hedging calls explode in value during a down-trend, you know when to add to your short trades, lowering cost basis. I generally hold three to five OTM calls and when they explode in value, I sell four to recoup cost, and monitor the last call to see when the counter-trend ramp is ending and a good time to add to short positiions. Even if your calls sometimes expire worthless, you still come out ahead in the end. We have had few chances to use this strategy since the turn. At the time I add to short trades in short term account, I roll calls out another two weeks at a lower strike price.
The coil has broken to the downside and not up as I anticipated. The market is defying the banksters’ attempt to defend 2750. Best of trading success to everyone.
Gone the rest of this week.
My approach is similar (but of course different too). I DEFINITELY got positioned early…but could have been earlier and more timely (a systemic issue I keep working on). Those positions are spreads with expiries out in Nov/Dec/Jan to assure that I do catch the P4 even if delayed, slow, etc. Suffice to say they are looking good to extremely good right now. Then I tradershorter term all the way to intra day on top of that for “daily bread”. Example: I bought and held naked puts yesterday, as the market felt exceedingly heavy to me. BINGO and SOLD!! Now to watch for a reload spot…
However, I am extremely timid to counter trend trade unless the short term long set up is REALLY GOOD in my eyes, and I use EXTREME RISK management. Not a situation to ever have a “hopeful holding” IMO. Quickly in the black or GOODBYE POSITION and GOODBYE SMALL LOSS. Just my style. Hope that helps.
First….Happy Trading all!!