
Downwards movement was expected for the short term. Although price did not make a new low, the candlestick for Friday closed red and the upper wick was long. Overall, this fits expectations.
Summary: For the short term, next week may see more downwards movement to a new low. The target is at 2,698, which is just below support about 2,700; if that gives way, then about 2,677.
After this next wave down, a multi week bounce may develop.
A primary degree correction should last several weeks and should show up on the weekly and monthly charts. Primary wave 4 may total a Fibonacci 8, 13 or 21 weeks. Look for very strong support about the lower edge of the teal trend channel on the monthly chart.
Primary wave 4 should be expected to exhibit reasonable strength. This is the last multi week to multi month consolidation in this ageing bull market, and it may now begin to take on some characteristics of the bear market waiting in the wings.
The final target for this bull market to end remains at 3,616, which may be met in October 2019.
New updates to this analysis are in bold.
The biggest picture, Grand Super Cycle analysis, is here.
Last published monthly chart is here, video is here.
ELLIOTT WAVE COUNT
WEEKLY CHART
Click chart to enlarge.
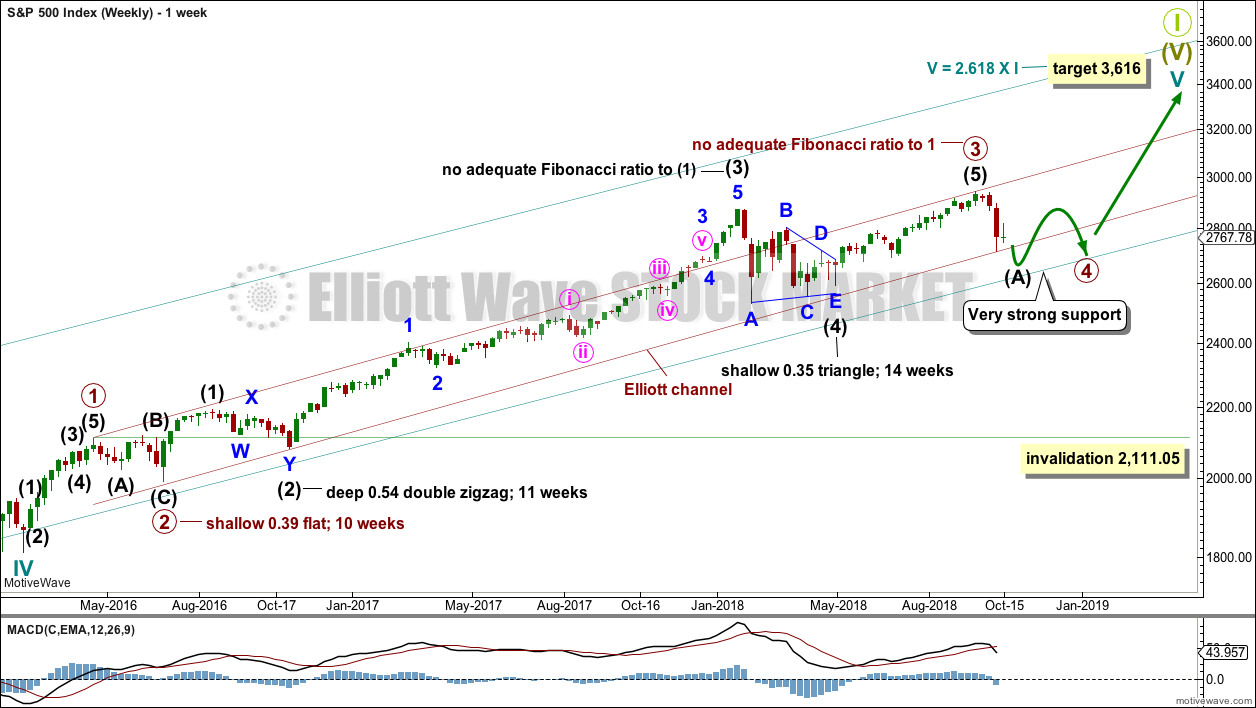
Cycle wave V must complete as a five structure, which should look clear at the weekly chart level and also now at the monthly chart level. It may only be an impulse or ending diagonal. It is clear it is an impulse.
Within cycle wave V, the third waves at all degrees may only subdivide as impulses.
Within primary wave 3, there is perfect alternation and excellent proportion between intermediate waves (2) and (4).
The channel is now drawn about primary degree waves. The first trend line is drawn from the ends of primary waves 1 to 3, then a parallel copy is placed upon the low of primary wave 2. Primary wave 4 may find support about the lower edge of this maroon channel. At the end of the first downwards wave within primary wave 4, that is exactly where price bounced up. The overshoot of the upper edge of this channel by the end of intermediate wave (3) looks typical. For the S&P, its third waves are usually the strongest portion of an impulse; they often exhibit enough strength to overshoot channels.
Fourth waves do not always end within channels drawn using this technique. If primary wave 4 breaks out of the narrow maroon channel, then it may find very strong support about the lower edge of the teal channel. This channel is copied over from the monthly chart and contains the entire bull market since its beginning in March 2009. While Super Cycle wave (V) is incomplete, this channel should not be breached.
Primary wave 4 may not move into primary wave 1 price territory below 2,111.05.
When primary wave 4 may be complete, then the final target may be also calculated at primary degree. At that stage, the final target may widen to a small zone, or it may change.
At this stage, the expectation is for the final target to be met in October 2019. If price gets up to this target and either the structure is incomplete or price keeps rising through it, then a new higher target would be calculated.
DAILY CHART
Click chart to enlarge.
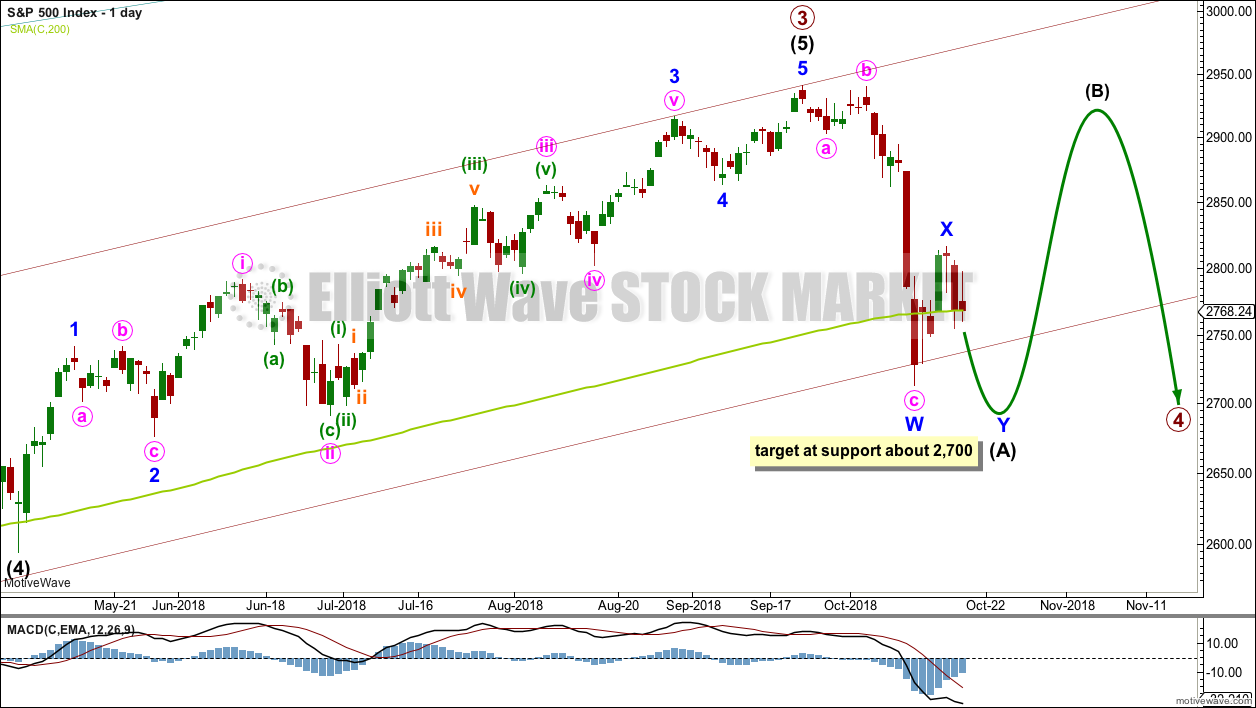
Primary wave 4 would most likely end somewhere within the price territory of the fourth wave of one lesser degree. Intermediate wave (4) has its price territory from 2,872.87 to 2,532.69. Within this range sit the 0.236 Fibonacci ratio at 2,717 and the 0.382 Fibonacci ratio at 2,578.
The 0.382 Fibonacci ratio would expect an overshoot of the teal channel. This may be too low; price may find support at the lower edge of the channel. However, as primary wave 4 should be expected to exhibit reasonable strength, it may be able to overshoot the channel and that would look reasonable.
Primary wave 2 unfolded as a shallow regular flat correction lasting 10 weeks.
Primary wave 4 may have begun with a zigzag downwards. This is labelled as the first zigzag in a possible double zigzag downwards for intermediate wave (A).
If intermediate wave (A) unfolds as a double zigzag, then primary wave 4 may be unfolding as either a flat or a triangle. A double zigzag may not be labelled as intermediate wave (W) because the maximum number of corrective structures is three, and to label multiples within multiples increases the maximum beyond three and violates an Elliott wave rule.
If primary wave 4 is unfolding as a flat correction, then intermediate wave (A) may be a double zigzag. Primary wave B may then bounce higher to retrace a minimum 0.9 length of primary wave A, and may make a new high above the start of primary wave A as in an expanded flat correction.
If primary wave 4 is unfolding as a triangle, then intermediate wave (A) may be a double zigzag. Primary wave B would have no minimum required length, and would most commonly be about 0.8 to 0.85 the length of primary wave A.
Primary wave 4 may not move into primary wave 1 price territory below 2,111.05.
HOURLY CHART

Click chart to enlarge.
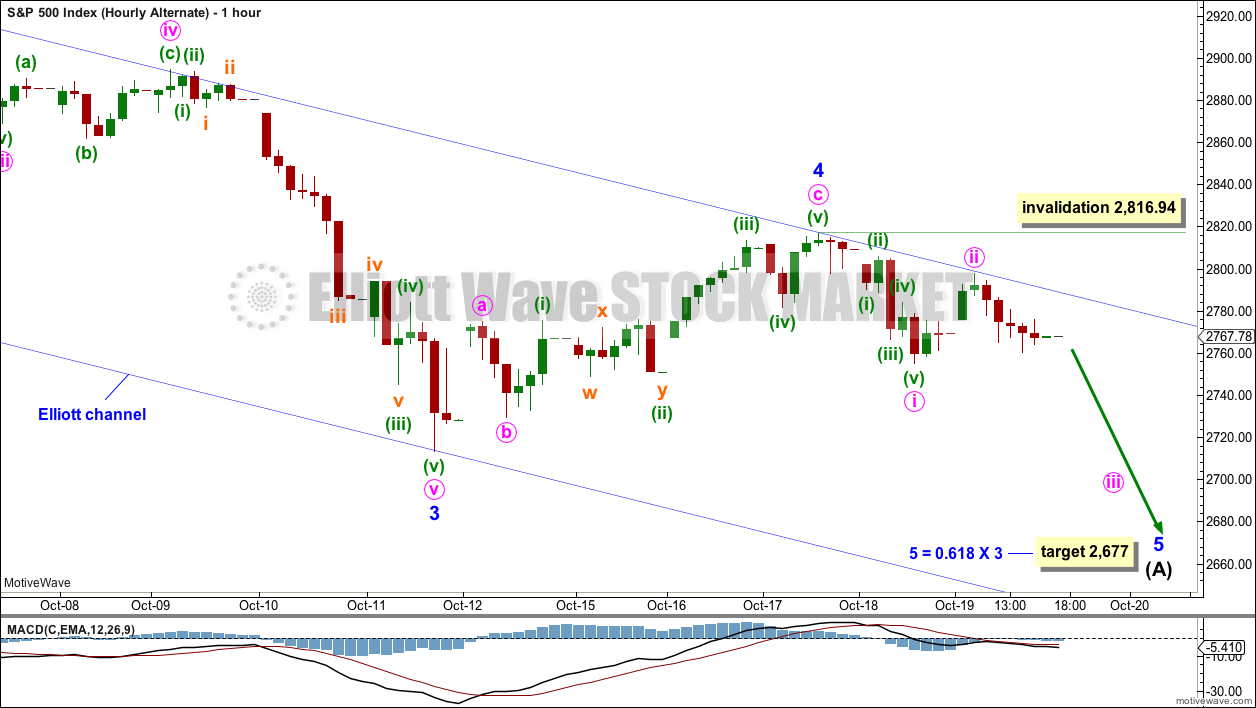
Intermediate wave (A) may be an incomplete double zigzag. The fist zigzag in the double may be complete, labelled minor wave W. The double may now be joined by a completed three in the opposite direction, a zigzag labelled minor wave X.
Double zigzags should have a strong slope against the prior trend, downwards in this case, and to achieve a strong slope their X waves are normally brief and shallow. The second zigzag in a double has the purpose of deepening the correction when the first zigzag does not move price deep enough. A target is now calculated for minor wave Y to end using a common Fibonacci ratio between minute waves a and c. This target is very close to support about 2,700.
Within minor wave Y, minute wave b may not move beyond the start of minute wave a at 2,816.94.
ALTERNATE DAILY CHART

Click chart to enlarge.
It is also possible to see intermediate wave (A) as an incomplete five wave structure.
There is now reasonably good proportion between minor waves 2 and 4 within this wave count. Additionally, there is alternation between the deep 0.96 combination of minor wave 2 and the shallow 0.46 zigzag of minor wave 4.
There is no adequate Fibonacci ratio between minor waves 3 and 1. This makes it more likely that minor wave 5 may exhibit a Fibonacci ratio to either of minor waves 3 or 1. Because minor wave 1 was very short, a Fibonacci ratio to minor wave 3 here looks slightly more likely.
If intermediate wave (A) ends with closing below the lower edge of the maroon channel, which is copied over from the weekly chart, then intermediate wave (B) may bounce up to test resistance there.
Intermediate wave (B) may not move beyond the start of intermediate wave (A) above 2,940.91.
ALTERNATE HOURLY CHART
Click chart to enlarge.
The channel is redrawn about this possible impulse downwards using Elliott’s second technique. Draw the first trend line from the ends of minor waves 2 to 4, then place a parallel copy on the end of minor wave 3.
Minor wave 5 may end either midway within the channel or about the lower edge if the target is inadequate.
Within minor wave 5, minute wave ii may not move beyond the start of minute wave i above 2,816.94.
SECOND ALTERNATE DAILY CHART

Click chart to enlarge.
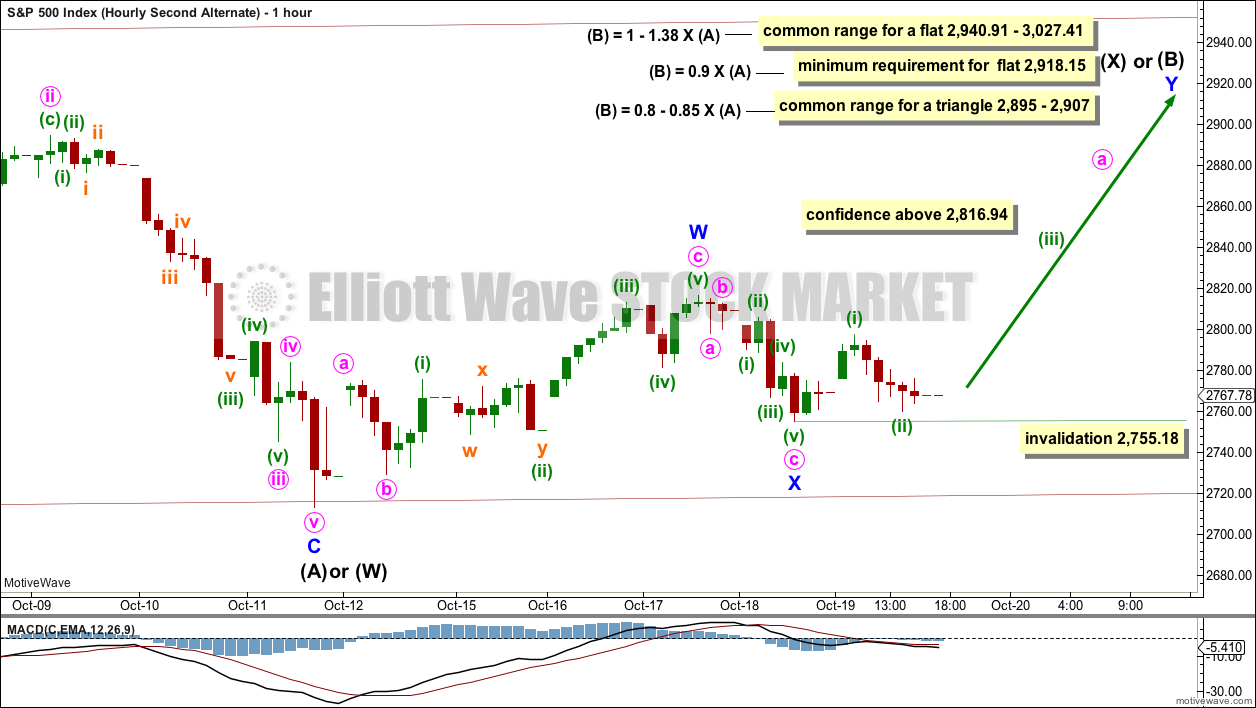
It is also possible to still see intermediate wave (A) as a complete zigzag. The bounce may continue next week for intermediate wave (B).
If intermediate wave (A) is a zigzag, then primary wave 4 may be unfolding as a flat or triangle.
The zigzag may also be labelled intermediate wave (W), because primary wave 4 may be unfolding as a double combination with the first structure a zigzag and the second structure most likely a flat.
While waves W, Y and Z within combinations must only subdivide as single corrective structures, X waves may subdivide as any corrective structure including multiples (although this is uncommon). X waves are not counted in the maximum number of allowable corrective structures which is three.
SECOND ALTERNATE HOURLY CHART
Click chart to enlarge.
If intermediate wave (A) or (W) is a complete zigzag, then intermediate wave (B) or (X) would be expected to be a very high bounce.
The minimum requirement for intermediate wave (B) within a flat correction is for it to retrace 0.9 of intermediate wave (A).
There is no minimum requirement for the length of intermediate wave (B) within a triangle.
There is no minimum requirement nor maximum limit of intermediate wave (X) within a double combination.
This alternate wave count expects that intermediate wave (A) or (W) found support at the lower edge of the maroon channel. If primary wave 4 continues as a triangle, then support at that line may hold.
A new high above 2,816.94 by any amount at any time frame would add some confidence to this alternate wave count. At that stage, a continuation of a deep bounce would be most likely.
TECHNICAL ANALYSIS
WEEKLY CHART
Click chart to enlarge. Chart courtesy of StockCharts.com.
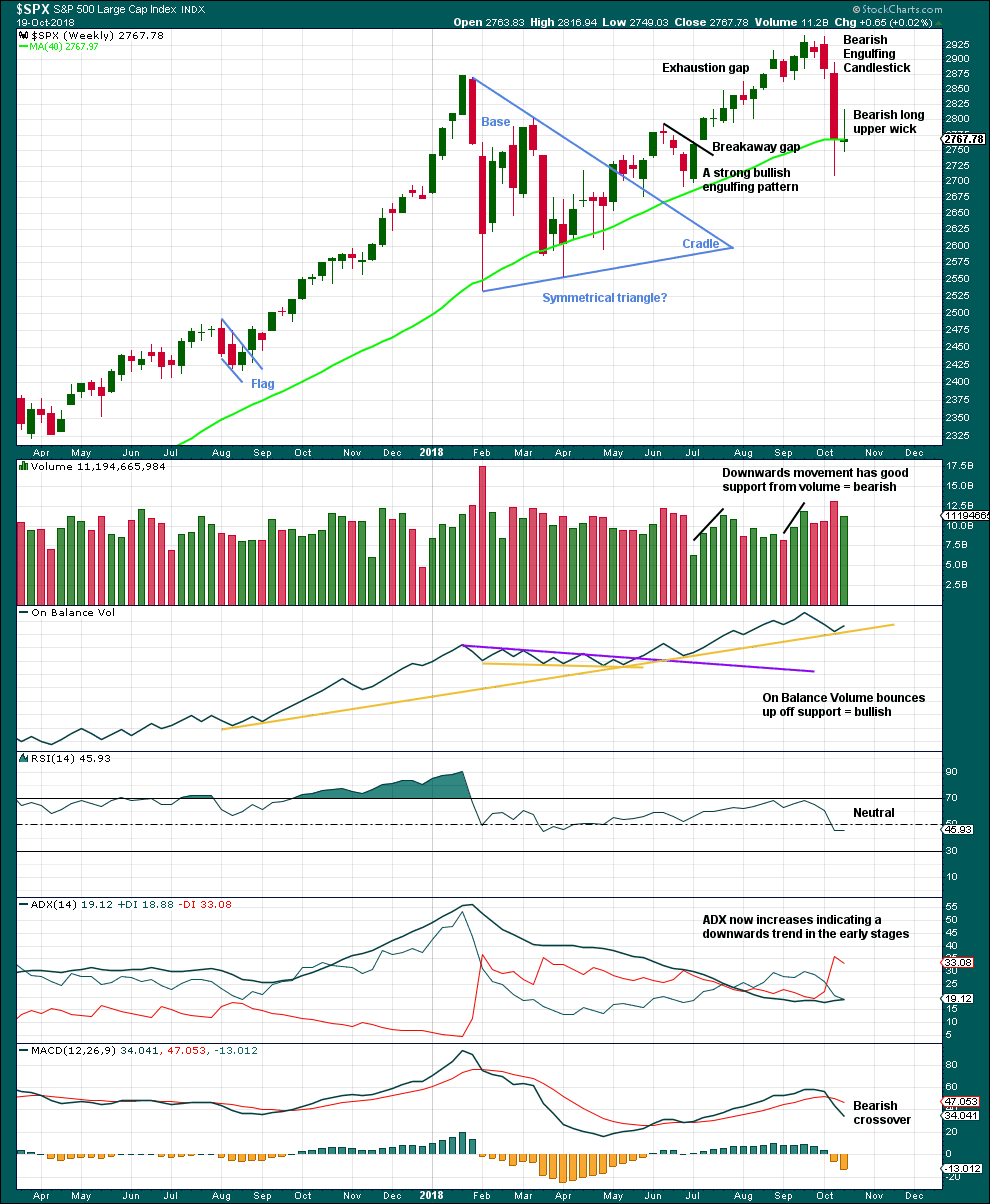
The bearish long upper wick on this weekly candlestick is contradicted by a bullish signal from On Balance Volume. Downwards movement here may be limited as On Balance Volume may find support with one more downwards week.
DAILY CHART
Click chart to enlarge. Chart courtesy of StockCharts.com.
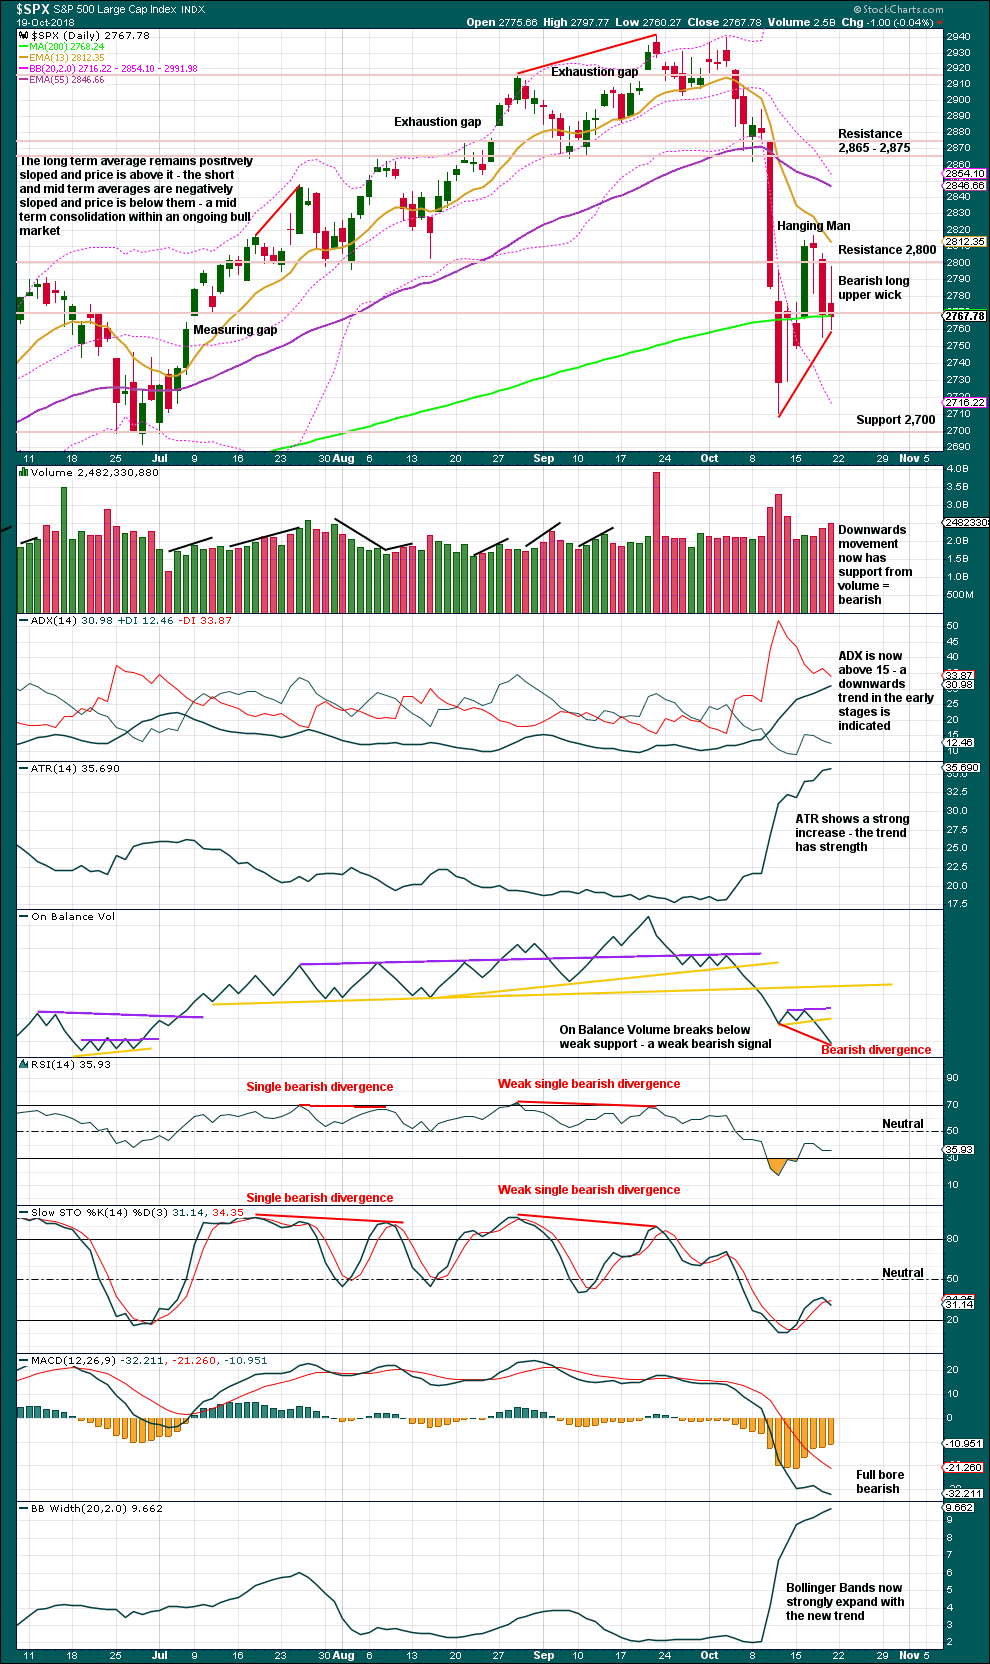
A bearish long upper wick, support from volume for downwards movement, and a new low for On Balance Volume at the daily chart level all indicate more downwards movement next week to a new low below 2,710.51 as most likely.
Look out for support below, at about 2,700.
VOLATILITY – INVERTED VIX CHART
WEEKLY CHART
Click chart to enlarge. Chart courtesy of StockCharts.com. So that colour blind members are included, bearish signals
will be noted with blue and bullish signals with yellow.
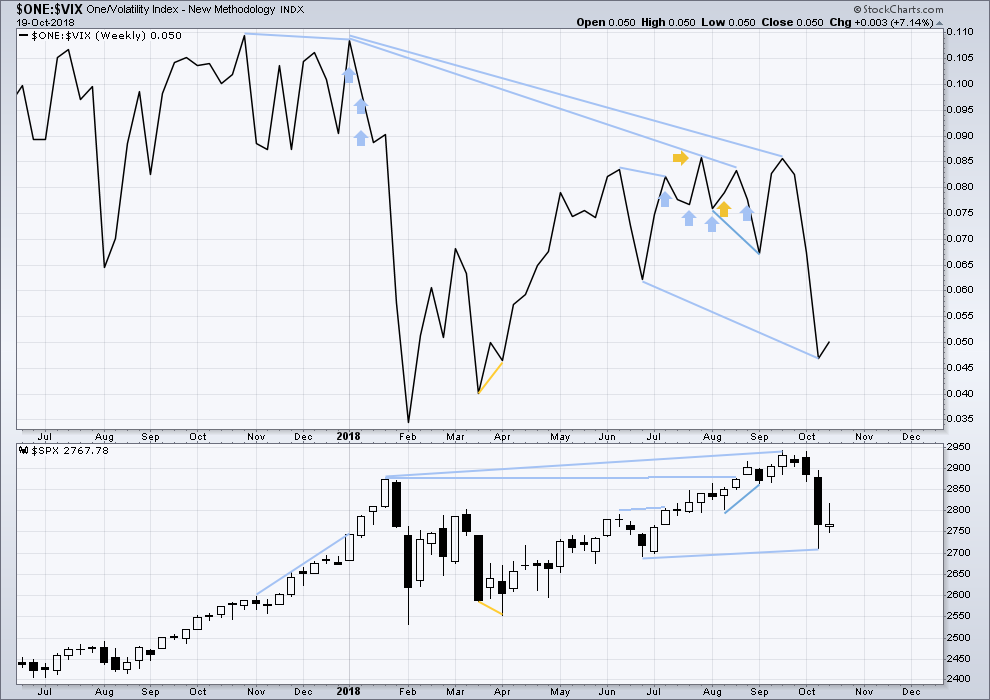
Primary wave 4 has now arrived and is showing reasonable strength. There is continuing mid term bearish divergence with inverted VIX making a new low below the prior swing low of the week beginning 25th June, but price has not yet made a corresponding new low.
As primary wave 4 continues this weekly chart may offer a bullish signal at its end.
This week completed an inside week with the balance of volume upwards and a green weekly candlestick. A small upwards movement from inverted VIX offers no new short term divergence.
DAILY CHART
Click chart to enlarge. Chart courtesy of StockCharts.com. So that colour blind members are included, bearish signals
will be noted with blue and bullish signals with yellow.
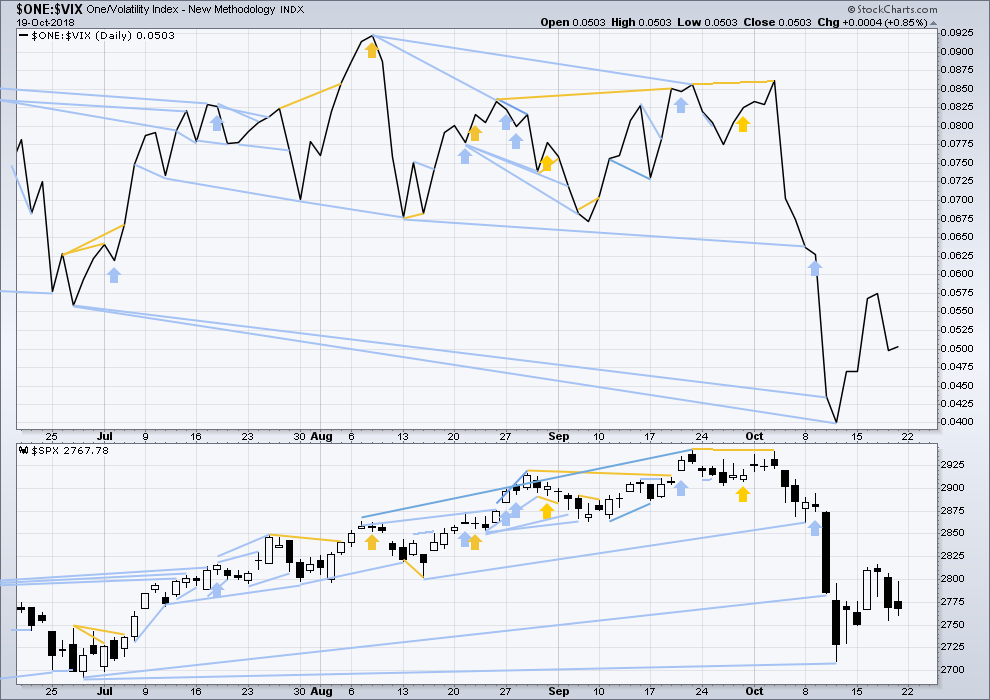
Normally, volatility should decline as price moves higher and increase as price moves lower. This means that normally inverted VIX should move in the same direction as price.
For Friday the candlestick closed red and the balance of volume was down, but the day was an inside day.
Downwards movement during Friday’s session does not have a normal increase in VIX. This divergence for the short term is bullish.
BREADTH – AD LINE
WEEKLY CHART
Click chart to enlarge. Chart courtesy of StockCharts.com.
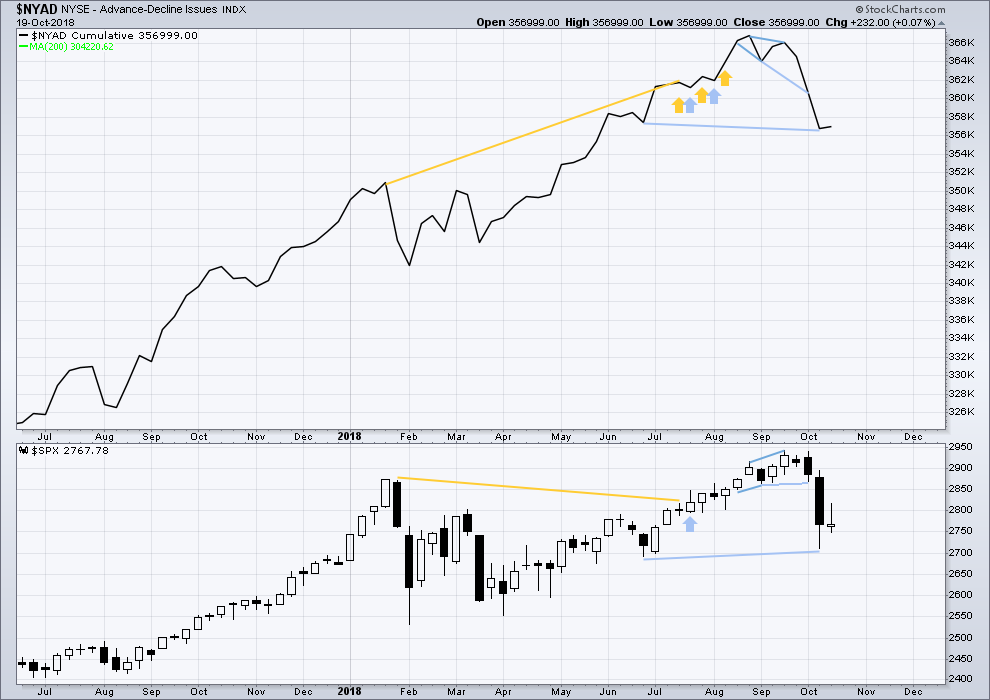
When primary wave 3 comes to an end, it may be valuable to watch the AD line at the weekly time frame as well as the daily.
The AD line has made a slight new low below the prior swing low of the week beginning 25th June, but price has not. This mid term divergence is bearish, but it is weak.
Upwards movement within this last week has support from a slight increase in the AD line. There is no new short term divergence.
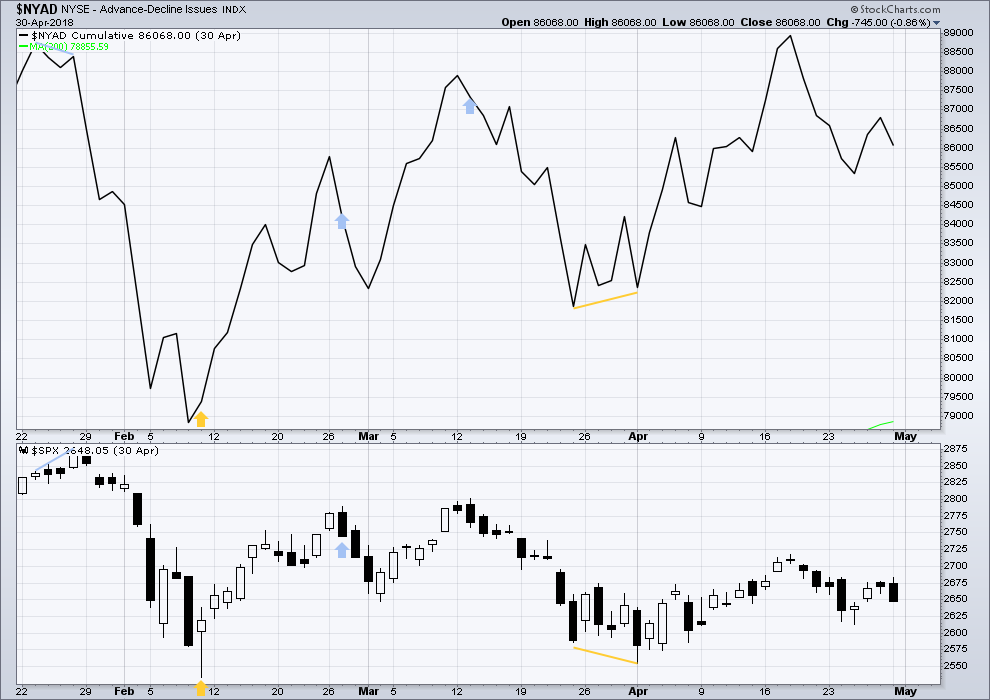
DAILY CHART
Click chart to enlarge. Chart courtesy of StockCharts.com.
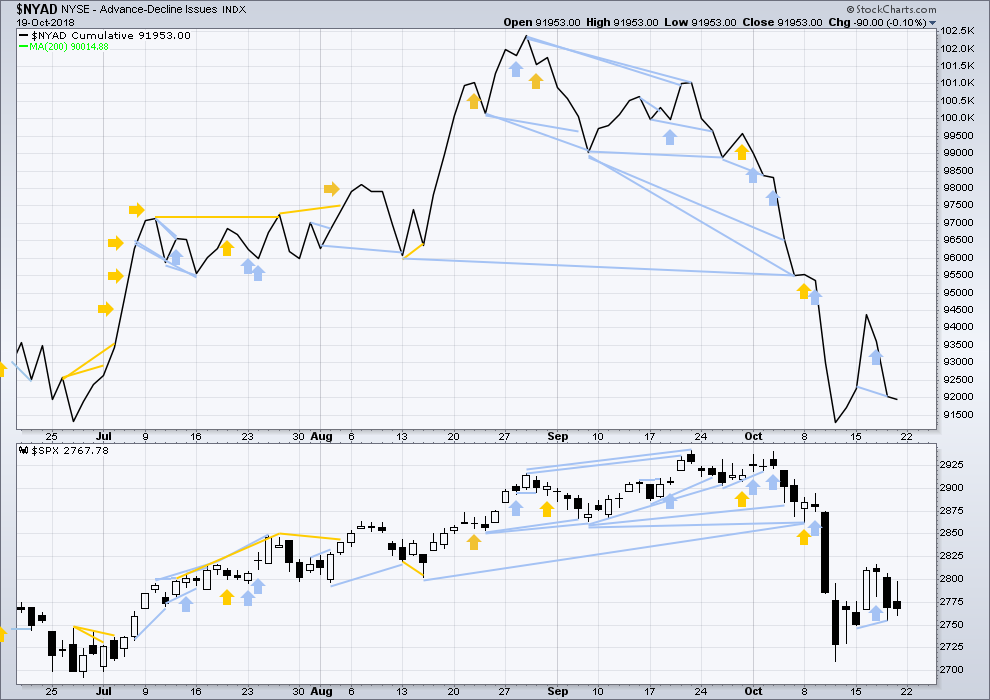
There is normally 4-6 months divergence between price and market breadth prior to a full fledged bear market. This has been so for all major bear markets within the last 90 odd years. With no longer term divergence yet at this point, any decline in price should be expected to be a pullback within an ongoing bull market and not necessarily the start of a bear market. New all time highs from the AD line on the 29th of August means that the beginning of any bear market may be at the end of December 2018, but it may of course be a lot longer than that. My next expectation for the end of this bull market may now be October 2019.
Breadth should be read as a leading indicator.
The AD line has made a new low below the prior low of the 15th of October, but price has not. This divergence is short term and bearish; it is reasonable, but it is not very strong. This supports the first two Elliott wave counts.
Downwards movement during Friday’s session has support from a decline in market breadth. This is bearish.
Both of mid and small caps moved lower on Friday. Downwards movement has some support from market breadth. This looks bearish for the short term, and a new low below the last small swing low looks most likely here.
DOW THEORY
The following lows need to be exceeded for Dow Theory to confirm the end of the bull market and a change to a bear market:
DJIA: 23,344.52.
DJT: 9,806.79.
S&P500: 2,532.69.
Nasdaq: 6,630.67.
ANALYSIS OF INTERMEDIATE WAVE (4)
TECHNICAL ANALYSIS
Click chart to enlarge. Chart courtesy of StockCharts.com.
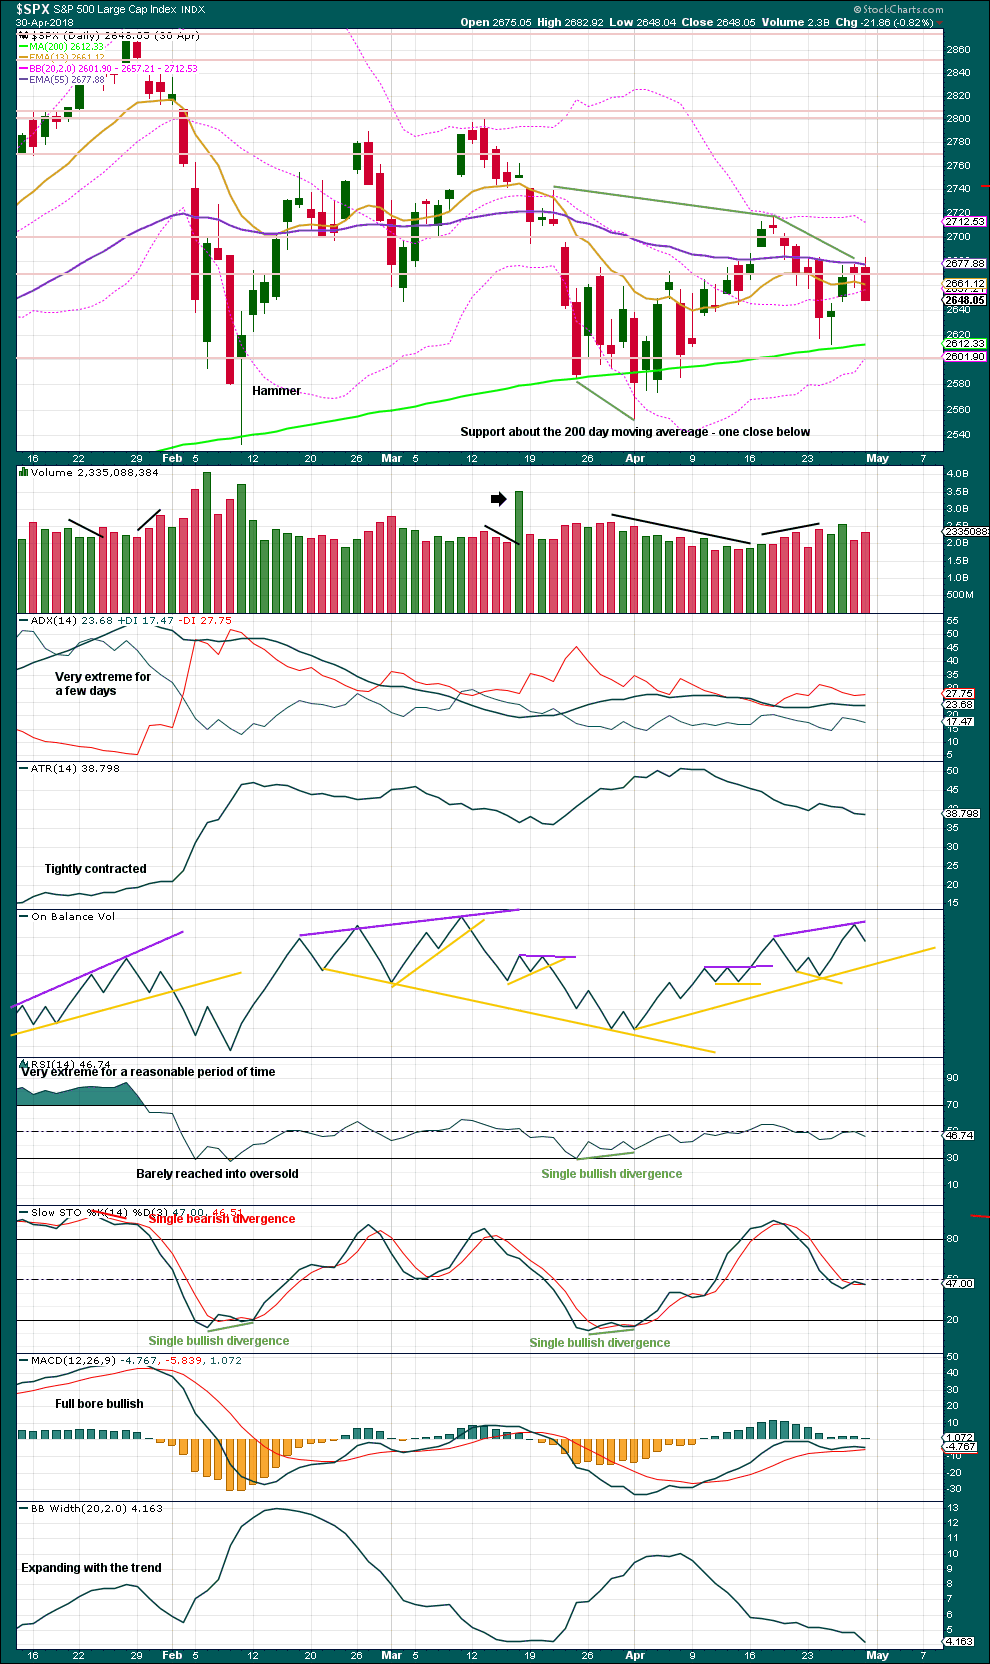
Intermediate wave (4) was a large symmetrical triangle. The deepest wave was the first wave. At its low there was a clear candlestick reversal pattern and bullish divergence between price and Stochastics.
RSI barely managed to reach into oversold.
The current correction for primary wave 4 may behave differently, but there should be some similarities.
It is expected that primary wave 4 may be stronger than intermediate wave (4).
VIX
Click chart to enlarge. Chart courtesy of StockCharts.com.
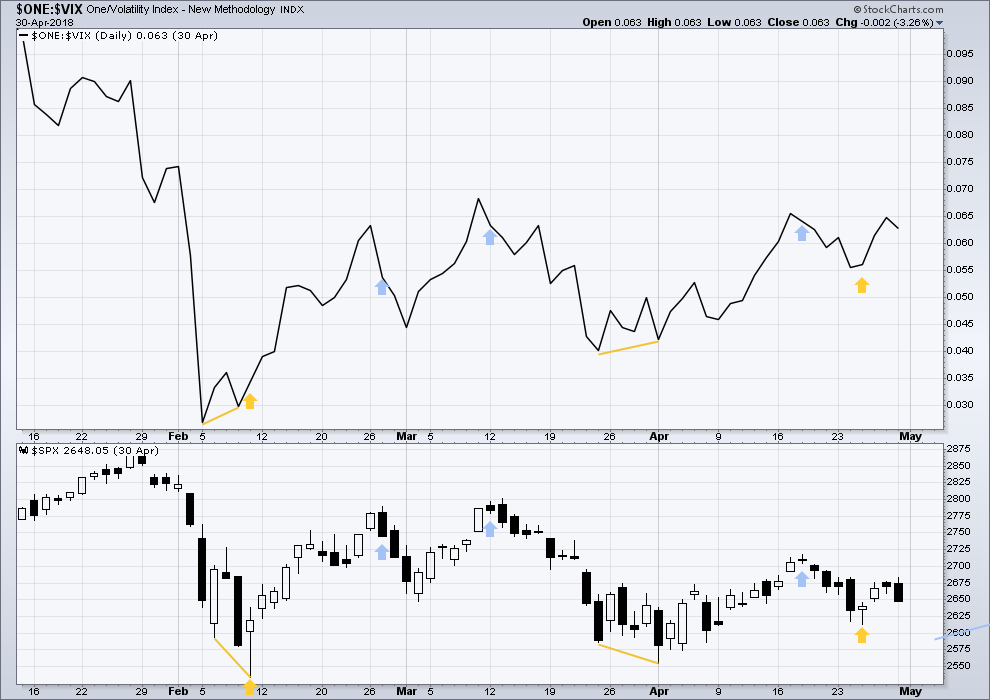
This is a daily chart.
At the two major lows within intermediate wave (4), inverted VIX exhibited single short term bullish divergence.
At highs within intermediate wave (4), inverted VIX exhibited one single day bullish divergence with price.
AD LINE
Click chart to enlarge. Chart courtesy of StockCharts.com.
This is a daily chart.
At the two major lows within intermediate wave (4), there was bullish divergence between price and the AD line. At the two major highs within intermediate wave (4), there was each one instance of single day bearish divergence.
Published @ 05:29 p.m. EST on 20th October, 2018.
—
Careful risk management protects your trading account(s).
Follow my two Golden Rules:
1. Always trade with stops.
2. Risk only 1-5% of equity on any one trade.
The session is closed and I have StockCharts data. I’m going to keep the second alternate today because VIX exhibits single day bullish divergence today.
It has a low probability, but it’s still valid and it has that one piece of support.
Massive coiling action in the indices portends a big move ahead. The banksters are not going to make it easy. I am expecting an initial thrust UP from the coil. Stay alert…! 🙂
Not sure if anyone here cares about SPX squeezes but I sure do.
SPX now in hour #2 of a hourly TF squeeze. Last one lasted about 7 hours and broke strongly to the upside (which tells us nothing about how this one will resolve, sadly). I’m seeing little short term bullish signs here and there (IYT and XRT are both up, monsters of tech up over 1%, etc). I’m suspicious we’ve got a small leg up coming soon.
NDX and DJX are also squeezing at the hourly TF.
Yep. It will be engineered with massive vol suppression, as you can plainly see… 🙂
2767.6 is a fresh 61.8% retrace of the most recent leg down, and is a level to be watched for a possible turn back down.
They are going to “Shake the Trees”. Get ready! 🙂
280 puts should return a five bagger, possibly more…
Funny, I do believe was buying some naked puts right as you posted that…but I like a little protection so for naked puts at this juncture I use Dec expiry to give me assurance that I will secure a profit even if some wild P4 retrace upward occurs.
Smart! I have open “stink bids” on 280 strike puts to snag any counter-trend ramp. Low risk, high return and has been working like a charm…! 🙂
I am playing Oct 26 expiry…the moves will be brutal…
I’ve pushed the upper trend line on the best fit channel up to sit on the high of minor X, this now shows where minute b and minuette (ii) find resistance so this looks right.
The second alternate count is invalidated at the hourly chart level today.
I may discard it.
Meandering around 2750 is short term bullish. I think we get another pop higher before we head down. Gotta run!
Back tomorrow GW… 🙂
Trading the NDX triangle with a 174 strike Triple Q option straddle. This trade just might pop twice… 🙂
NDX increasingly looking like a b wave triangle. If so, a sharp C wave up to finish corrective move is next.
I see that. back to the recent highs around 7311 likely, and possible up to the 61.8% at 7393.
You the man…! 🙂
None of these market moves in Percentage terms are material!!! (DJIA previous close 25,444)
300 pts(0.0118%), 700pts. (0.0275%), 1000 pts (0.0393%) is NOT material… zip… nada!
10% = 2544.40, 15% = 3816.6pts, 20% = 5088.80pts, 25% = 6361.00pts… From the old days… these are more material moves.
A Crash… is defined as 30%, 40%, 50% & 60%…….
0.0118%, 0.275%, & 0.393% is an absolutely NOTHING move!!!
So please stop the Fake Panic posts!
Posts intended ONLY for traders Joe…. 🙂
On the question of 300, 700, and 1000 point moves being insignificant, here is an interesting consideration: how often do you see them? 🙂
If you are a trader, a move of merely 25 points is significant!
You are off by a factor of 100.
1000 points off the DJIA from a starting point of 25444 is a 3.5% move. Not a 0.035% move.
I believe many of your figures suffer from the same error.
As for what is “material”, that is subjective is it not? If I have a $1M position and I get a 0.1% move…that may be awfully material to me. As an example.
Maybe you mean something rather different by “material”.
Verne – I’ve deleted your last comment because it could be construed as disrespectful. And it may not be accurate.
Lara, it was NOT intended to be disrespectful but it was a true statement. Joe is a long time poster and is, by his own admission not a trader but an investor. This observation was not a criticism. No trader alive would have made the statement that he did today and that is quite allright.
I trust we are all adults here…I could however be mistaken…
This is the last thing I will say about this.
I find it ironic Lara, that you did not take issue with Joe’s accusation regarding “fake panic posts”, yet took issue with what was intended to be an explanation of what surely had every trader on the forum scratching their heads. O.K. Now I am done!
Yep… I should have not put the % sign in the post.
It is really amazing that DJIA has already traveled 300 points today including the counter- trend bounce. Cashing in 258 strike puts in short term account for easy double. Amazing!
Kind of feels to me like the big “second” market smack down in the overall P4 is right around the corner, maybe even firing up today. If the market starts to break down, it just might accelerate big time and sell off 100 points in SPX fast. That would be generally consistent with our main.
Nope, just a little range day between 2750 and 2772.
Until 2050 is decisively taken out, a sharp C up, as well as nested 1,2s remains a possibility imho..
Correction. 2750…
Today’s low went below lara’s 2750 invalidation area?
Does that mean anything?
Thank You
That would be an invalidation of the 2nd alternate hourly that says price is in a Y up, I believe.
From a trader’s perspective, the CLOSE is what matters.
They are spending a phenomenal amount of capital defending 2750 so it may be an even more important deleveraging trigger than 2700. I suspect if 2750 falls, the move down to 2700 will be swift.
From an elliott wave invalidation perspective, any price movement past an invalidation level “invalidates”. Close not required.
The man asked what it MEANT. I suspect he cares more about making a profitable trade than in getting a count correct and the two are not mutually inclusive. Of course ANY move past an invalidation point invalidates a particular count. It is self evident. 🙂
IMO the NASA climate map of how the world will be in 2100 should be studied by everyone (just search for “NASA 2100 climate”). It shows the vast bulk of the US as uninhabitable extreme heat wasteland, and similar conditions for all of the current “temperate” zones of the Earth currently. It’s not going to be a situation where you want your family (your future family) to be anything except one of the first to take action to get somewhere livable. Those who attempt to migrate when the big migrations start up…well, I just don’t think that’s going to be a pleasant situation, and we’ll leave it at that. The change occurring now is a massive “short cycle” extinction level event relative to planetary norms and planetary changes. Humankind won’t end up extinct (though vast numbers of other species certainly will), but I would guess that our #’s will be reduced by about 90-95%, and almost all of us will be living close to the poles. Civilization as we know it today most assuredly gone. Something to think about and study yourself while the market is slow. Or not. ps: I don’t want to argue this, and won’t. Your views may differ, and that’s okay, but everyone deserves to be given the heads up to assess it for themselves, so…heads up. Big time, heads up.
Your correct it’s a question of when it will happen and not IF!
Human’s are due for there 6 – 7 bottle neck coming.
Once the flow of hot and cold water flowing from North to South pole stop it will be a guarantee of a 90 – 95% of human’s death.
It’s like earth is getting rid of us like a bad virus.
All the models used today are dead wrong…!!!
Believe it or not… the model that has been most accurate to date is the Russian model.
CC is biased political nonsense masquerading as real science!
For a real science view… read this guy’s work on the topic… end the brain washing in Universities!
Dr. Patrick Michaels, director of the Center for the Study of Science at the Cato Institute, provides insight into the debate over climate change and the political games played to create policy.
There are detailed reports online of the 30 years of claims by Michaels that have proven wrong…and wrong…and wrong. Just search for his name and CATO and you’ll find those detailed reports. Michaels is just another paid supporter of the status quo I’m afraid. The science of climate change is now rock solid. The only debates now are around WHEN things like the collapse of the Antarctic ice sheets will happen, WHEN the Greenland ice sheets will fully melt, etc.
All the models used are wrong… wrong… wrong… Garbage in… Garbage out!
The lunar cycles have not been at all consistent, but the Hunter’s moon this Wednesday just might see an interim low as it would be close to a few other cycle turn dates…
Well, are the bears going to keep playing with their food? 😉
We cannot rule out a sharp move higher to complete the C leg of a larger ABC upwards correction.
Once you have positioned your mid and long term accounts for the main current trend, believe it or not, the gains you can make trading counter-trend bounces can be truly amazing. Most traders will not make these trades as they are very counter-intuitive, and few people have learned the disipline of being comfortable under water temporarily when warranted by a main trend that is clear. Of course one has to be nimble but the counter trend trades can easily eclipse the position trades! No kidding! 🙂
Crux time now. The market sells off from here (generally)…or…our most bearish count gets blown away and price is in a Y up!!!
SPX price (assuming no more significant sell of immediately) is going to get pinched against the down trend (and elliott wave channel) line, shown.
Per the main hourly, price SHOULD now be in wave iii of a 5 wave C down. Another leg should be coming relatively soon, and certainly before that downtrend line is exceeded (if price even gets close to it here).
Or more likely, SPX is in another ii up in a sequence of i-ii’s down, revving up for the iii down action to come this week.
2776 is a 78% back up, and possible turn back down level here.
oops, I mean 2772.6, sorry!!!!
Price got to 2772.4 and turned. Fibo magic.
Yep. Deep second to tag broken support shelves.
Hehe! Looks like da bearssss hammered the attempted hammer!
You’ve gotta admit these tussles are eminently amusing!
Taking bets everyone!
Does 2050 hold, or do they smash it??!
STEP right up…!!!! 🙂 🙂
My! Look at that fur fly!
I gotta say, I’m having a bleep load of fun…..:)
More fun than a barrel of…. well, you know…! 🙂 🙂 🙂
It sure looks to me like someone is STILL playing Russian roulette with volatility. These levels, considering the recent price action, look, walk, and quack like someone is “goosing” the suppression action with very serious leverage! And that is my bottom line! 🙂
After slicing though the SPX 2800 round number on Oct. 10th, the SPX was pushed back up to test it. The test from the underside has been resoundingly rejected. We are now on the way to test the lows at 2710. If Spx can hold between 2700 and ~ 2660 then we might see a sustainable rally. I will be looking for positive divergences in AD Line, MACD, NYMO, RSI and a few others. Positive divergences will be a key for any sustainable rally. If they are not present, then we may need a lot more work to the downside.
If I am right about the bears’ current strategy, the next approach of 2750 ought to be most amusing… 🙂
If 2750 goes, DJIA 25K should be right behind…
Ah, yes. The fine feeling of being first, especially on the weekend.
The daily charts and data present a picture of distribution. The bulls would rather see accumulation. The bears are continuing to win.
Curses, Red Baron!!
They have certainly thrown down the gauntlet in futures with a gap down past the 2770 battlefield and are now targeting 2750. Let’s see how the bulls, aka banksters (there a very few retail traders left in this market!) respond and if they can defend 2750 and/or push price back above 2770. What happens here will give us a great hint of what the coming week will look like! 🙂
49 to 80 overnight in /ES. They ripped the souls out of the bears.
I would not put it in such stark terms. Stepping back and looking at the big picture, the banksters are fighting for their lives and will loose that fight until P4 completes. The bears will continue to hapoily “Sell the Rips” and/or add to short trades. 🙂
relatively small overnight move on super thin volume, Euro money…and immediately the market sells that off after the open. I think our soul’s are safe for the moment!
Looks like a small range day might be developing…but it’s early, and this early selling could develop into a rout.
I am persuaded my soul is safe forever. Regarding my being a bear or a bull in the equity markets, I like what Kevin’s states. He says something like, “I am neither. I just want to be on the side of who is in control and moving the market.” As far as my country goes, I am bullish on America which seems to be the only place in the world right now where the economy is hitting on all cylinders.
The bears are being really sneaky. They gently probe the pivots and force the banksters to step in with monster cash dumps to defend. After a bit of cat and mouse , they bring out a howitzer and blast the pivot to smithereens…funny!
2751 is a 61.8% retrace level that might hold this sell off. next down from there is 78.6% at 2732.9
That would be huge surprise. I am expecting a swift 38% retrace of the move up…at the very least.
You are misunderstanding me. The levels I present are (afaiac) merely possible turn points, which IF there is a turn, are far higher in probability to hold than at a random location. Fibo levels don’t predict the action. They just give edge if/when the action turns at those levels. So…hitting and turning at these levels (or not) shouldn’t surprise anyone.
And well well well, we have an initial indication that 62% is holding. For the moment…
I guess I did misinterpret “hold this sell off”
Got it.