
Upwards movement was again expected to continue but did not happen.
There are three Elliott wave counts today. Classic technical analysis favours the first two.
Summary: For the short term, tomorrow may see more downwards movement. The target is at support about 2,700; if that gives way, then about 2,677.
A primary degree correction should last several weeks and should show up on the weekly and monthly charts. Primary wave 4 may total a Fibonacci 8, 13 or 21 weeks. The preferred target for it to end is now about 2,700. Look for very strong support about the lower edge of the teal trend channel on the monthly chart.
Primary wave 4 should be expected to exhibit reasonable strength. This is the last multi week to multi month consolidation in this ageing bull market, and it may now begin to take on some characteristics of the bear market waiting in the wings.
The final target for this bull market to end remains at 3,616, which may be met in October 2019.
New updates to this analysis are in bold.
The biggest picture, Grand Super Cycle analysis, is here.
Last published monthly chart is here, video is here.
ELLIOTT WAVE COUNT
WEEKLY CHART
Click chart to enlarge.
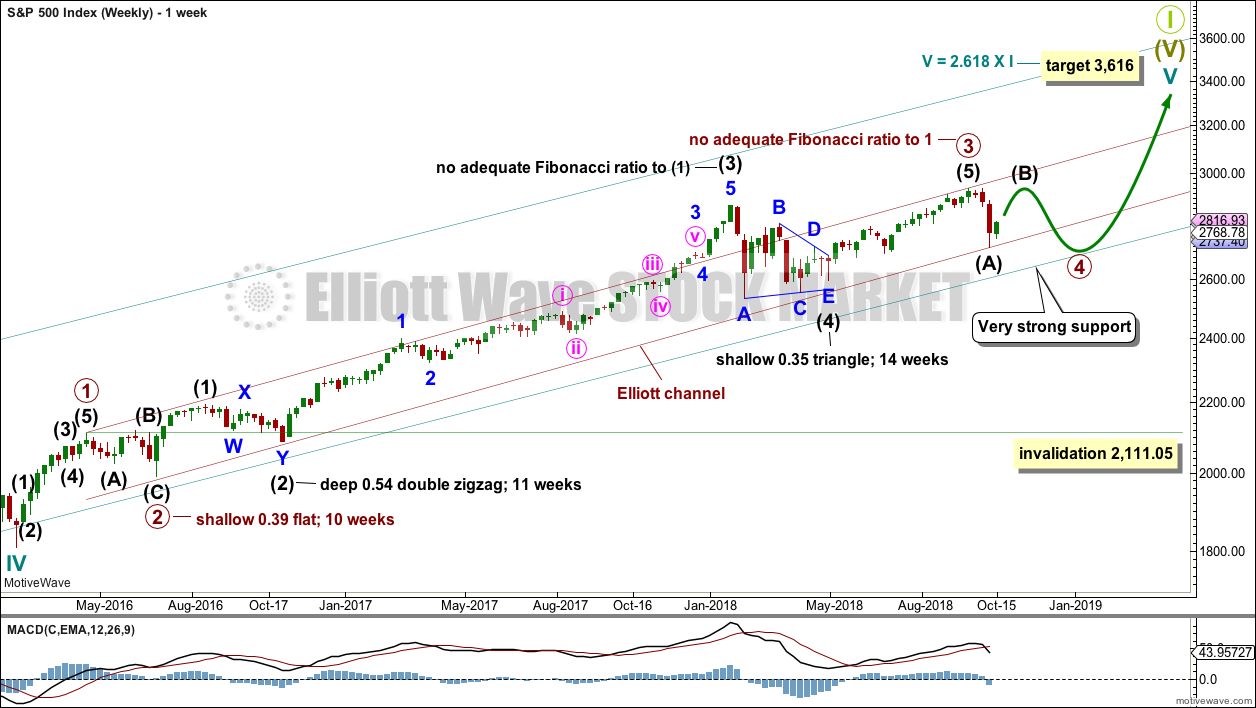
Cycle wave V must complete as a five structure, which should look clear at the weekly chart level and also now at the monthly chart level. It may only be an impulse or ending diagonal. It is clear it is an impulse.
Within cycle wave V, the third waves at all degrees may only subdivide as impulses.
Within primary wave 3, there is perfect alternation and excellent proportion between intermediate waves (2) and (4).
The channel is now drawn about primary degree waves. The first trend line is drawn from the ends of primary waves 1 to 3, then a parallel copy is placed upon the low of primary wave 2. Primary wave 4 may find support about the lower edge of this maroon channel. At the end of last week, that is exactly where price bounced up. The overshoot of the upper edge of this channel by the end of intermediate wave (3) looks typical. For the S&P, its third waves are usually the strongest portion of an impulse; they often exhibit enough strength to overshoot channels.
Fourth waves do not always end within channels drawn using this technique. If primary wave 4 breaks out of the narrow maroon channel, then it may find very strong support about the lower edge of the teal channel. This channel is copied over from the monthly chart and contains the entire bull market since its beginning in March 2009. While Super Cycle wave (V) is incomplete, this channel should not be breached.
Primary wave 4 may not move into primary wave 1 price territory below 2,111.05.
When primary wave 4 may be complete, then the final target may be also calculated at primary degree. At that stage, the final target may widen to a small zone, or it may change.
At this stage, the expectation is for the final target to be met in October 2019. If price gets up to this target and either the structure is incomplete or price keeps rising through it, then a new higher target would be calculated.
DAILY CHART
Click chart to enlarge.
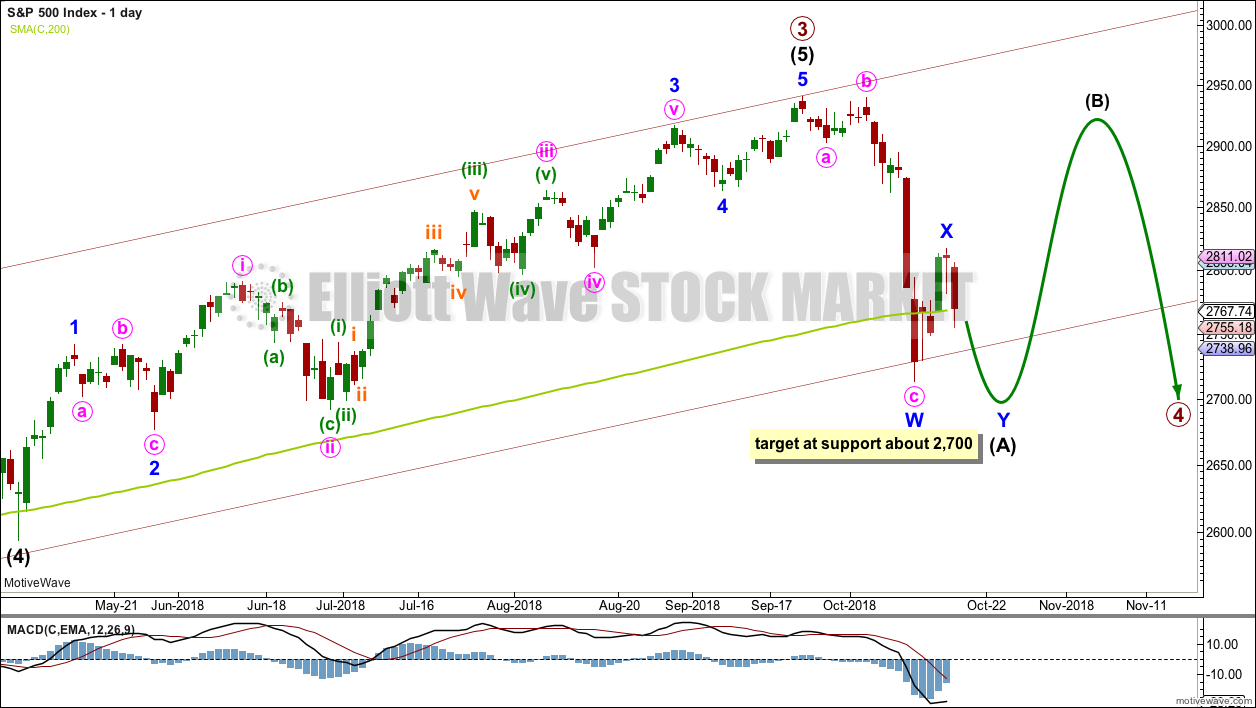
Primary wave 4 would most likely end somewhere within the price territory of the fourth wave of one lesser degree. Intermediate wave (4) has its price territory from 2,872.87 to 2,532.69. Within this range sit two Fibonacci ratios giving two targets. The 0.236 Fibonacci ratio has now been met and passed.
The 0.382 Fibonacci ratio of primary wave 3 at 2,578.30 would expect an overshoot of the teal channel. This may be too low; price may find support at the lower edge of the channel. However, as primary wave 4 should be expected to exhibit reasonable strength, it may be able to overshoot the channel and that would look reasonable.
Primary wave 2 unfolded as a shallow regular flat correction lasting 10 weeks.
Primary wave 4 may have begun with a zigzag downwards. This is relabelled today as the first zigzag in a possible double zigzag downwards for intermediate wave (A).
If intermediate wave (A) unfolds as a double zigzag, then primary wave 4 may be unfolding as either a flat or a triangle. A double zigzag may not be labelled as intermediate wave (W) because the maximum number of corrective structures is three, and to label multiples within multiples increases the maximum beyond three and violates an Elliott wave rule.
If primary wave 4 is unfolding as a flat correction, then intermediate wave (A) may be a double zigzag. Primary wave B may then bounce higher to retrace a minimum 0.9 length of primary wave A, and may make a new high above the start of primary wave A as in an expanded flat correction.
If primary wave 4 is unfolding as a triangle, then intermediate wave (A) may be a double zigzag. Primary wave B would have no minimum required length, and would most commonly be about 0.8 to 0.85 the length of primary wave A.
Primary wave 4 may not move into primary wave 1 price territory below 2,111.05.
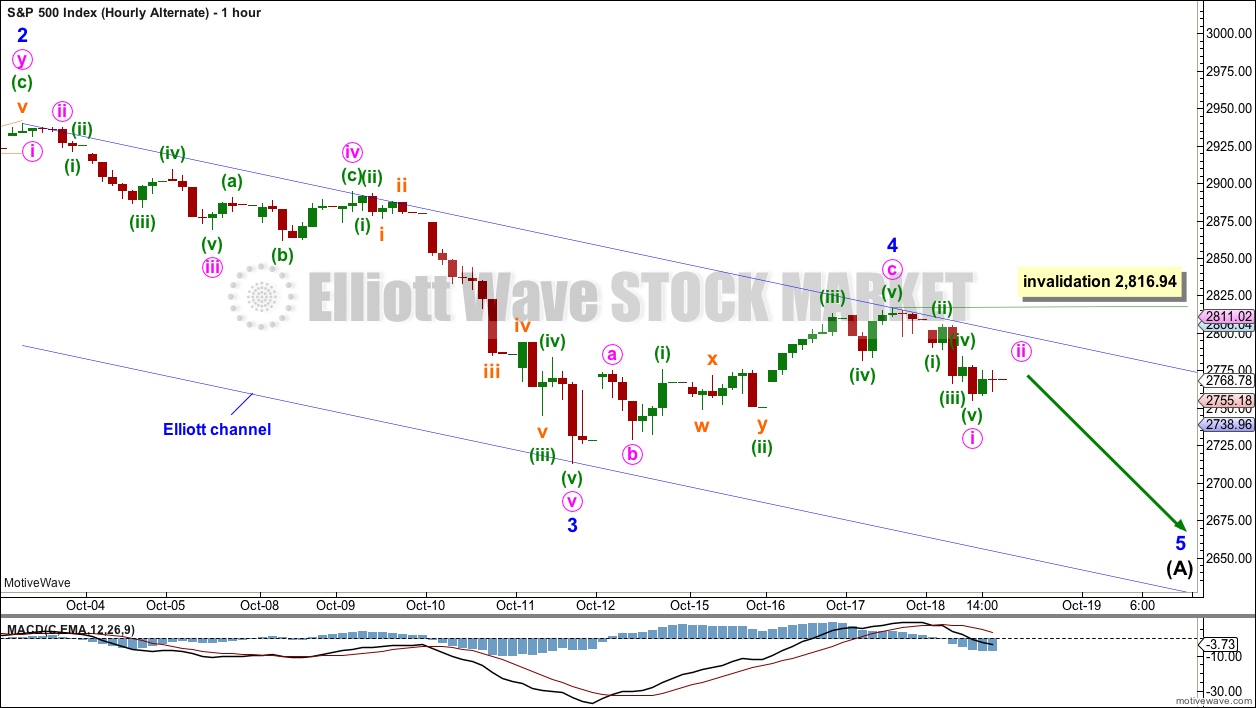
HOURLY CHART
Click chart to enlarge.
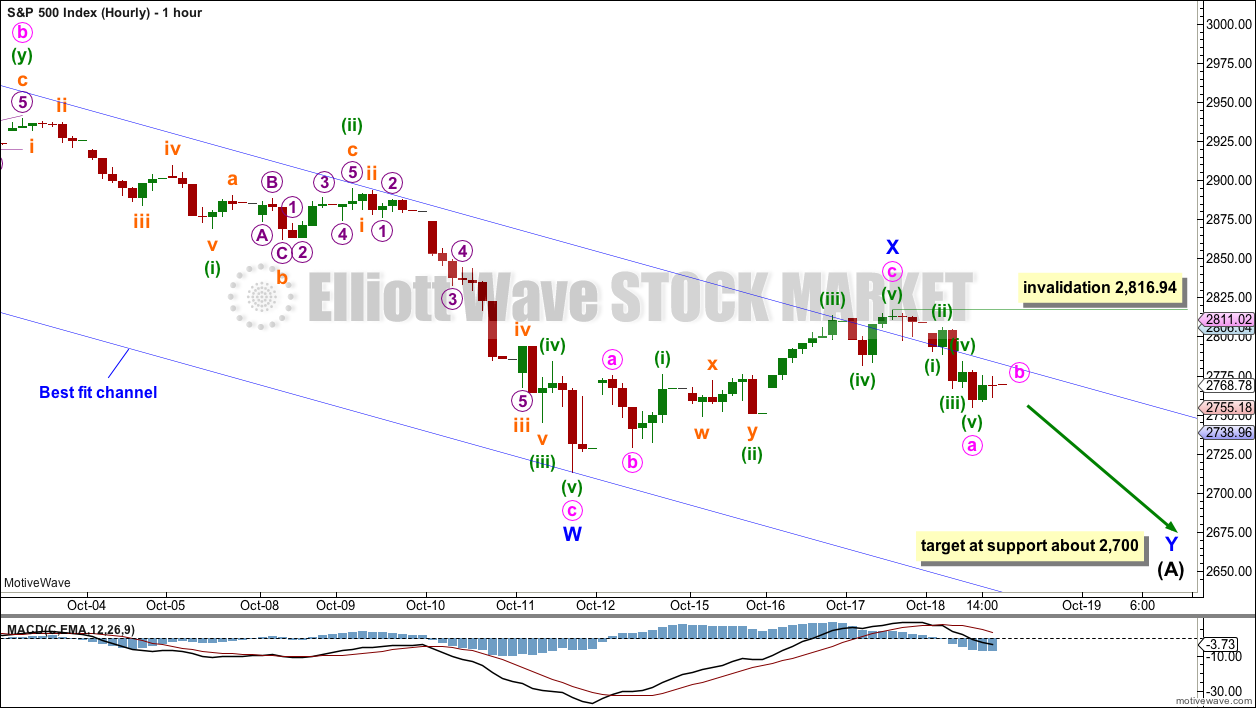
Intermediate wave (A) may be an incomplete double zigzag. The fist zigzag in the double may be complete, labelled minor wave W. The double may now be joined by a completed three in the opposite direction, a zigzag labelled minor wave X.
Double zigzags should have a strong slope against the prior trend, downwards in this case, and to achieve a strong slope their X waves are normally brief and shallow. The second zigzag in a double has the purpose of deepening the correction when the first zigzag does not move price deep enough. Minor wave Y may end about support at 2,700, which would achieve its purpose of deepening the correction below the end of minor wave W at 2,713.29.
Within minor wave Y, minute wave b may not move beyond the start of minute wave a at 2,816.94.
ALTERNATE DAILY CHART
Click chart to enlarge.
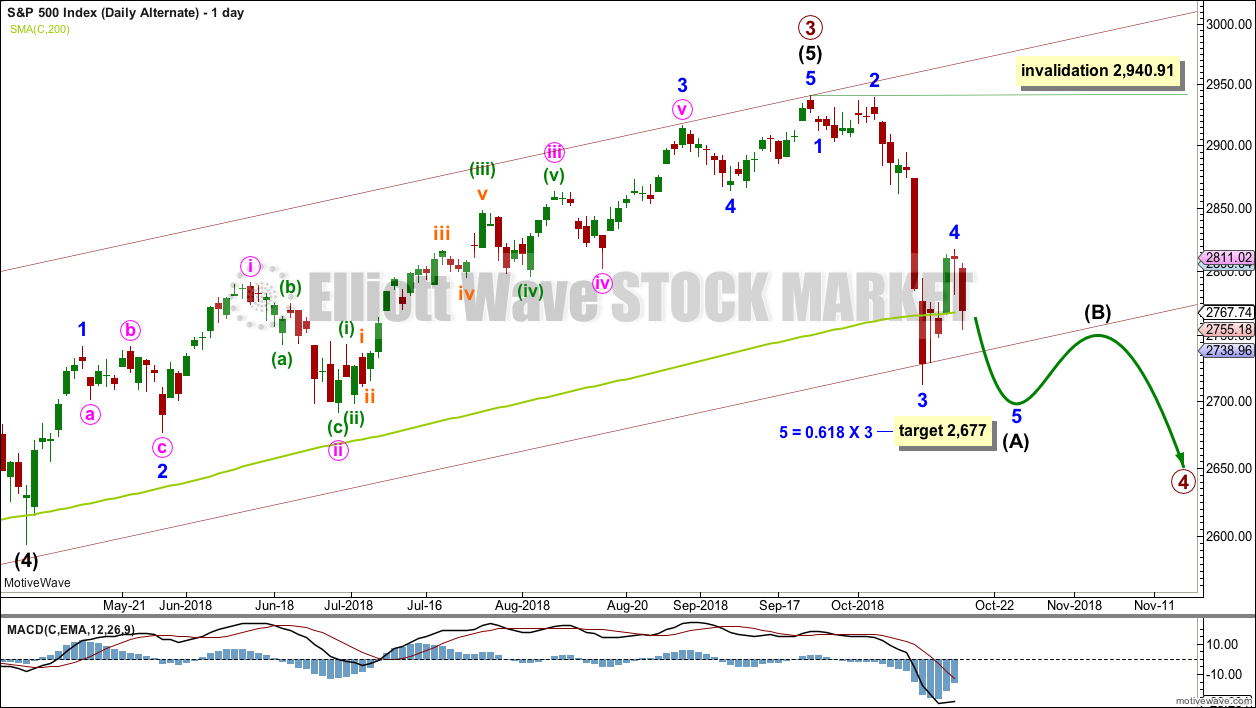
It is also possible to see intermediate wave (A) as an incomplete five wave structure.
There is now reasonably good proportion between minor waves 2 and 4 within this wave count. Additionally, there is alternation between the deep 0.96 combination of minor wave 2 and the shallow 0.46 zigzag of minor wave 4.
There is no adequate Fibonacci ratio between minor waves 3 and 1. This makes it more likely that minor wave 5 may exhibit a Fibonacci ratio to either of minor waves 3 or 1. Because minor wave 1 was very short, a Fibonacci ratio to minor wave 3 here looks slightly more likely.
If intermediate wave (A) ends with closing below the lower edge of the maroon channel, which is copied over from the weekly chart, then intermediate wave (B) may bounce up to test resistance there.
Intermediate wave (B) may not move beyond the start of intermediate wave (A) above 2,940.91.
ALTERNATE HOURLY CHART
Click chart to enlarge.
The channel is redrawn about this possible impulse downwards using Elliott’s second technique. Draw the first trend line from the ends of minor waves 2 to 4, then place a parallel copy on the end of minor wave 3.
Minor wave 5 may end either midway within the channel or about the lower edge if the target is inadequate.
Within minor wave 5, minute wave ii may not move beyond the start of minute wave i above 2,816.94.
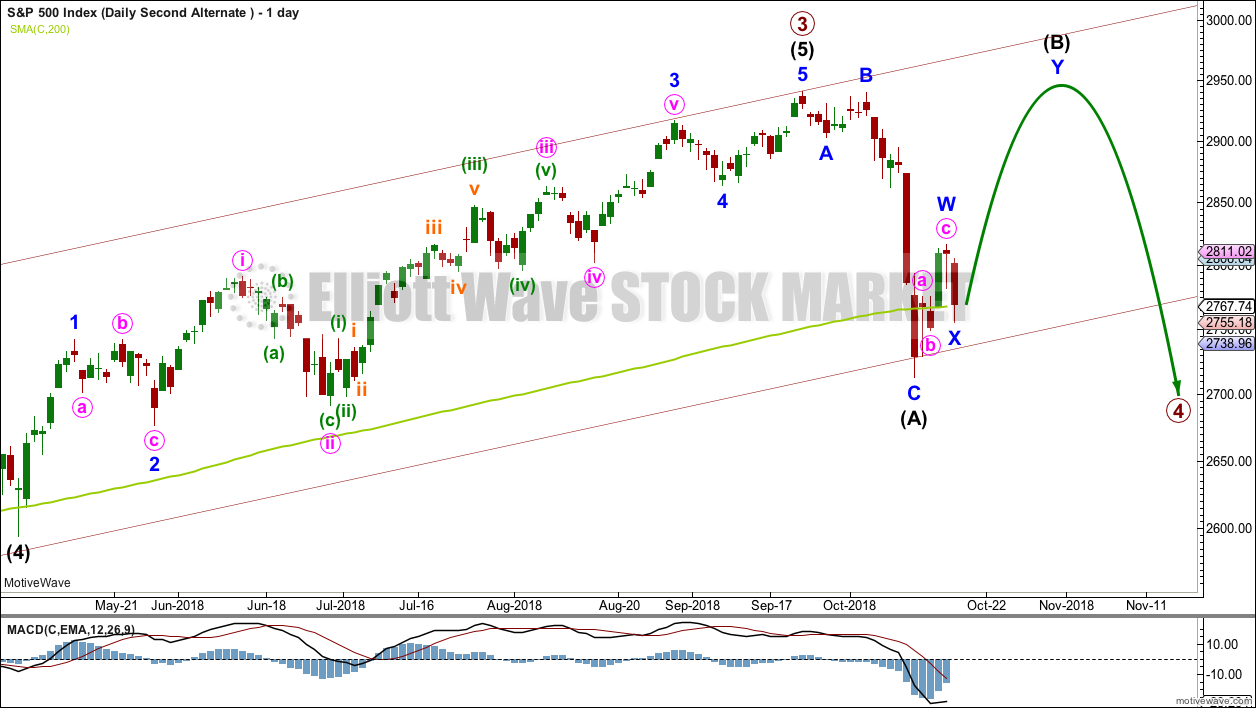
SECOND ALTERNATE DAILY CHART
Click chart to enlarge.
It is also possible to still see intermediate wave (A) as a complete zigzag. The bounce may continue tomorrow for intermediate wave (B).
If intermediate wave (A) is a zigzag, then primary wave 4 may be unfolding as a flat or triangle.
The zigzag may also be labelled intermediate wave (W), because primary wave 4 may be unfolding as a double combination with the first structure a zigzag and the second structure most likely a flat.
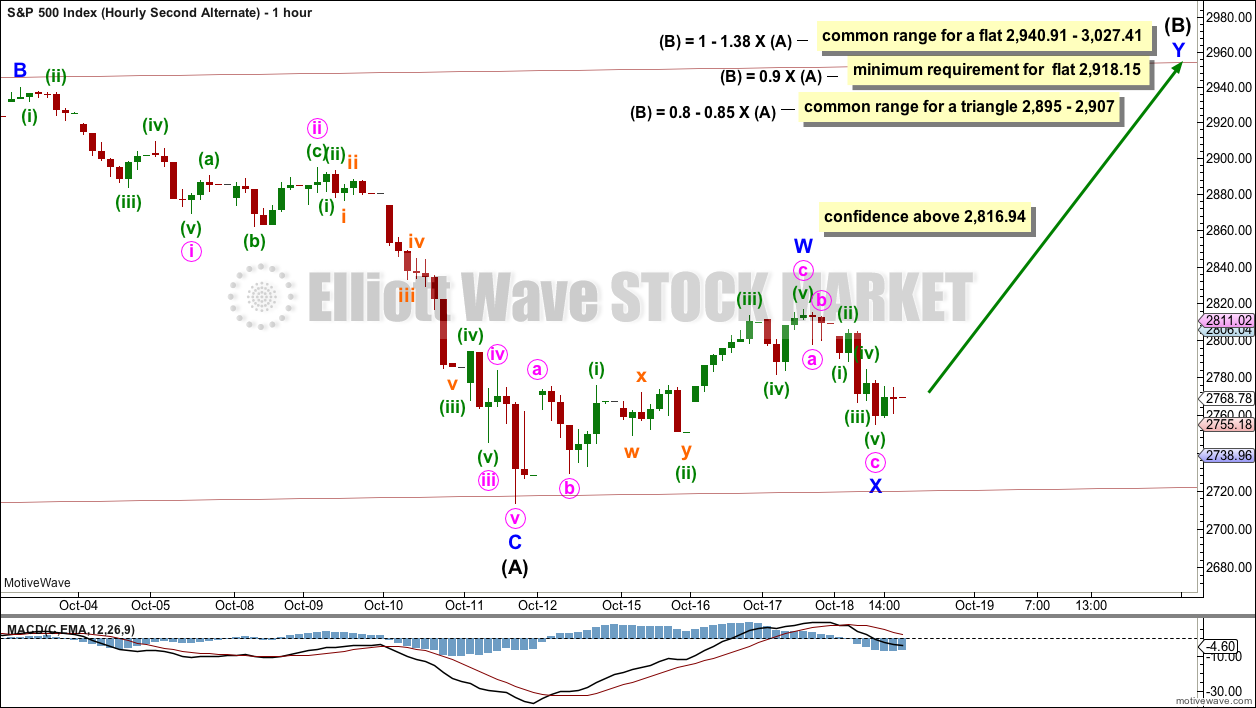
SECOND ALTERNATE HOURLY CHART
Click chart to enlarge.
If intermediate wave (A) is a complete zigzag, then intermediate wave (B) would be expected to be a very high bounce.
The minimum requirement for intermediate wave (B) within a flat correction is for it to retrace 0.9 of intermediate wave (A).
There is no minimum requirement for the length of intermediate wave (B) within a triangle.
This alternate wave count expects that intermediate wave (A) found support at the lower edge of the maroon channel. If primary wave 4 continues as a triangle, then support at that line may hold.
A new high above 2,816.94 by any amount at any time frame tomorrow would add some confidence to this alternate wave count. At that stage, a continuation of a deep bounce would be most likely.
TECHNICAL ANALYSIS
WEEKLY CHART
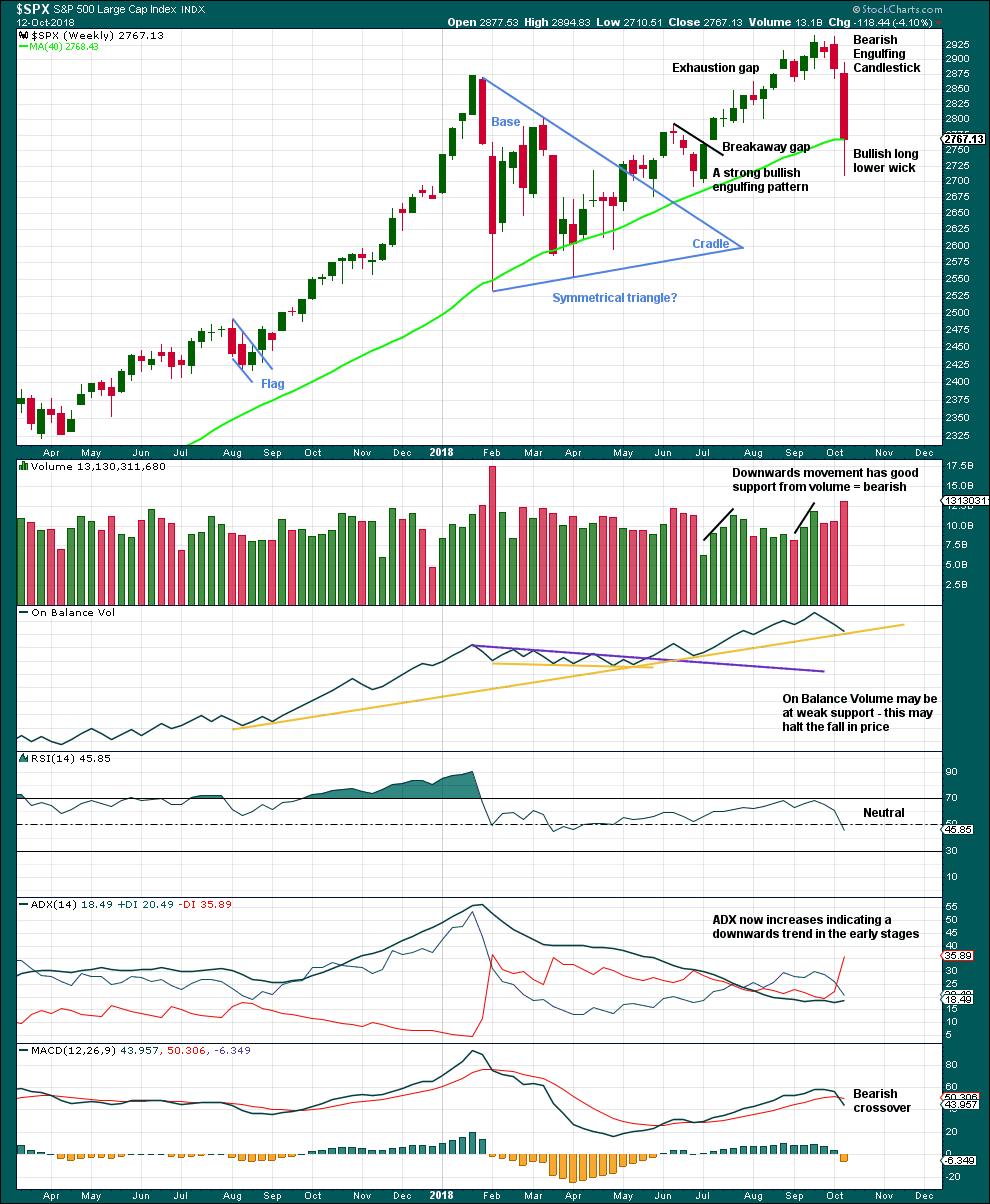
Click chart to enlarge. Chart courtesy of StockCharts.com.
The symmetrical triangle base distance is 340.18. Added to the breakout point of 2,704.54 this gives a target at 3,044.72. This target was not met; it was too optimistic.
The long lower wick on this weekly candlestick suggests a bounce this week.
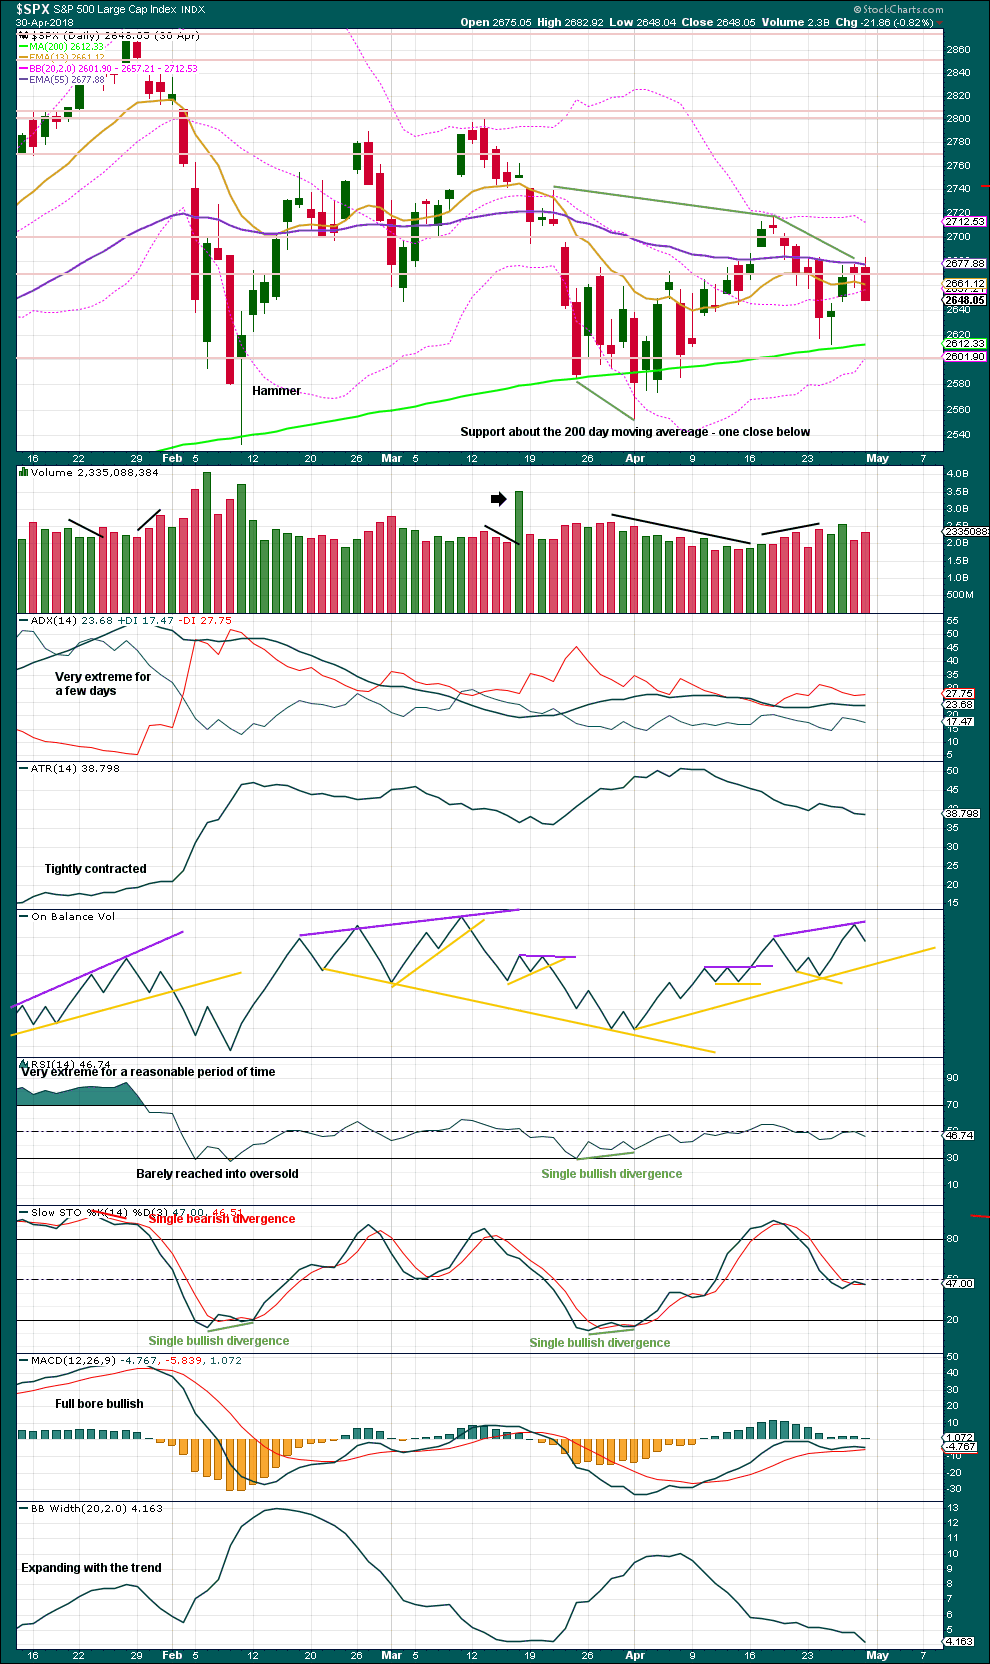
DAILY CHART
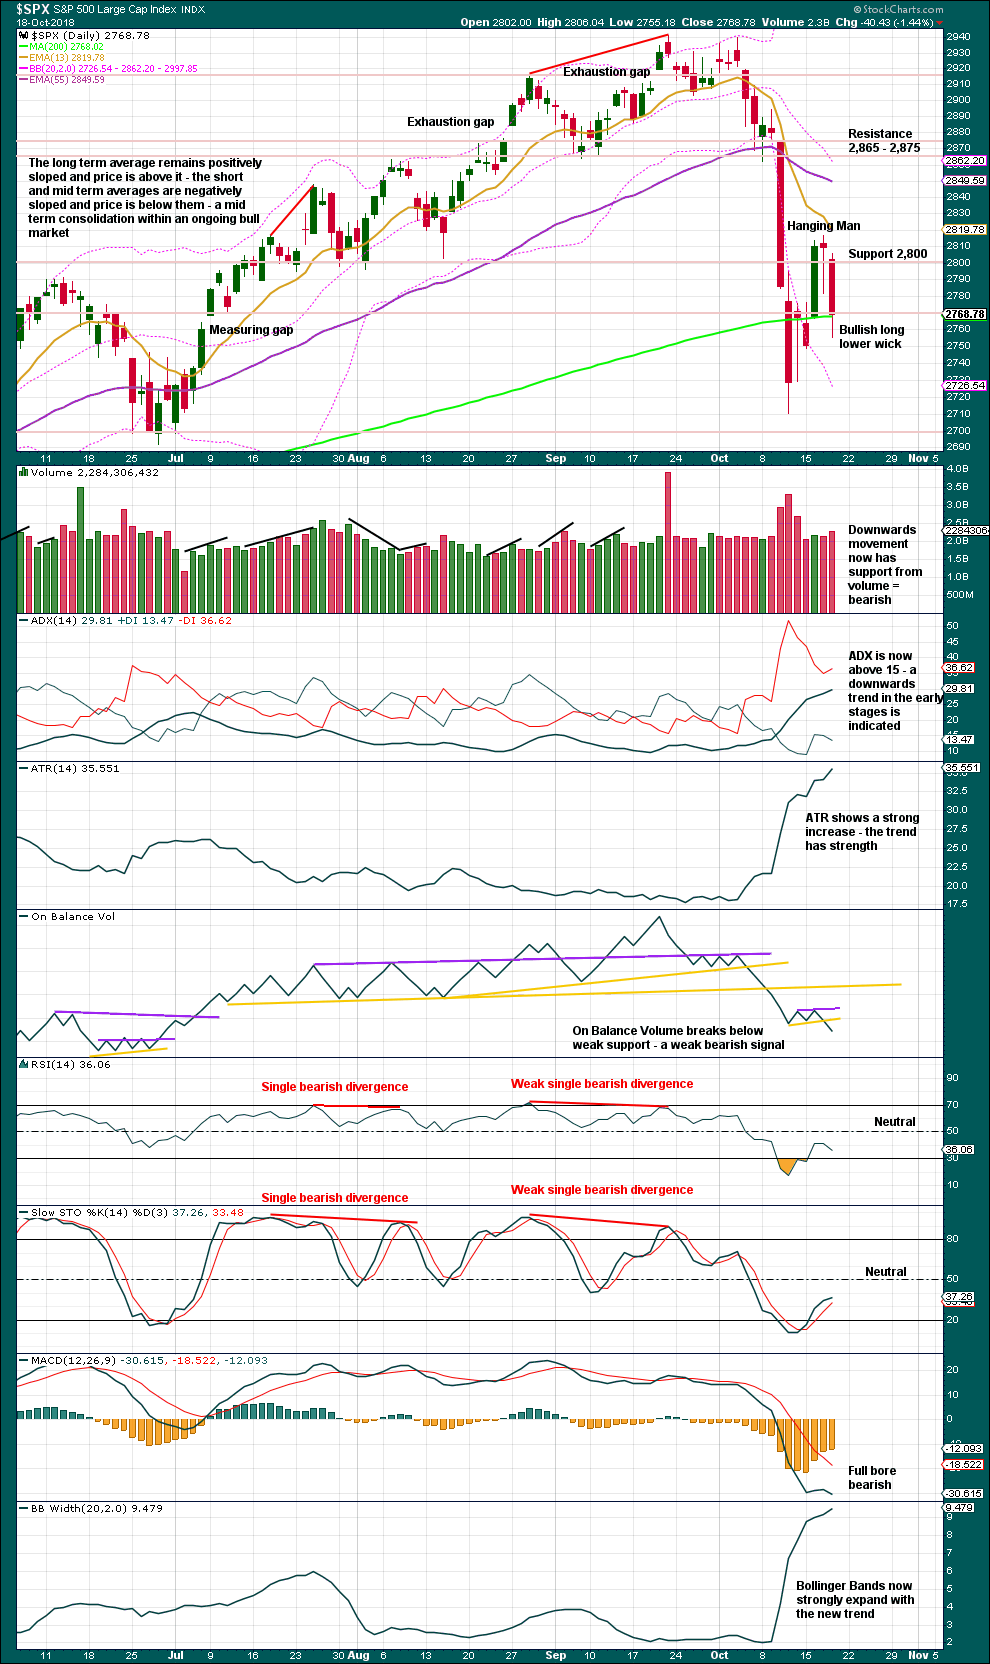
Click chart to enlarge. Chart courtesy of StockCharts.com.
The Hanging Man candlestick now has bearish confirmation, so it may be read as a bearish reversal pattern.
This bounce has brought RSI and Stochastics up from oversold. There is now again room for price to continue lower.
The bearish signal from On Balance Volume is weak because the trend line breached was short held and had only the minimum of two anchor points. It had only weak technical significance.
Bullishness of the long lower wick today indicates downwards movement may be a little limited. If price makes new lows shortly and there exhibits bullish divergence with one or more of RSI, Stochastics, the AD line or VIX, then a more sustained bounce may be initiated from new lows.
Look out for support below about 2,700.
VOLATILITY – INVERTED VIX CHART
WEEKLY CHART

Click chart to enlarge. Chart courtesy of StockCharts.com. So that colour blind members are included, bearish signals
will be noted with blue and bullish signals with yellow.
Primary wave 4 has now arrived and is showing reasonable strength. There is continuing mid term bearish divergence this week with inverted VIX making a new low below the prior swing low of the week beginning 25th June, but price has not yet made a corresponding new low.
As primary wave 4 continues this weekly chart may offer a bullish signal at its end.
DAILY CHART
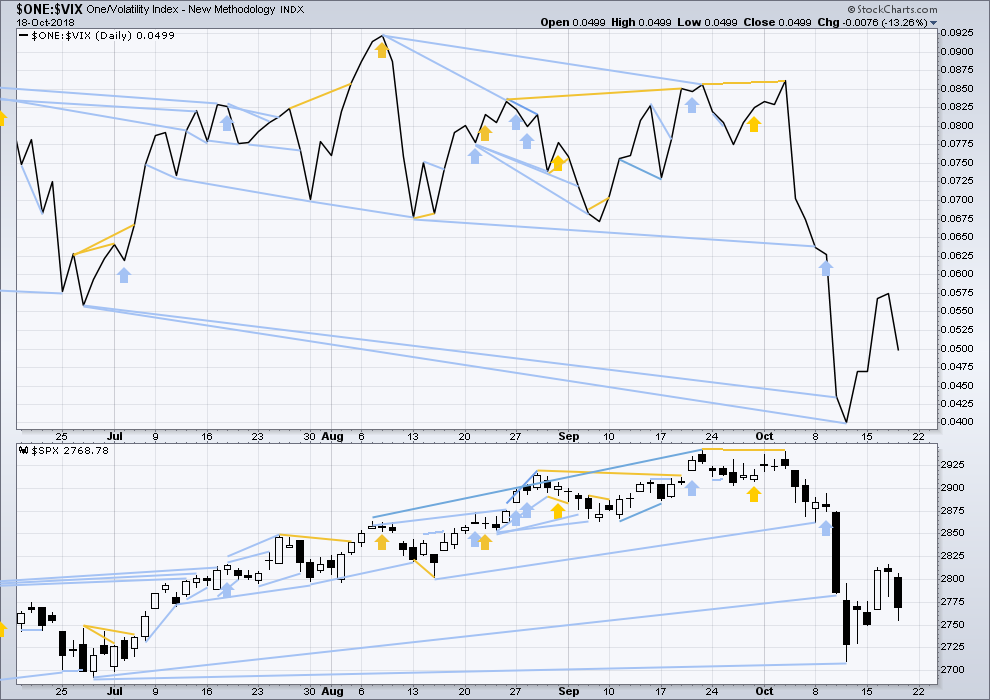
Click chart to enlarge. Chart courtesy of StockCharts.com. So that colour blind members are included, bearish signals
will be noted with blue and bullish signals with yellow.
Normally, volatility should decline as price moves higher and increase as price moves lower. This means that normally inverted VIX should move in the same direction as price.
Downwards movement today comes with a normal corresponding increase in volatility as inverted VIX declines. There is no new short term divergence.
BREADTH – AD LINE
WEEKLY CHART
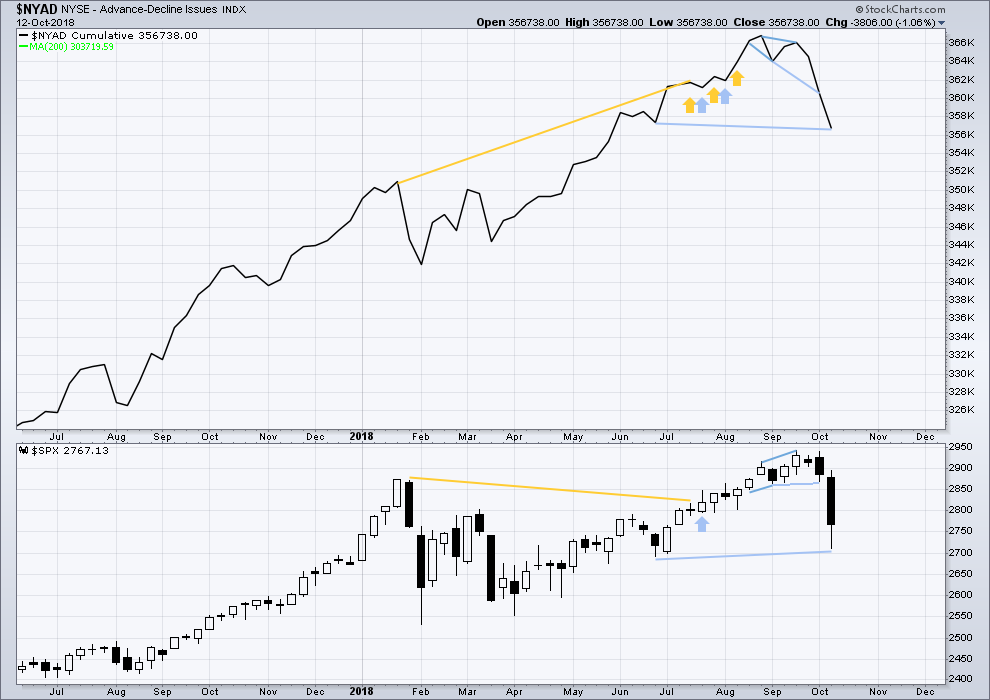
Click chart to enlarge. Chart courtesy of StockCharts.com.
When primary wave 3 comes to an end, it may be valuable to watch the AD line at the weekly time frame as well as the daily.
Last week the AD line has made a slight new low below the prior swing low of the week beginning 25th June, but price has not. This mid term divergence is bearish, but it is weak.
DAILY CHART
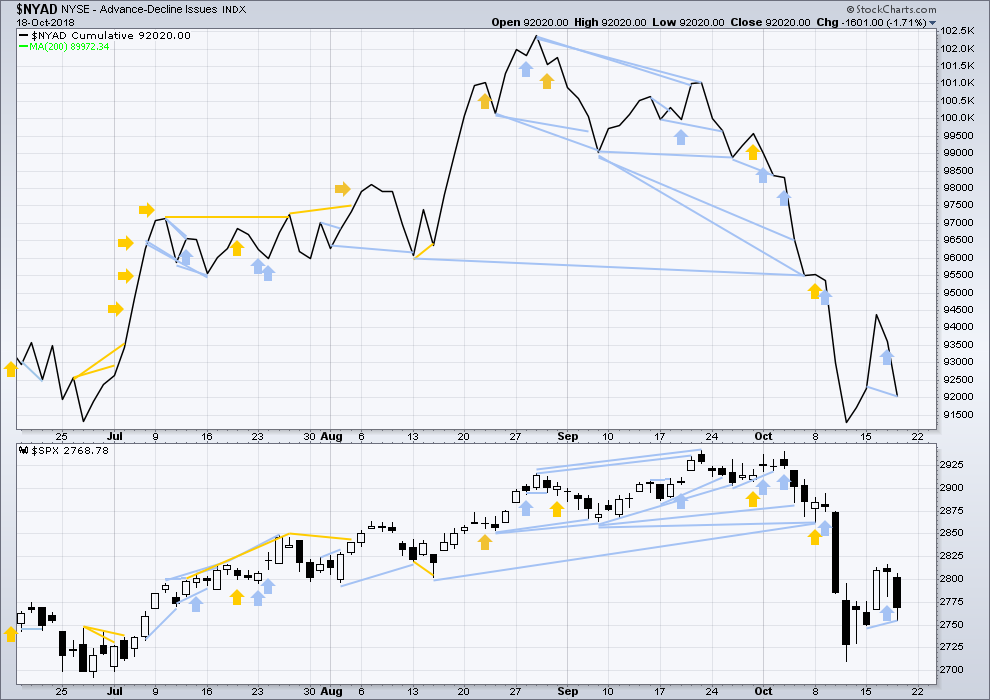
Click chart to enlarge. Chart courtesy of StockCharts.com.
There is normally 4-6 months divergence between price and market breadth prior to a full fledged bear market. This has been so for all major bear markets within the last 90 odd years. With no longer term divergence yet at this point, any decline in price should be expected to be a pullback within an ongoing bull market and not necessarily the start of a bear market. New all time highs from the AD line on the 29th of August means that the beginning of any bear market may be at the end of December 2018, but it may of course be a lot longer than that. My next expectation for the end of this bull market may now be October 2019.
Breadth should be read as a leading indicator.
Today the AD line has made a new low below the prior low of the 15th of October, but price has not. This divergence is short term and bearish; it is reasonable, but it is not very strong. This supports the first two Elliott wave counts.
Both mid and small caps for Wednesday have long lower wicks. These may now be read as Hanging Men as they both come today with bearish confirmation. However, none of the Hanging Men on all of large, mid or small caps come at an all time high or at the end of a substantial move, so the bearish signal is not a strong one.
DOW THEORY
The following lows need to be exceeded for Dow Theory to confirm the end of the bull market and a change to a bear market:
DJIA: 23,344.52.
DJT: 9,806.79.
S&P500: 2,532.69.
Nasdaq: 6,630.67.
ANALYSIS OF INTERMEDIATE WAVE (4)
TECHNICAL ANALYSIS
Click chart to enlarge. Chart courtesy of StockCharts.com.
Intermediate wave (4) was a large symmetrical triangle. The deepest wave was the first wave. At its low there was a clear candlestick reversal pattern and bullish divergence between price and Stochastics.
RSI barely managed to reach into oversold.
The current correction for primary wave 4 may behave differently, but there should be some similarities.
It is expected that primary wave 4 may be stronger than intermediate wave (4).
VIX
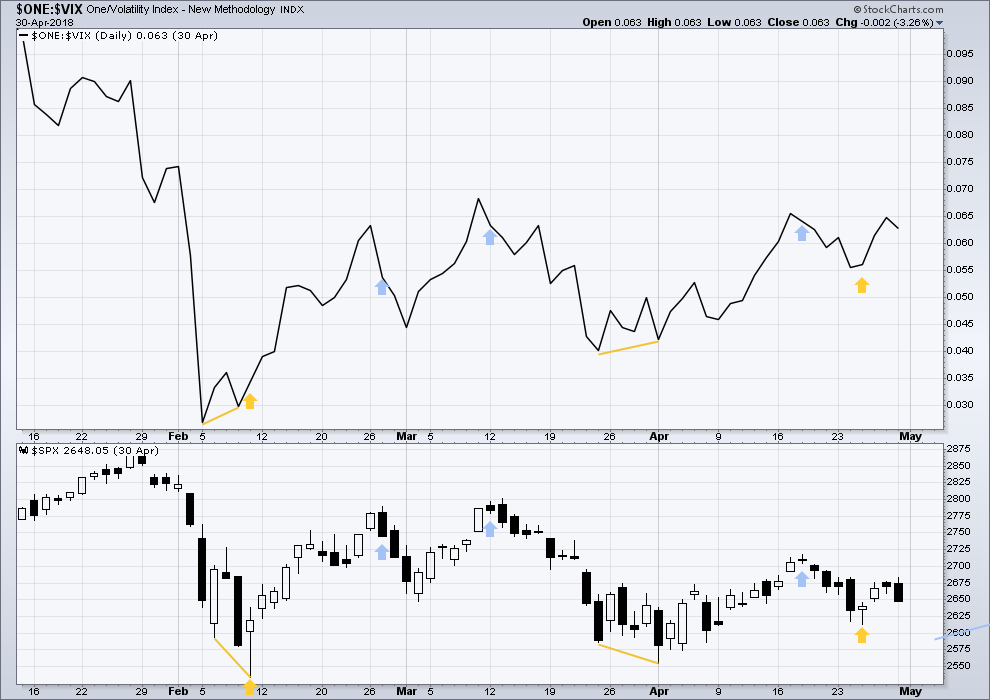
Click chart to enlarge. Chart courtesy of StockCharts.com.
This is a daily chart.
At the two major lows within intermediate wave (4), inverted VIX exhibited single short term bullish divergence.
At highs within intermediate wave (4), inverted VIX exhibited one single day bullish divergence with price.
AD LINE
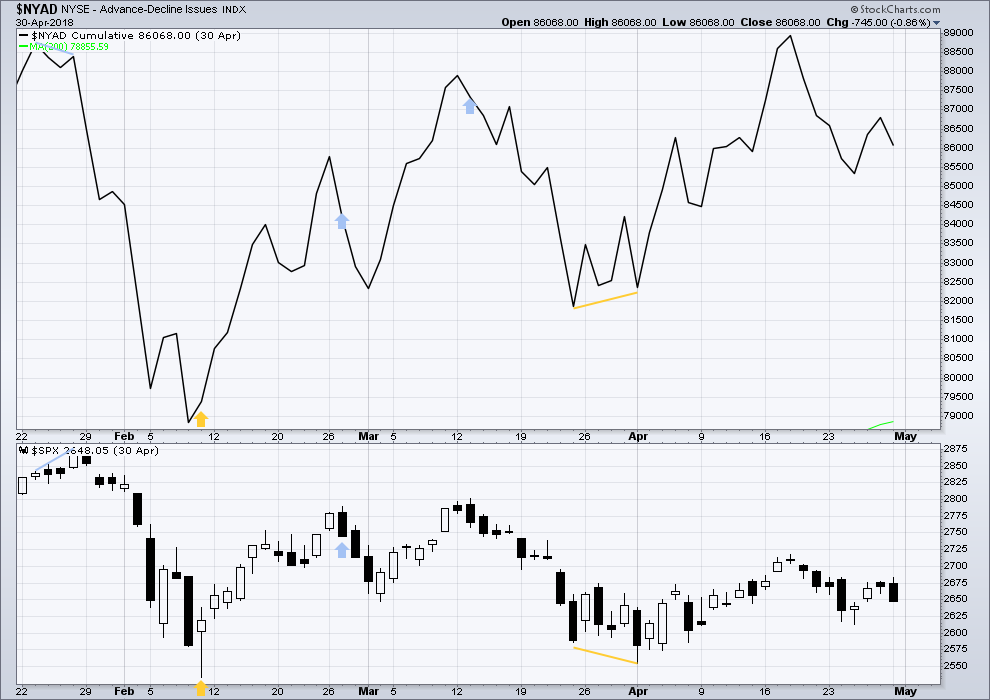
Click chart to enlarge. Chart courtesy of StockCharts.com.
This is a daily chart.
At the two major lows within intermediate wave (4), there was bullish divergence between price and the AD line. At the two major highs within intermediate wave (4), there was each one instance of single day bearish divergence.
Published @ 09:02 p.m. EST.
—
Careful risk management protects your trading account(s).
Follow my two Golden Rules:
1. Always trade with stops.
2. Risk only 1-5% of equity on any one trade.
A small move up to a 61.8% and a turn and reasonable size sell off is a PERFECT DAY in my book! The way I trade intraday that’s shooting fish in a barrel. “That’s the way, I like it!” Now onward soon to some more serious C down action, please Madame Market! I’ve got some position trades that are hungry.
Have a great weekend all.
Good morning everybody. As noted below, with this sideways movement either of the three EW counts could be correct. And I am not able to tell you which one is correct, I am only able to say that the first two have more support from classic TA.
Here is an updated chart for the first hourly count. If this is correct, then wave C down should be beginning. Monday may show downwards strength. C waves can behave like third waves.
Here is the second hourly count updated. If this count is correct, then a third wave down may begin and may show strength on Monday.
And finally, the second alternate hourly count updated.
If this count is correct then a third wave up may begin on Monday and may show strength by Tuesday / Wednesday.
This count so far has less support from classic TA.
On the five minute chart, the last small bounce subdivides best as a three. So I would be expecting this session to end with downwards movement, possibly a new low below 2,760.27 (the low so far today).
If that happens then today’s candlestick is going to have a rather long upper wick, which is bearish. Then downwards movement for Monday would look most likely.
thanks Kevin
Anyone know what count we’re in?
Seems like it could be either the main hourly or the alternate hourly. They are rather similar in what was called for, and it’s been happening. So ???.
I do see on the 5 minute what looks to me like a 5 down from the high today, then a 3 up, and now…the start (still in the i?) of another 5 down. I could easily be alllll wrong.
Wowza have I run into a defect (“bug”) in the interactive brokers “trader workstation” (I’m using the latest “stable” version, ha ha).
Simply put, when I ADD to an existing option position, it fails to include that additional investment cost in the calculation of the open profit (even though all the other values displayed are correct, i.e. # of options, total market value, current price, etc.).
I sold a position today quickly when it showed “lots” of profit. Stupid me didn’t stop to wonder why or how because “where did that come from???”, no I just took it because the market was topping. And suddenly my total profit for the day is DOWN, not up!!!! Now I have a similar situation doing the same thing, but fool me one, shame on you, fool me twice shame on me!!
So anyone using IB’s trader workstation, LOOK OUT for this. Again, it seems to lose it’s mind when adding to an existing position.
TNX and SPX moving in lockstep here… all of the movement for the entire year has been in response to yields. Market makers seem determined to run as many stops as possible here before making a break one way or the other. I’m seeing a symmetrical triangle in TNX that makes me yields will spike to the upside next week and the break will be down.
I’d sure like to see SPX stay below the down trend (upper Elliott channel) line. Cracking that is likely significant re: expect nature of early next week action. I’m not loaded to the gills with bear put debit spreads…but I am loaded with ’em! Banking on that P4 playing out more thoroughly as I’m sure many others are.
Anyone else take the break upward over the last week or two in gold? I put on a rather large GLD 114/116 bull spread with an expiry in March, figuring my odds overall by then given Lara’s primary counts are quite bullish and the break upward looks legit so far (though another push up soon would be nice).
2793.7 = 61.8%
2800 = roundie
2804 = 78.6%
all high potential turn price levels.
You mean back down again Kevin ?
What goes up always breaks it trend and turns at some point Nino. The question is, when and where. Can happen anywhere…but when they initiate right at key fibonacci retrace levels, they have tendency to be more “real” and significant (they have more tendency to hold as the pivot point). So I’m not predicting a turn at these levels. I’m identifying them because IF a turn initiates at one of these levels, it may be THE turn. And for me, much more possibly tradable than an indication of a turn at a random price level. These levels give edge. IMO and experience. Your mileage may vary.
The action at the 1 minute in SPX tells a story…it DID pause right under the 61.8% level, but by no means gave what I would consider “sell triggers” before it pushed back up and through. So that level “failed”. Onward to the next…
Picking up what your putting down buddy
Ps I’m a long haul captain. So I appreciate what goes up eventually comes down. Hehe ??
If you are into books (some traders I know haven’t read a book in their life!), re: fibo level trading I cannot over recommend Boroden’s book “Fibonacci Trading”. 90% of specifics I share here are just using her simple techniques.
Yes, it’s just like airplanes! Except it’s also completely different…lol!
Happy Friday, I’m ready…
I’m into theory as opposed to visual. Thankyou for the heads up
theory or visual…I hope you caught that turn and took advantage of that swing high!
I shorted at 2778
The algos target that level. It seems as if they like to push it just past to around 72 to trap the unwary! ?
If SPX drops back under the 50% at 2786 I do believe this push up is over, and after a lot of scribbling “on top”, I would say in that case the 61.8% held, as it so often does.
We could be in a C up already?
The US dollar looks extremely bullish to me. $DXY in a multi-week squeeze and the chart is “squeezing” price up the to the right as well. I’ll be looking to get in perhaps around the middle of this week’s bar, or if price just starts ascending, just above recent market. Could get a very strong run up out of this set up.
I’ll be trading UUP via options. This is weekly. Looking for a bunch of green bars up to develop here…
Thank you for sharing.
I think that breakout corresponds / confirms another deep push in this S&P P4. SP, dollar, rates all repricing in short term.
En! (Hint: It is Norwegian)
Oh no. Kevin beat me to it.
#1
How are you foist all the time man?
🙂
Proprietary trade secret Ari!